In the rapidly evolving technology sector, UiPath Inc. and PagerDuty, Inc. stand out as leaders in automation and digital operations management. UiPath specializes in robotic process automation, streamlining complex workflows, while PagerDuty focuses on real-time incident response and system reliability. Both companies innovate to enhance enterprise efficiency, making them compelling candidates for investors seeking growth in software infrastructure and applications. Join me as we explore which stock offers the most promising investment opportunity.
Table of contents
Companies Overview
I will begin the comparison between UiPath Inc. and PagerDuty, Inc. by providing an overview of these two companies and their main differences.
UiPath Inc. Overview
UiPath Inc. is a technology company specializing in robotic process automation (RPA) with an end-to-end automation platform. Founded in 2005 and headquartered in New York City, UiPath serves sectors such as banking, healthcare, and government. Its platform integrates artificial intelligence, low-code development, and centralized management tools to automate complex business processes, supporting attended and unattended automation workflows.
PagerDuty, Inc. Overview
PagerDuty, Inc. operates a digital operations management platform designed to process data signals from software-enabled systems using machine learning. Founded in 2009 and based in San Francisco, PagerDuty serves industries including telecommunications, retail, and financial services. Its platform focuses on correlating and predicting operational issues to improve digital reliability and performance for global clients.
Key similarities and differences
Both UiPath and PagerDuty operate in the technology sector with platforms leveraging advanced software and machine learning to improve business operations. UiPath focuses on automation across business processes using RPA, whereas PagerDuty emphasizes digital operations management and incident response. UiPath has a larger workforce and market cap, reflecting its broader service scope, while PagerDuty targets operational efficiency and issue prediction in diverse industries.
Income Statement Comparison
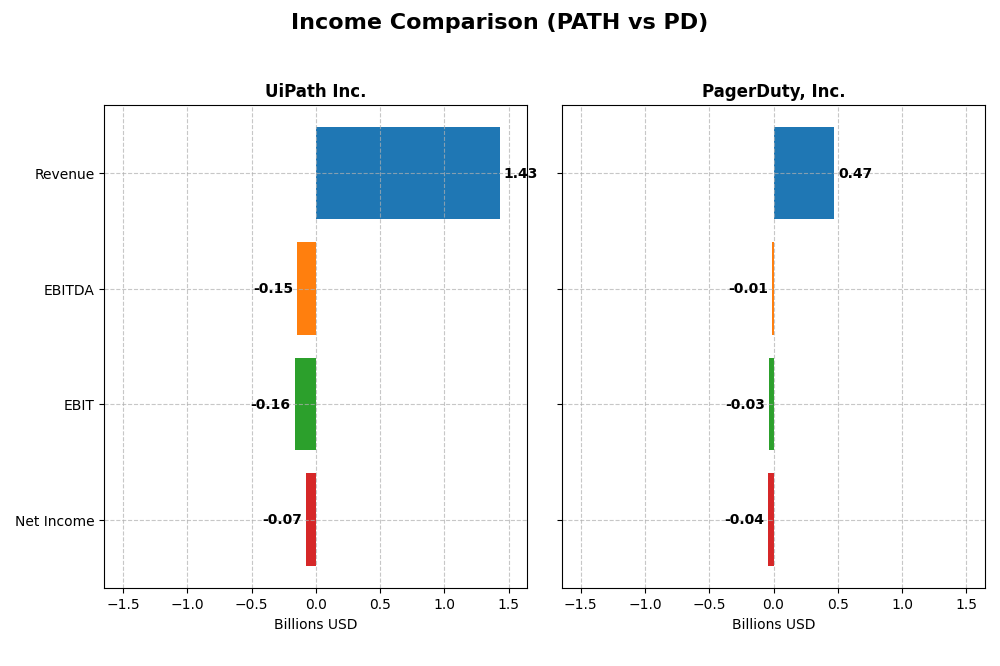
The table below compares key income statement metrics for UiPath Inc. and PagerDuty, Inc. based on their most recent fiscal year data.
| Metric | UiPath Inc. (PATH) | PagerDuty, Inc. (PD) |
|---|---|---|
| Market Cap | 8.5B | 1.1B |
| Revenue | 1.43B | 467.5M |
| EBITDA | -145M | -11.9M |
| EBIT | -163M | -32.5M |
| Net Income | -73.7M | -42.7M |
| EPS | -0.13 | -0.59 |
| Fiscal Year | 2025 | 2025 |
Income Statement Interpretations
UiPath Inc.
UiPath’s revenue rose steadily from 607M in 2021 to 1.43B in 2025, showing a strong 135% growth over five years. Net income improved from a loss of 92M to a smaller loss of 74M, with net margin rising from -15% to -5%. The 2025 fiscal year saw a 9.3% revenue increase and a 25% net margin improvement, indicating solid margin recovery despite ongoing losses.
PagerDuty, Inc.
PagerDuty’s revenue grew from 214M in 2021 to 467M in 2025, nearly doubling with a 119% increase. Net income losses narrowed significantly from 69M to 43M, and net margin improved from -32% to -9%. In 2025, the company posted an 8.5% revenue rise and a 52% net margin growth, reflecting marked profitability progress even as operating losses persist.
Which one has the stronger fundamentals?
Both companies exhibit favorable revenue growth and margin improvements, with PagerDuty showing a higher percentage gain in net income and EBIT margins recently. UiPath benefits from a larger scale and lower interest expenses. Overall, PagerDuty’s stronger margin progress contrasts with UiPath’s larger revenue base and sustained gross margins, presenting differing but favorable fundamentals for investors to consider.
Financial Ratios Comparison
The table below presents the most recent key financial ratios for UiPath Inc. and PagerDuty, Inc., based on their fiscal year 2025 data. These ratios offer insights into profitability, valuation, liquidity, leverage, and operational efficiency.
| Ratios | UiPath Inc. (PATH) | PagerDuty, Inc. (PD) |
|---|---|---|
| ROE | -3.99% | -32.92% |
| ROIC | -7.41% | -9.66% |
| P/E | -108.0 | -39.9 |
| P/B | 4.31 | 13.12 |
| Current Ratio | 2.93 | 1.87 |
| Quick Ratio | 2.93 | 1.87 |
| D/E (Debt-to-Equity) | 0.04 | 3.57 |
| Debt-to-Assets | 2.72% | 50.00% |
| Interest Coverage | 0 | -6.46 |
| Asset Turnover | 0.50 | 0.50 |
| Fixed Asset Turnover | 14.41 | 16.61 |
| Payout ratio | 0 | 0 |
| Dividend yield | 0 | 0 |
Interpretation of the Ratios
UiPath Inc.
UiPath exhibits a mixed financial profile with strong liquidity ratios (current and quick ratios near 2.93) and low leverage (debt-to-equity at 0.04), signaling solid short-term financial health and conservative debt use. However, profitability ratios such as net margin (-5.15%), ROE (-3.99%), and ROIC (-7.41%) are unfavorable, raising concerns about operational efficiency. The company does not pay dividends, likely reflecting a reinvestment strategy focused on growth and platform development.
PagerDuty, Inc.
PagerDuty shows favorable liquidity with a current ratio of 1.87 but struggles with high leverage, reflected in a debt-to-assets ratio of 50% and debt-to-equity of 3.57, which may increase financial risk. Profitability metrics including net margin (-9.14%) and ROE (-32.92%) are weak, suggesting ongoing operational challenges. PagerDuty does not distribute dividends, which may indicate prioritization of reinvestment in technology and expansion rather than shareholder returns.
Which one has the best ratios?
UiPath’s ratios appear slightly more favorable overall, with better liquidity, lower leverage, and less severe negative profitability indicators compared to PagerDuty. However, both companies face profitability challenges and do not pay dividends, reflecting growth-phase or reinvestment priorities. Investors should weigh the trade-offs between conservative financial structure and profitability deficits.
Strategic Positioning
This section compares the strategic positioning of UiPath Inc. and PagerDuty, Inc. including market position, key segments, and exposure to technological disruption:
UiPath Inc.
- Large market cap of 8.5B in software infrastructure facing competitive pressure in automation software sector
- Key revenue from subscription services, licenses, and professional services targeting banking, healthcare, finance
- Combines AI, robotic process automation, and low-code tools to innovate and improve automation processes
PagerDuty, Inc.
- Smaller market cap of 1.1B in software application with competition in digital operations management
- Focus on digital operations platform serving diverse industries like telecom, retail, media, financial
- Uses machine learning to correlate and predict issues from digital signals across software-enabled systems
UiPath Inc. vs PagerDuty, Inc. Positioning
UiPath pursues a diversified automation platform approach with multiple revenue streams, while PagerDuty focuses on a specialized digital operations platform serving broad industries. UiPath’s diversified model supports scale, whereas PagerDuty’s is more concentrated.
Which has the best competitive advantage?
Both companies have a slightly unfavorable moat evaluation as they currently destroy value, but show improving profitability trends. Their economic moats are weak, with UiPath and PagerDuty both working to enhance returns on invested capital.
Stock Comparison
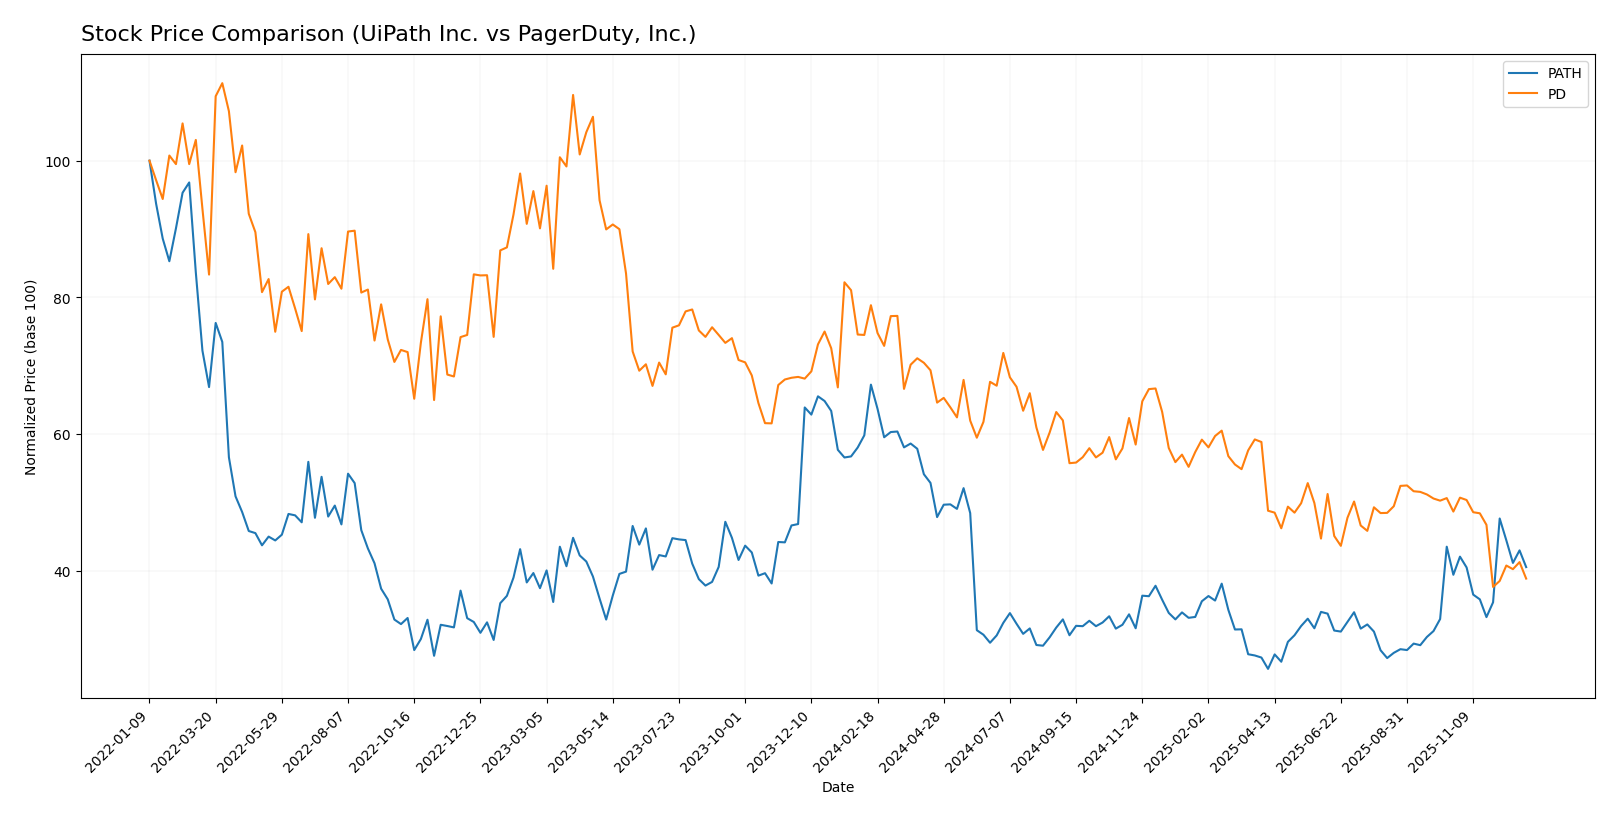
The stock price movements of UiPath Inc. and PagerDuty, Inc. over the past year reveal significant bearish trends with differing acceleration patterns and recent trading dynamics.
Trend Analysis
UiPath Inc. experienced a 39.73% price decline over the past 12 months, reflecting a bearish trend with accelerating downward momentum and a price range between 10.04 and 26.35. Recent months show a slight bullish reversal with a 2.85% increase.
PagerDuty, Inc. showed a more pronounced bearish trend, falling 50.76% over the same period with decelerating losses. The stock traded between 12.0 and 25.16, but its recent trend remains negative with a 20.17% decline from October 2025 to January 2026.
Comparing both stocks, UiPath delivered a higher market performance over the year, with a smaller overall loss and recent positive price movement, contrasting PagerDuty’s stronger decline and continued negative momentum.
Target Prices
The consensus target prices from verified analysts indicate moderate upside potential for both UiPath Inc. and PagerDuty, Inc.
| Company | Target High | Target Low | Consensus |
|---|---|---|---|
| UiPath Inc. | 19 | 14 | 16.6 |
| PagerDuty, Inc. | 19 | 15 | 16.75 |
Analysts expect UiPath’s stock to rise slightly above its current price of $15.88, while PagerDuty offers a more significant upside from its current $12.39, reflecting cautious optimism in both stocks.
Analyst Opinions Comparison
This section compares analysts’ ratings and grades for UiPath Inc. and PagerDuty, Inc.:
Rating Comparison
UiPath Inc. Rating
- Rating: B+ indicating a very favorable outlook.
- Discounted Cash Flow Score: Moderate at 3.
- ROE Score: Favorable at 4, showing efficient profit generation.
- ROA Score: Favorable at 4, reflecting effective asset use.
- Debt To Equity Score: Favorable at 4, suggesting moderate financial risk.
- Overall Score: Moderate at 3.
PagerDuty, Inc. Rating
- Rating: A- indicating a very favorable outlook.
- Discounted Cash Flow Score: Favorable at 4.
- ROE Score: Very favorable at 5, indicating excellent profit efficiency.
- ROA Score: Very favorable at 5, demonstrating excellent asset utilization.
- Debt To Equity Score: Very unfavorable at 1, indicating higher financial risk.
- Overall Score: Favorable at 4.
Which one is the best rated?
PagerDuty holds a stronger overall rating with an A- and higher scores in DCF, ROE, and ROA, though it has a notably weaker debt to equity score compared to UiPath. Overall, PagerDuty is better rated based on this data.
Scores Comparison
Here is a comparison of the Altman Z-Score and Piotroski Score for UiPath Inc. and PagerDuty, Inc.:
UiPath Inc. Scores
- Altman Z-Score: 6.53, indicating a safe financial zone with low bankruptcy risk.
- Piotroski Score: 7, reflecting strong financial health and investment potential.
PagerDuty, Inc. Scores
- Altman Z-Score: 1.37, placing the company in the distress zone with high bankruptcy risk.
- Piotroski Score: 7, also reflecting strong financial health and investment potential.
Which company has the best scores?
UiPath Inc. has a significantly higher Altman Z-Score than PagerDuty, placing it in a safer financial zone. Both companies share the same Piotroski Score, indicating equal financial strength by that metric.
Grades Comparison
Here is a summary of the recent grades assigned to UiPath Inc. and PagerDuty, Inc.:
UiPath Inc. Grades
The following table lists recent grades from recognized grading firms for UiPath Inc.:
| Grading Company | Action | New Grade | Date |
|---|---|---|---|
| RBC Capital | maintain | Sector Perform | 2025-12-10 |
| Morgan Stanley | maintain | Equal Weight | 2025-12-09 |
| DA Davidson | maintain | Neutral | 2025-12-05 |
| BMO Capital | maintain | Market Perform | 2025-12-04 |
| RBC Capital | maintain | Sector Perform | 2025-12-04 |
| Mizuho | maintain | Neutral | 2025-12-04 |
| Canaccord Genuity | maintain | Buy | 2025-12-04 |
| Wells Fargo | maintain | Equal Weight | 2025-12-04 |
| Evercore ISI Group | maintain | In Line | 2025-12-04 |
| Barclays | maintain | Equal Weight | 2025-12-04 |
Overall, UiPath’s grades predominantly reflect a neutral to moderate stance, with a single Buy rating standing out among mostly Hold and Perform assessments.
PagerDuty, Inc. Grades
The table below presents recent grades from reputable grading firms for PagerDuty, Inc.:
| Grading Company | Action | New Grade | Date |
|---|---|---|---|
| RBC Capital | maintain | Outperform | 2025-11-26 |
| Craig-Hallum | downgrade | Hold | 2025-11-26 |
| Morgan Stanley | maintain | Equal Weight | 2025-11-26 |
| TD Cowen | maintain | Buy | 2025-11-26 |
| Truist Securities | maintain | Buy | 2025-11-19 |
| Baird | maintain | Neutral | 2025-09-04 |
| Canaccord Genuity | maintain | Buy | 2025-09-04 |
| RBC Capital | maintain | Outperform | 2025-09-04 |
| Canaccord Genuity | maintain | Buy | 2025-06-02 |
| Truist Securities | maintain | Buy | 2025-05-30 |
PagerDuty’s grades indicate a generally positive outlook, with multiple Buy and Outperform ratings alongside a few Hold and Neutral opinions.
Which company has the best grades?
PagerDuty, Inc. has received generally stronger grades than UiPath Inc., showing more Buy and Outperform ratings. This signals a more favorable consensus by analysts, which may influence investor sentiment and portfolio positioning.
Strengths and Weaknesses
Below is a comparative overview of key strengths and weaknesses for UiPath Inc. (PATH) and PagerDuty, Inc. (PD) based on the most recent financial and operational data.
| Criterion | UiPath Inc. (PATH) | PagerDuty, Inc. (PD) |
|---|---|---|
| Diversification | Revenue mix with strong Subscription Services (801M in 2025) and growing License sales | Limited diversification; core focus on incident management solutions |
| Profitability | Negative net margin (-5.15%) and ROIC (-7.41%), but improving ROIC trend (+65%) | Negative net margin (-9.14%), ROIC (-9.66%), slight ROIC growth (+3.3%) |
| Innovation | High fixed asset turnover (14.41) suggests efficient use of assets in innovation | Higher fixed asset turnover (16.61) but struggling with negative profitability |
| Global presence | Established international footprint supporting subscription growth | Global presence but higher debt and weaker financial ratios |
| Market Share | Strong in robotic process automation with rising subscription revenue | Niche market player in IT incident response, with limited scale |
Key takeaways: Both companies are currently value destroyers with negative ROIC relative to WACC, though PATH shows a stronger and faster improvement in profitability metrics. PATH’s diversified revenue streams and subscription growth offer a more promising outlook, while PD faces more financial challenges and less diversification. Caution is advised, with preference toward companies demonstrating sustainable value creation.
Risk Analysis
Below is a comparative table of key risks for UiPath Inc. (PATH) and PagerDuty, Inc. (PD) based on their most recent 2025 data:
| Metric | UiPath Inc. (PATH) | PagerDuty, Inc. (PD) |
|---|---|---|
| Market Risk | Beta 1.1 (moderate) | Beta 0.687 (lower) |
| Debt level | Low debt-to-equity 0.04 | High debt-to-equity 3.57 |
| Regulatory Risk | Moderate (tech sector) | Moderate (tech sector) |
| Operational Risk | Negative net margin (-5.15%) | Negative net margin (-9.14%) |
| Environmental Risk | Low (software industry) | Low (software industry) |
| Geopolitical Risk | US, Japan exposure | US, international exposure |
The most impactful risks are PagerDuty’s high leverage and negative interest coverage, signaling financial distress risk, alongside its Altman Z-Score in the distress zone. UiPath shows better financial stability with low debt and a safe Z-Score but faces operational challenges with negative profitability. Both companies operate in regulated tech sectors with moderate regulatory and geopolitical risks.
Which Stock to Choose?
UiPath Inc. (PATH) shows a favorable income evolution with 9.3% revenue growth in 2025 and a solid gross margin of 82.73%, despite negative net margin and return on equity. Financial ratios are slightly unfavorable overall, but liquidity and debt metrics are strong. Its rating stands at B+ with moderate to favorable financial scores, and the company is shedding value but improving profitability.
PagerDuty, Inc. (PD) also delivers favorable income growth, with 8.54% revenue rise and strong gross margin near 83%. However, profitability remains weak, reflected in a negative net margin and return on equity. Financial ratios are mostly unfavorable, especially concerning leverage and debt. PD holds an A- rating with favorable profitability scores but faces value destruction and lower financial stability compared to PATH.
Investors focused on improving profitability and moderate financial health might find PATH’s profile more appealing, while those valuing a higher rating and stronger profitability scores despite leverage concerns could view PD as more fitting. The choice could depend on whether an investor prioritizes balance sheet strength and liquidity or higher growth potential and profitability improvements.
Disclaimer: Investment carries a risk of loss of initial capital. The past performance is not a reliable indicator of future results. Be sure to understand risks before making an investment decision.
Go Further
I encourage you to read the complete analyses of UiPath Inc. and PagerDuty, Inc. to enhance your investment decisions: