In the rapidly evolving tech landscape, UiPath Inc. (PATH) and monday.com Ltd. (MNDY) stand out as leaders in automation and software solutions. UiPath focuses on robotic process automation (RPA), while monday.com offers a versatile work operating system for project and workflow management. Both companies innovate to enhance business efficiency, making them natural competitors. This article will explore their strengths to identify the most promising investment opportunity for you.
Table of contents
Companies Overview
I will begin the comparison between UiPath Inc. and monday.com Ltd. by providing an overview of these two companies and their main differences.
UiPath Overview
UiPath Inc. focuses on delivering an end-to-end automation platform specializing in robotic process automation (RPA). The company integrates AI with process mining and low-code environments, enabling users to automate tasks across various industries such as banking, healthcare, and government. Headquartered in New York, UiPath has established itself in the software infrastructure market, serving clients primarily in the US, Romania, and Japan.
monday.com Overview
monday.com Ltd. develops a cloud-based Work OS that allows users to build customized work management and software applications using modular blocks. Its solutions target marketing, CRM, project management, and software development sectors. Based in Tel Aviv, monday.com operates internationally, serving organizations, educational institutions, and government entities with a focus on software applications rather than infrastructure.
Key similarities and differences
Both companies operate within the technology sector, focusing on software solutions that enhance organizational efficiency. UiPath emphasizes automation infrastructure with AI-driven robotic process automation, while monday.com provides a versatile cloud-based platform for work management applications. Additionally, UiPath’s primary markets include the US and Asia, whereas monday.com has a broader international presence including Europe and the Middle East.
Income Statement Comparison
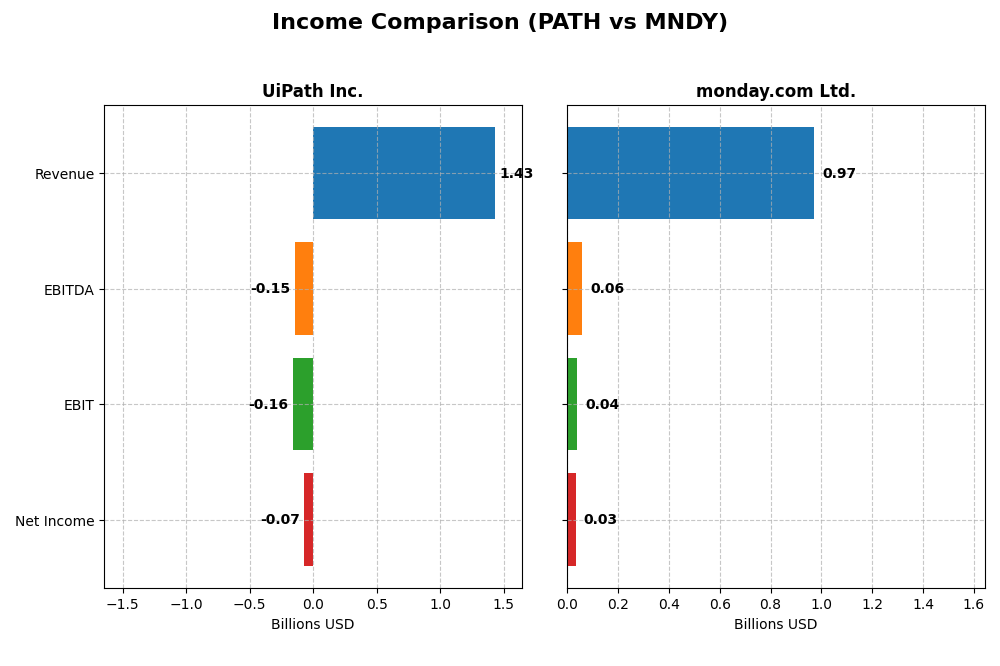
The following table presents a side-by-side comparison of key income statement metrics for UiPath Inc. and monday.com Ltd. for their most recent fiscal years.
| Metric | UiPath Inc. (PATH) | monday.com Ltd. (MNDY) |
|---|---|---|
| Market Cap | 8.49B | 7.34B |
| Revenue | 1.43B | 972M |
| EBITDA | -145M | 58M |
| EBIT | -163M | 40M |
| Net Income | -74M | 32M |
| EPS | -0.13 | 0.65 |
| Fiscal Year | 2025 | 2024 |
Income Statement Interpretations
UiPath Inc.
UiPath’s revenue rose steadily from $608M in 2021 to $1.43B in 2025, reflecting a 135% growth over five years. Despite consistent gross margins around 83%, net income remained negative but improved from -$92M in 2021 to -$74M in 2025. The latest year showed a 9.3% revenue increase and a 25% net margin improvement, signaling progress amid ongoing losses.
monday.com Ltd.
monday.com reported strong revenue growth from $161M in 2020 to $972M in 2024, a remarkable 503% increase. Gross margins remained robust at 89%, with net income turning positive to $32M in 2024 after prior losses. The latest fiscal year saw a 33% revenue gain and significant net margin and EPS improvements, underscoring a positive earnings turnaround.
Which one has the stronger fundamentals?
monday.com demonstrates stronger fundamentals with higher revenue growth, positive net income, and expanding margins, supported by a favorable income statement evaluation. UiPath shows consistent top-line growth and margin stability but continues to operate at a net loss. Both companies hold favorable outlooks, yet monday.com’s profitability gains provide a comparative edge.
Financial Ratios Comparison
The table below presents a side-by-side comparison of key financial ratios for UiPath Inc. (PATH) and monday.com Ltd. (MNDY) based on their most recent fiscal year data.
| Ratios | UiPath Inc. (PATH) 2025 | monday.com Ltd. (MNDY) 2024 |
|---|---|---|
| ROE | -3.99% | 3.14% |
| ROIC | -7.41% | -1.73% |
| P/E | -108.04 | 362.98 |
| P/B | 4.31 | 11.41 |
| Current Ratio | 2.93 | 2.66 |
| Quick Ratio | 2.93 | 2.66 |
| D/E (Debt-to-Equity) | 0.04 | 0.10 |
| Debt-to-Assets | 2.72% | 6.29% |
| Interest Coverage | 0 | 0 |
| Asset Turnover | 0.50 | 0.58 |
| Fixed Asset Turnover | 14.41 | 7.13 |
| Payout Ratio | 0 | 0 |
| Dividend Yield | 0% | 0% |
Interpretation of the Ratios
UiPath Inc.
UiPath exhibits a mixed ratio profile with 43% favorable and 50% unfavorable metrics, resulting in a slightly unfavorable overall assessment. Key concerns include negative net margin (-5.15%) and return on equity (-3.99%), alongside weak interest coverage at zero. The company does not pay dividends, reflecting its reinvestment and growth strategy.
monday.com Ltd.
monday.com shows a balanced ratio situation with 43% favorable, 43% unfavorable, and 14% neutral ratios, leading to a neutral global opinion. While net margin (3.33%) and ROE (3.14%) are positive but flagged unfavorable, interest coverage is strong (infinite). The firm also does not distribute dividends, focusing on growth and R&D priorities.
Which one has the best ratios?
Between the two, monday.com presents a more neutral stance with fewer unfavorable flags and stronger interest coverage, whereas UiPath has more pronounced weaknesses in profitability and coverage ratios. Both firms do not pay dividends, emphasizing reinvestment, but monday.com’s ratios suggest a steadier financial footing compared to UiPath’s slightly unfavorable profile.
Strategic Positioning
This section compares the strategic positioning of UiPath Inc. and monday.com Ltd. regarding market position, key segments, and exposure to technological disruption:
UiPath Inc.
- Leading in software infrastructure with strong competition in automation platforms.
- Key segments include license sales, subscription services, and professional services.
- Combines AI and RPA technologies, offering centralized automation and governance tools.
monday.com Ltd.
- Competing in software applications with focus on work management tools.
- Focused on cloud-based Work OS and modular software applications.
- Cloud-native platform with modularity but no explicit AI or automation emphasis.
UiPath Inc. vs monday.com Ltd. Positioning
UiPath exhibits a diversified business model with licenses, subscriptions, and services, serving multiple industries. monday.com concentrates on a cloud-based work OS platform emphasizing modularity. UiPath’s automation focus contrasts with monday.com’s application-driven approach.
Which has the best competitive advantage?
Both companies have slightly unfavorable MOAT evaluations, shedding value but showing growing ROIC trends. Neither currently demonstrates a strong economic moat based on ROIC exceeding WACC in the analyzed periods.
Stock Comparison
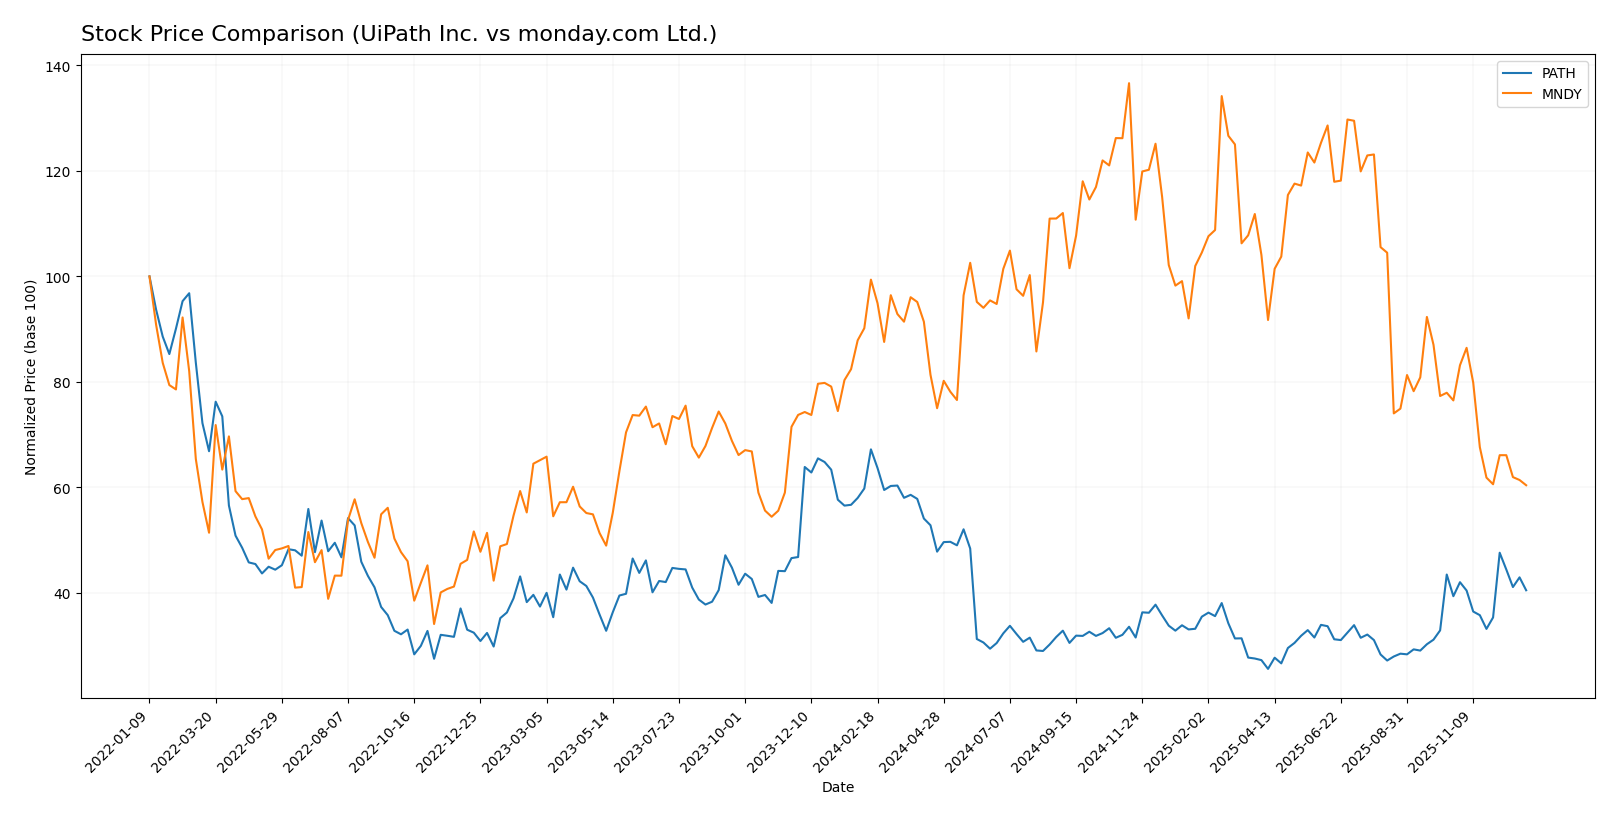
The stock price movements of UiPath Inc. and monday.com Ltd. over the past 12 months reveal significant bearish trends with contrasting acceleration patterns and notable recent trading dynamics.
Trend Analysis
UiPath Inc. experienced a 39.73% price decline over the past year, indicating a bearish trend with accelerating downward momentum. The stock fluctuated between a high of 26.35 and a low of 10.04, showing moderate volatility with a 3.69 std deviation.
monday.com Ltd. posted a 39.21% price drop over the same period, also bearish but with decelerating downward momentum. It showed higher volatility, with std deviation at 45.17, and traded between 324.31 and 143.42. Recent trend worsened with a 21.02% decline.
Comparing both, UiPath Inc. and monday.com Ltd. have delivered similar overall bearish performances, but monday.com Ltd.’s higher volatility and larger recent losses mark it as the weaker performer in market terms.
Target Prices
The consensus analyst target prices indicate moderate upside potential for both UiPath Inc. and monday.com Ltd.
| Company | Target High | Target Low | Consensus |
|---|---|---|---|
| UiPath Inc. | 19 | 14 | 16.6 |
| monday.com Ltd. | 330 | 202 | 277.18 |
Analysts expect UiPath’s price to hover slightly above its current level of $15.88, while monday.com’s consensus target of $277.18 suggests significant upside from its present $143.42 price.
Analyst Opinions Comparison
This section compares analysts’ ratings and key financial scores for UiPath Inc. and monday.com Ltd.:
Rating Comparison
UiPath Inc. Rating
- Rating: B+, considered very favorable by analysts.
- Discounted Cash Flow Score: Moderate with a score of 3.
- ROE Score: Favorable at 4, indicating efficient profit generation from equity.
- ROA Score: Favorable at 4, reflecting effective asset utilization.
- Debt To Equity Score: Favorable at 4, showing strong balance sheet.
- Overall Score: Moderate at 3, summarizing the financial standing.
monday.com Ltd. Rating
- Rating: B-, also considered very favorable by analysts.
- Discounted Cash Flow Score: Favorable with a score of 4.
- ROE Score: Moderate at 2, showing less efficiency in profit generation.
- ROA Score: Moderate at 3, indicating average asset utilization.
- Debt To Equity Score: Moderate at 3, indicating moderate financial risk.
- Overall Score: Moderate at 2, slightly lower financial standing.
Which one is the best rated?
UiPath Inc. holds a higher overall rating (B+) and stronger scores in ROE, ROA, and debt to equity compared to monday.com Ltd., which has a lower overall score and moderate ratings in key metrics.
Scores Comparison
Here is a comparison of the Altman Z-Score and Piotroski Score for UiPath Inc. and monday.com Ltd.:
UiPath Inc. Scores
- Altman Z-Score: 6.53, indicating a safe zone for bankruptcy risk.
- Piotroski Score: 7, classified as strong financial health.
monday.com Ltd. Scores
- Altman Z-Score: 7.39, also in the safe zone, signaling low bankruptcy risk.
- Piotroski Score: 5, reflecting average financial strength.
Which company has the best scores?
monday.com Ltd. has a slightly higher Altman Z-Score, indicating marginally lower bankruptcy risk, but UiPath Inc. has a stronger Piotroski Score, suggesting better overall financial health. Each company shows strengths in different scores.
Grades Comparison
The following presents a comparison of the latest reliable grades for UiPath Inc. and monday.com Ltd.:
UiPath Inc. Grades
This table summarizes the recent grades issued by reputable analysts for UiPath Inc.:
| Grading Company | Action | New Grade | Date |
|---|---|---|---|
| RBC Capital | Maintain | Sector Perform | 2025-12-10 |
| Morgan Stanley | Maintain | Equal Weight | 2025-12-09 |
| DA Davidson | Maintain | Neutral | 2025-12-05 |
| BMO Capital | Maintain | Market Perform | 2025-12-04 |
| RBC Capital | Maintain | Sector Perform | 2025-12-04 |
| Mizuho | Maintain | Neutral | 2025-12-04 |
| Canaccord Genuity | Maintain | Buy | 2025-12-04 |
| Wells Fargo | Maintain | Equal Weight | 2025-12-04 |
| Evercore ISI Group | Maintain | In Line | 2025-12-04 |
| Barclays | Maintain | Equal Weight | 2025-12-04 |
Overall, UiPath’s grades primarily indicate a cautious stance with a consensus leaning towards sector or market performance, with only one buy rating noted.
monday.com Ltd. Grades
This table details the most recent analyst grades for monday.com Ltd.:
| Grading Company | Action | New Grade | Date |
|---|---|---|---|
| Citigroup | Maintain | Buy | 2025-12-23 |
| Tigress Financial | Maintain | Buy | 2025-12-11 |
| Morgan Stanley | Maintain | Overweight | 2025-11-11 |
| Piper Sandler | Maintain | Overweight | 2025-11-11 |
| B of A Securities | Maintain | Neutral | 2025-11-11 |
| JP Morgan | Maintain | Overweight | 2025-11-11 |
| Canaccord Genuity | Maintain | Buy | 2025-11-11 |
| Jefferies | Maintain | Buy | 2025-11-11 |
| Wells Fargo | Maintain | Overweight | 2025-11-11 |
| Baird | Maintain | Outperform | 2025-11-11 |
Most analyst opinions for monday.com are positive, with numerous buy and overweight ratings, and one outperform grade, reflecting a generally favorable outlook.
Which company has the best grades?
monday.com Ltd. has received consistently stronger grades compared to UiPath Inc., with more buy and overweight recommendations. This could signal higher investor confidence in monday.com’s prospects, potentially impacting portfolio positioning and risk assessment.
Strengths and Weaknesses
Below is a comparative table summarizing the key strengths and weaknesses of UiPath Inc. (PATH) and monday.com Ltd. (MNDY) based on their latest available data.
| Criterion | UiPath Inc. (PATH) | monday.com Ltd. (MNDY) |
|---|---|---|
| Diversification | Strong subscription revenue (801.9M in 2025), diversified licensing and services | Mainly project management software, less diversified product line |
| Profitability | Negative net margin (-5.15%) and ROIC (-7.41%), shedding value but improving ROIC trend | Slightly positive net margin (3.33%), negative ROIC (-1.73%), also shedding value but improving |
| Innovation | Growing ROIC trend (+65%), strong fixed asset turnover (14.41) indicates efficient use of assets | Higher ROIC growth (+99%), favorable interest coverage, but high PE and PB ratios reflect overvaluation concerns |
| Global presence | Strong global footprint with significant subscription growth | Growing presence, but less diversified geographically |
| Market Share | Significant market share in robotic process automation (RPA) | Niche player in collaboration/project management, smaller market share |
Key takeaways: Both companies face profitability challenges and are currently destroying value, though their ROIC trends show improving prospects. UiPath benefits from a more diversified revenue base and asset efficiency, while monday.com shows robust growth potential but carries valuation risks. Investors should weigh innovation and market positioning against current profitability and valuation metrics.
Risk Analysis
Below is a comparison table of key risks for UiPath Inc. (PATH) and monday.com Ltd. (MNDY) based on the most recent data available for 2025 and 2024 respectively:
| Metric | UiPath Inc. (PATH) | monday.com Ltd. (MNDY) |
|---|---|---|
| Market Risk | Beta 1.1, moderate volatility | Beta 1.258, higher volatility |
| Debt level | Low debt, DE ratio 0.04 | Low debt, DE ratio 0.10 |
| Regulatory Risk | Moderate, US and international compliance | Moderate, global compliance with focus on Israel, US, EU |
| Operational Risk | Moderate, software development and deployment challenges | Moderate, cloud platform and product diversification risks |
| Environmental Risk | Low, software sector with limited direct impact | Low, similar sector and impact as PATH |
| Geopolitical Risk | Moderate, exposure to US, Romania, Japan | Higher, exposure to Israel, Europe, Middle East |
Synthesizing these risks, both companies show low financial leverage reducing bankruptcy risk, confirmed by strong Altman Z-Scores (PATH: 6.53, MNDY: 7.39). PATH’s market risk is lower due to a slightly lower beta, while MNDY faces somewhat higher geopolitical risk given its broader international footprint including Middle East regions. Operational risks remain moderate for both, reflecting challenges in software innovation and scaling. Investors should weigh MNDY’s higher market and geopolitical volatility against PATH’s slight financial and operational weaknesses noted in profitability ratios.
Which Stock to Choose?
UiPath Inc. (PATH) shows a favorable income statement with 9.3% revenue growth in 2025 and improving profitability despite negative net margin (-5.15%). Its financial ratios are slightly unfavorable overall, with strong liquidity and low debt but weak returns on equity and assets. The company holds a very favorable B+ rating and a safe Altman Z-score of 6.53, yet its ROIC remains below WACC, signaling value destruction despite improving profitability.
monday.com Ltd. (MNDY) reports strong income growth, with 33.2% revenue increase in 2024 and favorable margins, though net margin and ROIC remain negative. Financial ratios are neutral overall, balancing favorable liquidity and debt metrics with high valuation multiples and moderate returns. It holds a very favorable B- rating and a safe Altman Z-score of 7.39, but also shows ROIC below WACC, indicating value destruction alongside rising profitability.
For investors prioritizing growth potential and improving profitability, UiPath’s favorable income trends and higher rating might appear more attractive. Meanwhile, those valuing financial stability and neutral ratio profiles may find monday.com’s balanced metrics and strong liquidity preferable. Both companies exhibit value destruction signals but show signs of improving returns, suggesting a nuanced outlook depending on risk tolerance and investment strategy.
Disclaimer: Investment carries a risk of loss of initial capital. The past performance is not a reliable indicator of future results. Be sure to understand risks before making an investment decision.
Go Further
I encourage you to read the complete analyses of UiPath Inc. and monday.com Ltd. to enhance your investment decisions: