In the dynamic world of technology, UiPath Inc. and Asana, Inc. stand out as innovators shaping how businesses optimize productivity. UiPath leads in robotic process automation, delivering AI-driven solutions to streamline complex workflows, while Asana excels in work management software, helping teams coordinate tasks and projects seamlessly. This comparison explores their market positions and innovation strategies to reveal which company offers the most compelling opportunity for investors seeking growth in 2026. Let’s dive in to uncover the best pick for your portfolio.

Table of contents
Companies Overview
I will begin the comparison between UiPath and Asana by providing an overview of these two companies and their main differences.
UiPath Overview
UiPath Inc. operates in the software infrastructure sector, offering an end-to-end automation platform focused on robotic process automation (RPA). The company’s platform integrates AI with tools for discovering, building, managing, and measuring automation processes. It primarily serves banking, healthcare, financial services, and government clients across the US, Romania, and Japan. Founded in 2005, UiPath is headquartered in New York City and employs 3,868 people.
Asana Overview
Asana, Inc. is a technology company that develops a work management platform designed to help teams coordinate tasks and strategic initiatives. Its software supports product launches, marketing campaigns, and organizational goal-setting across various industries including technology, retail, education, and healthcare. Asana was incorporated in 2008, is based in San Francisco, and has a workforce of 1,819 employees. Its platform targets users globally with a focus on collaboration.
Key similarities and differences
Both UiPath and Asana operate in the technology sector but focus on different software categories: UiPath specializes in automation infrastructure, while Asana offers application-level work management solutions. Both companies serve a diverse range of industries and maintain a US headquarters, yet UiPath has a larger employee base and emphasizes robotic automation, whereas Asana prioritizes task and project coordination for teams. Their market capitalizations also differ significantly, reflecting their scale and business scope.
Income Statement Comparison
The table below compares the latest fiscal year income statement figures for UiPath Inc. and Asana, Inc., highlighting key financial metrics to assist in straightforward evaluation.
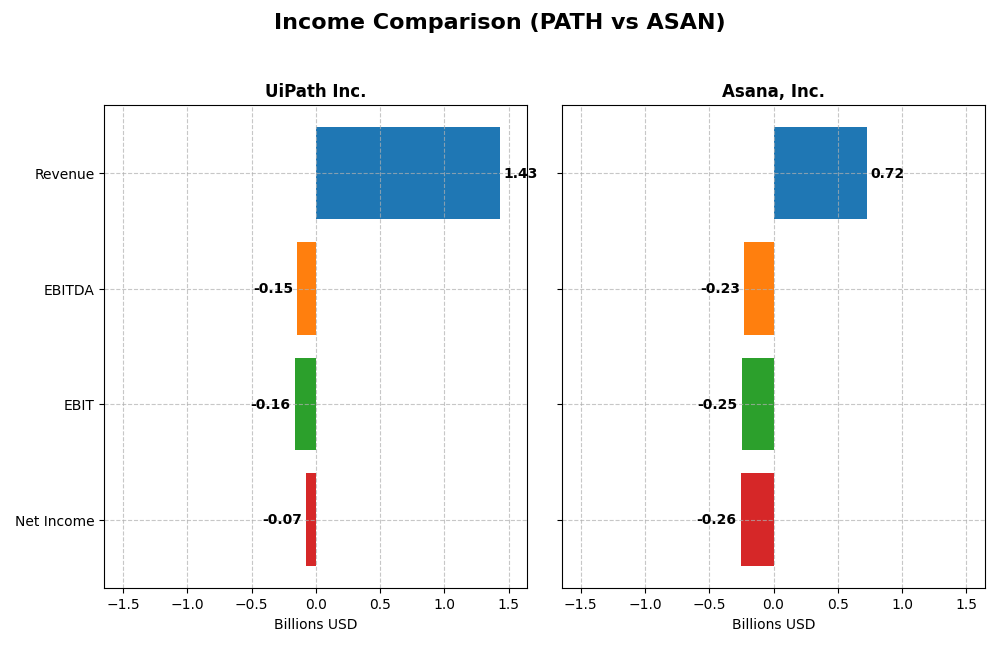
| Metric | UiPath Inc. (PATH) | Asana, Inc. (ASAN) |
|---|---|---|
| Market Cap | 8.5B | 3.1B |
| Revenue | 1.43B | 724M |
| EBITDA | -145M | -230M |
| EBIT | -163M | -247M |
| Net Income | -74M | -256M |
| EPS | -0.13 | -1.11 |
| Fiscal Year | 2025 | 2025 |
Income Statement Interpretations
UiPath Inc.
UiPath’s revenue grew steadily from 607M in 2021 to 1.43B in 2025, reflecting a favorable overall growth trend of 135%. Net income losses narrowed significantly, improving from -523M in 2022 to -74M in 2025. Gross margin remained strong and stable at 82.7% in 2025, while EBIT margin stayed negative but improved slightly. The latest year showed slower EBIT growth but solid margin and EPS improvements.
Asana, Inc.
Asana’s revenue increased robustly from 227M in 2021 to 724M in 2025, a 219% growth, supported by a high gross margin of 89.3%. Despite this, net income remained deeply negative at -256M in 2025, though net margin improved year-on-year. EBIT margin remained weak at -34.1%, showing minimal change. The company posted favorable revenue and gross profit growth, yet net income declined overall since 2021.
Which one has the stronger fundamentals?
UiPath demonstrates more consistent margin improvement and a smaller net loss relative to revenue, with a favorable overall net income trend. Asana, while showing higher revenue growth and gross margin, suffers from more significant net losses and weaker EBIT margins. UiPath’s stronger margin stability and net income progress suggest comparatively stronger fundamentals based on these income statement metrics.
Financial Ratios Comparison
The table below presents a side-by-side comparison of key financial ratios for UiPath Inc. and Asana, Inc. based on their latest fiscal year data for 2025.
| Ratios | UiPath Inc. (PATH) | Asana, Inc. (ASAN) |
|---|---|---|
| ROE | -3.99% | -112.31% |
| ROIC | -7.41% | -54.04% |
| P/E | -108.0 | -19.16 |
| P/B | 4.31 | 21.52 |
| Current Ratio | 2.93 | 1.44 |
| Quick Ratio | 2.93 | 1.44 |
| D/E | 0.04 | 1.18 |
| Debt-to-Assets | 2.72% | 30.11% |
| Interest Coverage | 0 | -72.42 |
| Asset Turnover | 0.50 | 0.81 |
| Fixed Asset Turnover | 14.41 | 2.76 |
| Payout Ratio | 0 | 0 |
| Dividend Yield | 0 | 0 |
Interpretation of the Ratios
UiPath Inc.
UiPath Inc. shows a mixed financial profile with favorable liquidity ratios (current and quick ratios around 2.93) and low leverage (debt-to-equity 0.04), indicating solid short-term financial health. However, profitability ratios such as net margin (-5.15%), ROE (-3.99%), and ROIC (-7.41%) are unfavorable, reflecting ongoing challenges in generating returns. The company does not pay dividends, likely prioritizing reinvestment in growth and technology development.
Asana, Inc.
Asana, Inc. exhibits weaker profitability metrics, with net margin at -35.3%, ROE at -112.31%, and ROIC at -54.04%, signaling substantial losses and poor returns on capital. Liquidity is moderate, with a current ratio of 1.44 and a quick ratio also at 1.44, while leverage is higher (debt-to-equity 1.18). Asana also does not distribute dividends, presumably focusing on reinvestment and expansion in its growth phase.
Which one has the best ratios?
Both UiPath and Asana display slightly unfavorable overall ratio profiles, with 50% unfavorable ratios each. UiPath benefits from stronger liquidity and lower leverage, while Asana faces more severe profitability issues and higher debt levels. Neither company pays dividends, reflecting their reinvestment strategies amid ongoing operational challenges.
Strategic Positioning
This section compares the strategic positioning of UiPath Inc. and Asana, Inc., including market position, key segments, and exposure to technological disruption:
UiPath Inc.
- Leading in software infrastructure with significant market cap of 8.5B, facing competitive pressure in automation.
- Focuses on robotic process automation with revenue streams from licenses, subscriptions, and professional services.
- Combines AI with automation tools, low-code environments, and centralized process management, adapting to tech changes.
Asana, Inc.
- Smaller market cap of 3.1B in software application, competing in work management platforms globally.
- Concentrates on work management platform for teams and executives across various industries.
- Provides cloud-based work orchestration with emphasis on task and project management software.
UiPath Inc. vs Asana, Inc. Positioning
UiPath pursues a diversified automation platform strategy with multiple revenue streams, whereas Asana focuses narrowly on work management software. UiPath’s broader product suite offers varied business drivers; Asana’s concentrated approach targets collaboration and task management.
Which has the best competitive advantage?
UiPath exhibits a slightly unfavorable moat, shedding value but showing improving profitability, while Asana’s very unfavorable moat reflects value destruction and declining profitability, indicating UiPath currently holds a relatively stronger competitive advantage.
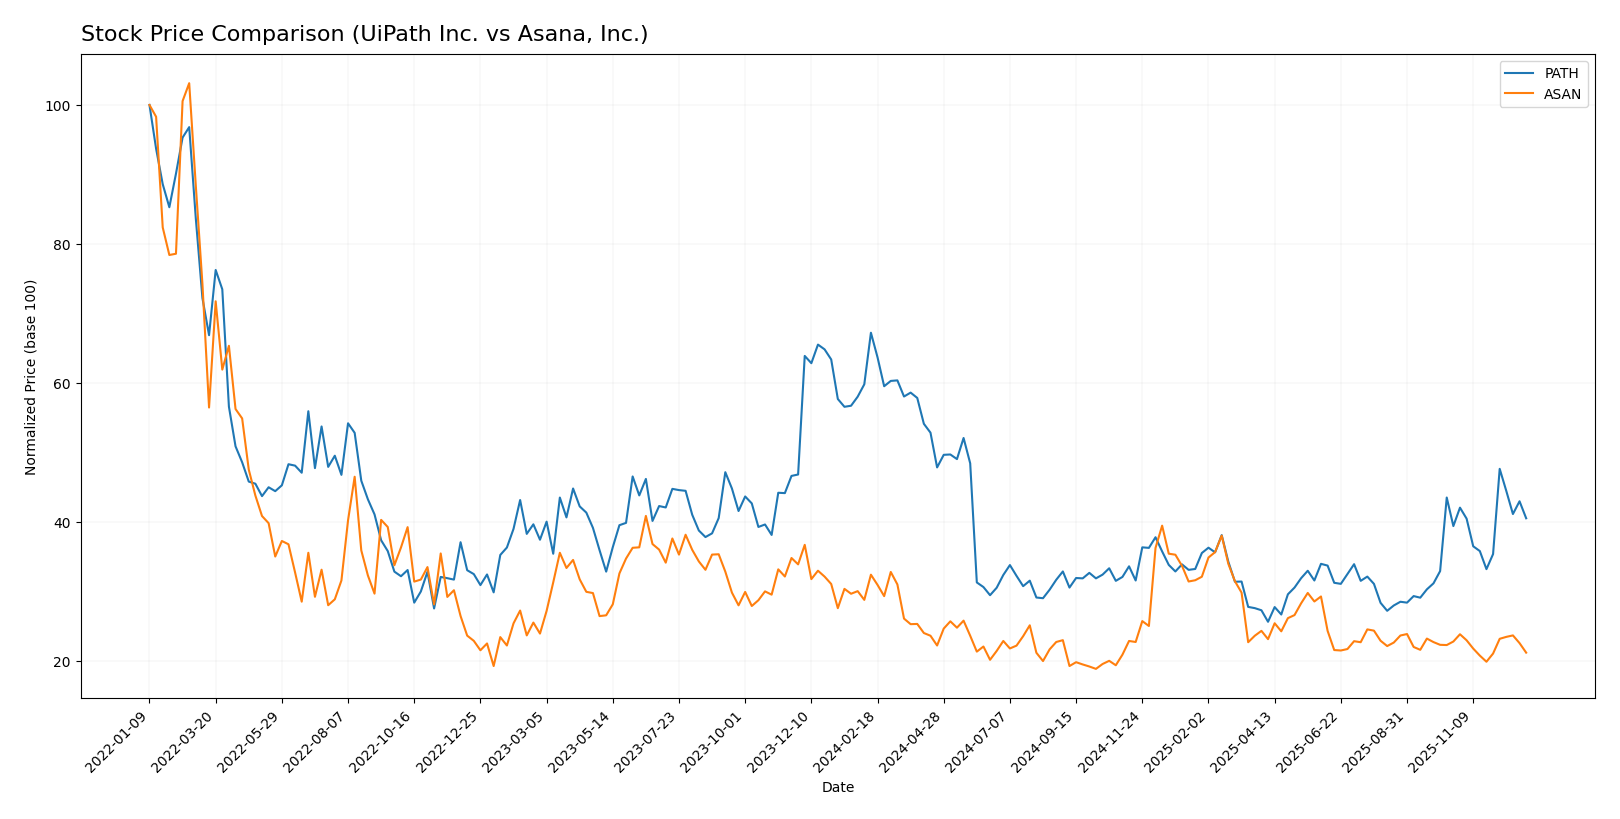
Stock Comparison
The past year has seen significant price declines for both UiPath Inc. and Asana, Inc., with UiPath’s bearish trend accelerating while Asana’s bearish trend shows deceleration. Recent trading dynamics highlight contrasting short-term movements.
Trend Analysis
UiPath Inc. experienced a 39.73% price decrease over the past 12 months, reflecting a bearish trend with accelerating decline and notable volatility (3.69 std deviation). The stock ranged between 26.35 and 10.04 during this period.
Asana, Inc. saw a 34.64% price drop over the same time frame, indicating a bearish trend with deceleration and lower volatility (2.89 std deviation). Its price fluctuated from 24.15 to 11.53.
Comparing the two, UiPath’s stock delivered a larger negative return, indicating weaker market performance relative to Asana, whose bearish decline decelerated somewhat despite also facing a significant drop.
Target Prices
The analyst consensus for target prices reflects moderate upside potential for both UiPath Inc. and Asana, Inc.
| Company | Target High | Target Low | Consensus |
|---|---|---|---|
| UiPath Inc. | 19 | 14 | 16.6 |
| Asana, Inc. | 18 | 14 | 15.75 |
Overall, analysts expect UiPath’s stock price to rise slightly above the current 15.88 USD, while Asana’s consensus target of 15.75 USD suggests a potential recovery from its current 12.96 USD price.
Analyst Opinions Comparison
This section compares analysts’ ratings and grades for UiPath Inc. and Asana, Inc.:
Rating Comparison
UiPath Inc. Rating
- Rating: B+ indicating a very favorable overall status
- Discounted Cash Flow Score: Moderate (3)
- ROE Score: Favorable (4)
- ROA Score: Favorable (4)
- Debt To Equity Score: Favorable (4)
- Overall Score: Moderate (3)
Asana, Inc. Rating
- Rating: D+ with a very unfavorable overall status
- Discounted Cash Flow Score: Very unfavorable (1)
- ROE Score: Very unfavorable (1)
- ROA Score: Very unfavorable (1)
- Debt To Equity Score: Very unfavorable (1)
- Overall Score: Very unfavorable (1)
Which one is the best rated?
UiPath Inc. holds a clearly superior rating with mostly favorable and moderate scores, while Asana, Inc. is rated very unfavorable across all key financial metrics. UiPath is better rated based on this data.
Scores Comparison
Here is a comparison of the Altman Z-Score and Piotroski Score for UiPath Inc. and Asana, Inc.:
UiPath Inc. Scores
- Altman Z-Score: 6.53, indicating a safe zone with low bankruptcy risk.
- Piotroski Score: 7, classified as strong financial health.
Asana, Inc. Scores
- Altman Z-Score: -0.20, indicating distress zone with high bankruptcy risk.
- Piotroski Score: 4, reflecting average financial health.
Which company has the best scores?
UiPath Inc. shows stronger financial stability with a high Altman Z-Score and a strong Piotroski Score, while Asana, Inc. displays distress in Altman Z-Score and only average Piotroski results.
Grades Comparison
Here is the grades comparison for UiPath Inc. and Asana, Inc. from reliable grading companies:
UiPath Inc. Grades
The following table shows recent grades issued by reputable financial institutions for UiPath Inc.:
| Grading Company | Action | New Grade | Date |
|---|---|---|---|
| RBC Capital | Maintain | Sector Perform | 2025-12-10 |
| Morgan Stanley | Maintain | Equal Weight | 2025-12-09 |
| DA Davidson | Maintain | Neutral | 2025-12-05 |
| BMO Capital | Maintain | Market Perform | 2025-12-04 |
| RBC Capital | Maintain | Sector Perform | 2025-12-04 |
| Mizuho | Maintain | Neutral | 2025-12-04 |
| Canaccord Genuity | Maintain | Buy | 2025-12-04 |
| Wells Fargo | Maintain | Equal Weight | 2025-12-04 |
| Evercore ISI Group | Maintain | In Line | 2025-12-04 |
| Barclays | Maintain | Equal Weight | 2025-12-04 |
The overall trend for UiPath shows predominantly hold or neutral ratings, with a single buy rating and no recent upgrades or downgrades.
Asana, Inc. Grades
The following table summarizes recent grades issued by recognized financial firms for Asana, Inc.:
| Grading Company | Action | New Grade | Date |
|---|---|---|---|
| Keybanc | Upgrade | Overweight | 2025-12-15 |
| DA Davidson | Maintain | Neutral | 2025-12-04 |
| RBC Capital | Maintain | Underperform | 2025-12-03 |
| UBS | Maintain | Neutral | 2025-12-03 |
| Citigroup | Maintain | Neutral | 2025-12-03 |
| Piper Sandler | Maintain | Overweight | 2025-09-04 |
| Baird | Maintain | Neutral | 2025-09-04 |
| Morgan Stanley | Maintain | Underweight | 2025-09-04 |
| B of A Securities | Maintain | Buy | 2025-06-04 |
| JP Morgan | Maintain | Underweight | 2025-06-04 |
Asana exhibits a more mixed rating profile, with a recent upgrade by Keybanc to overweight, but also several underperform and underweight ratings.
Which company has the best grades?
UiPath Inc. generally holds stable neutral to sector perform grades with minimal variation, indicating market caution. Asana, Inc. displays a wider spread from buy to underperform, reflecting more divergent analyst views. Investors might interpret UiPath’s consistent grades as a sign of steady outlook, whereas Asana’s mixed ratings suggest higher uncertainty or volatility in analyst sentiment.
Strengths and Weaknesses
Below is a comparative overview of UiPath Inc. (PATH) and Asana, Inc. (ASAN) based on diversification, profitability, innovation, global presence, and market share as of 2026.
| Criterion | UiPath Inc. (PATH) | Asana, Inc. (ASAN) |
|---|---|---|
| Diversification | High: Balanced revenue streams with Subscription Services at 801M, License at 587M, and Professional Services at 71M (2025) | Moderate: Primarily focused on collaboration software; less diversified product portfolio |
| Profitability | Improving but still negative margins: ROIC -7.4%, net margin -5.15%, showing growing profitability trends but currently value destroying | Weak profitability: ROIC -54%, net margin -35.3%, declining profitability indicating value destruction |
| Innovation | Strong focus on automation and AI innovation reflected in growing ROIC trend (+65%) | Innovation present but lagging with declining ROIC (-76%), indicating challenges in sustaining competitive edge |
| Global presence | Well-established global footprint supporting diverse client base | Global presence but with limited scale compared to PATH |
| Market Share | Significant player in robotic process automation with increasing adoption | Smaller market share in task and project management software with intense competition |
Key takeaway: UiPath shows better diversification and a positive trajectory in profitability despite current losses, making it a cautiously optimistic choice. Asana faces tougher challenges with declining profitability and less diversification, suggesting higher risk for investors.
Risk Analysis
Below is a comparative table outlining key risks for UiPath Inc. (PATH) and Asana, Inc. (ASAN) based on the most recent fiscal year 2025 data:
| Metric | UiPath Inc. (PATH) | Asana, Inc. (ASAN) |
|---|---|---|
| Market Risk | Beta 1.1, moderate volatility | Beta 0.93, somewhat less volatile |
| Debt Level | Low debt-to-equity 0.04, very favorable | High debt-to-equity 1.18, unfavorable |
| Regulatory Risk | Moderate, US & international compliance | Moderate, US & international compliance |
| Operational Risk | Negative margins (-5.15%), but strong asset turnover | Larger negative margins (-35.3%) and operational losses |
| Environmental Risk | Low direct exposure, typical for software | Low direct exposure, typical for software |
| Geopolitical Risk | Exposure due to global offices (US, Romania, Japan) | Mainly US-based, limited geopolitical exposure |
Synthesis: Both companies face significant operational risks with negative profitability, but Asana’s high debt level and distress-zone Altman Z-score highlight a higher financial risk. UiPath’s low leverage and strong bankruptcy score reduce its financial risk despite slightly unfavorable margins. Market volatility is moderate for both, with UiPath slightly more sensitive. Investors should weigh Asana’s elevated financial and operational risks carefully.
Which Stock to Choose?
UiPath Inc. (PATH) shows favorable income growth with revenue up 9.3% in 2025 and an overall period growth of 135%. Its profitability remains negative but improving, with a net margin of -5.15%. Financial ratios reveal a mixed picture: 43% favorable but 50% unfavorable, including decent liquidity and low debt. The company’s rating is strong at B+ with a moderate overall score, and its Altman Z-score of 6.53 signals financial stability. However, it is still shedding value as ROIC lags WACC, though profitability is increasing.
Asana, Inc. (ASAN) posted higher revenue growth of 10.9% in 2025 and a 219% increase over 2021–2025 but suffers from persistent losses with a net margin of -35.3%. Its financial ratios are mostly unfavorable or neutral, with heavy debt indicated by a debt-to-equity ratio over 1. The company holds a weak rating of D+ and an Altman Z-score below zero, suggesting financial distress. ASAN is shedding value with declining ROIC and worsening profitability over time.
Investors seeking growth potential might view UiPath’s improving profitability and stable financial health as favorable indicators, while those with higher risk tolerance could consider Asana’s rapid revenue expansion despite its financial challenges. Conversely, more risk-averse investors may see UiPath’s stronger rating and financial stability as a more reassuring profile compared to Asana’s distress signals.
Disclaimer: Investment carries a risk of loss of initial capital. The past performance is not a reliable indicator of future results. Be sure to understand risks before making an investment decision.
Go Further
I encourage you to read the complete analyses of UiPath Inc. and Asana, Inc. to enhance your investment decisions: