In the dynamic world of technology, Uber Technologies, Inc. and Workday, Inc. stand out as innovators in software applications with distinct yet overlapping market influences. Uber revolutionizes mobility and delivery services worldwide, while Workday excels in enterprise cloud solutions for financial and human capital management. This comparison dives deep into their strategies and growth potential to help you decide which company offers the most compelling investment opportunity today. Let’s explore which stock deserves a place in your portfolio.

Table of contents
Companies Overview
I will begin the comparison between Uber Technologies, Inc. and Workday, Inc. by providing an overview of these two companies and their main differences.
Uber Overview
Uber Technologies, Inc. develops and operates proprietary technology applications worldwide, connecting consumers with independent providers for ride services, food delivery, and freight logistics. The company operates through three segments: Mobility, Delivery, and Freight, offering a broad range of transportation and delivery solutions. Founded in 2009 and headquartered in San Francisco, Uber is a major player in the software applications industry with a market cap of approximately 176B USD.
Workday Overview
Workday, Inc. provides enterprise cloud applications designed to help organizations manage business operations, including financial management, human capital management, and analytics. Its software suite supports planning, execution, and reporting for various industries globally. Founded in 2005 and based in Pleasanton, California, Workday operates primarily in the software applications sector with a market cap near 50B USD.
Key similarities and differences
Both Uber and Workday are U.S.-based technology companies operating in the software application industry, but their business models differ significantly. Uber focuses on consumer and logistics services via a platform connecting independent providers with end users, while Workday delivers cloud-based enterprise software for financial and human resource management. Uber’s business is more consumer-facing and asset-light, whereas Workday caters to organizational needs with enterprise software solutions.
Income Statement Comparison
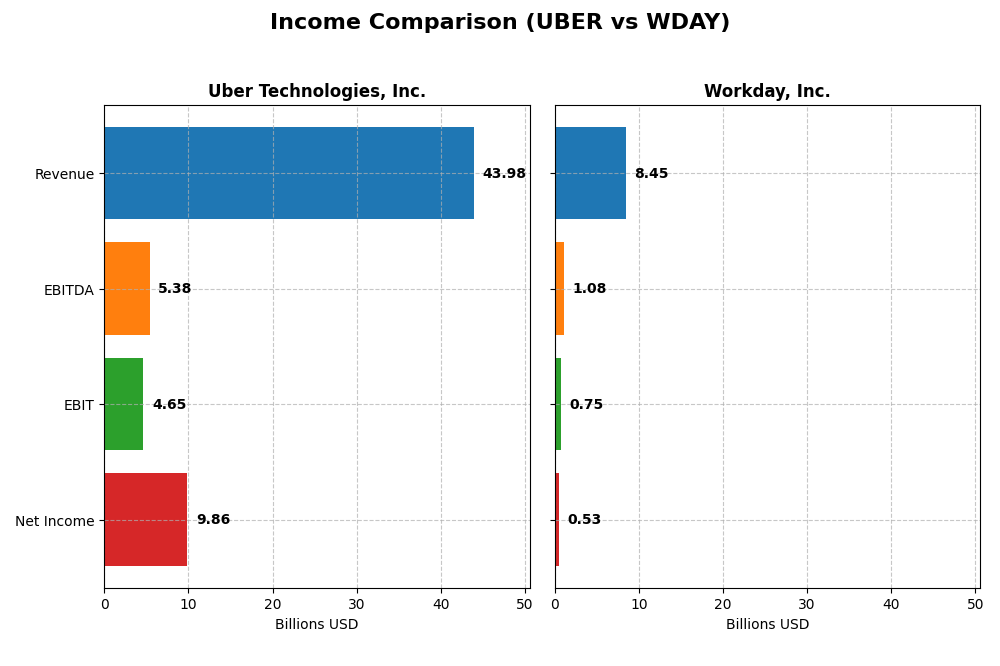
This table compares the key income statement metrics for Uber Technologies, Inc. and Workday, Inc., focusing on their most recent fiscal year results.
| Metric | Uber Technologies, Inc. | Workday, Inc. |
|---|---|---|
| Market Cap | 176.3B | 49.9B |
| Revenue | 43.98B | 8.45B |
| EBITDA | 5.39B | 1.08B |
| EBIT | 4.65B | 752M |
| Net Income | 9.86B | 526M |
| EPS | 4.71 | 1.98 |
| Fiscal Year | 2024 | 2025 |
Income Statement Interpretations
Uber Technologies, Inc.
Uber showed strong revenue growth from 2020 to 2024, surging from $11.1B to $44B, with net income turning sharply positive to $9.8B in 2024 after several years of losses. Margins improved notably, with gross margin at 39.4% and net margin at 22.4%, reflecting enhanced operational efficiency. The 2024 year marked a significant acceleration in profitability and margin expansion.
Workday, Inc.
Workday experienced steady revenue growth from $4.3B in 2021 to $8.4B in 2025, with net income rising overall but dipping to $526M in 2025 from $1.38B in 2024. Gross margin remained high at 75.5%, while EBIT margin was moderate at 8.9%. The latest fiscal year saw a slowdown in net margin and EPS growth, indicating some margin pressure despite continued revenue gains.
Which one has the stronger fundamentals?
Uber’s fundamentals benefit from rapid and broad-based growth in revenue and profitability, with all key margin metrics marked favorable and strong recent net income gains. Workday maintains higher gross margins but shows mixed signals with recent declines in net margin and EPS growth. Both display favorable long-term growth, yet Uber’s significant margin improvements and profit turnaround stand out.
Financial Ratios Comparison
The following table presents a side-by-side comparison of key financial ratios for Uber Technologies, Inc. and Workday, Inc. based on their most recent fiscal year data.
| Ratios | Uber Technologies, Inc. (2024) | Workday, Inc. (2025) |
|---|---|---|
| ROE | 45.7% | 5.8% |
| ROIC | 6.8% | 2.7% |
| P/E | 12.8 | 132.2 |
| P/B | 5.9 | 7.7 |
| Current Ratio | 1.07 | 1.85 |
| Quick Ratio | 1.07 | 1.85 |
| D/E (Debt-to-Equity) | 0.53 | 0.37 |
| Debt-to-Assets | 22.3% | 18.7% |
| Interest Coverage | 5.35 | 3.64 |
| Asset Turnover | 0.86 | 0.47 |
| Fixed Asset Turnover | 14.1 | 5.36 |
| Payout ratio | 0 | 0 |
| Dividend yield | 0 | 0 |
Interpretation of the Ratios
Uber Technologies, Inc.
Uber presents a generally strong financial profile with favorable net margin at 22.41% and an impressive return on equity of 45.72%, indicating efficient profit generation for shareholders. Some caution is warranted due to an unfavorable price-to-book ratio of 5.86. The company does not pay dividends, reflecting its reinvestment strategy and growth focus rather than income distribution to shareholders.
Workday, Inc.
Workday’s ratios show mixed strength: favorable liquidity ratios (current and quick at 1.85) and manageable debt levels with a debt-to-equity of 0.37. However, profitability metrics such as return on equity (5.82%) and return on invested capital (2.73%) are unfavorable, signaling limited earnings efficiency. Workday also does not pay dividends, likely prioritizing reinvestment and innovation over shareholder payouts.
Which one has the best ratios?
Uber holds a slightly favorable overall ratio profile with half of its ratios rated favorable, including strong profitability and coverage metrics. Workday maintains a neutral stance with fewer favorable ratios and notable weaknesses in profitability and valuation metrics. Based on these evaluations, Uber demonstrates a more robust financial ratio set than Workday.
Strategic Positioning
This section compares the strategic positioning of Uber and Workday, focusing on market position, key segments, and exposure to technological disruption:
Uber Technologies, Inc.
- Operates globally in ride-sharing, delivery, and freight sectors facing strong competition.
- Revenue driven by three segments: Mobility, Delivery, and Freight, diversified across multiple services.
- Operates proprietary technology platforms; faces ongoing disruption in mobility and delivery sectors.
Workday, Inc.
- Provides enterprise cloud applications with a focus on financial and human capital management.
- Revenue mainly from subscription services and professional services, concentrated in cloud applications.
- Uses advanced analytics and machine learning to innovate within enterprise software, exposed to cloud tech shifts.
Uber vs Workday Positioning
Uber pursues a diversified multi-segment strategy across mobility, delivery, and freight, potentially mitigating risks through varied revenue streams. Workday concentrates on enterprise cloud applications, benefiting from focused specialization but with narrower segment exposure.
Which has the best competitive advantage?
Both Uber and Workday show slightly unfavorable MOAT evaluations, shedding value despite growing ROIC trends, indicating improving profitability but ongoing challenges sustaining a strong competitive advantage.
Stock Comparison
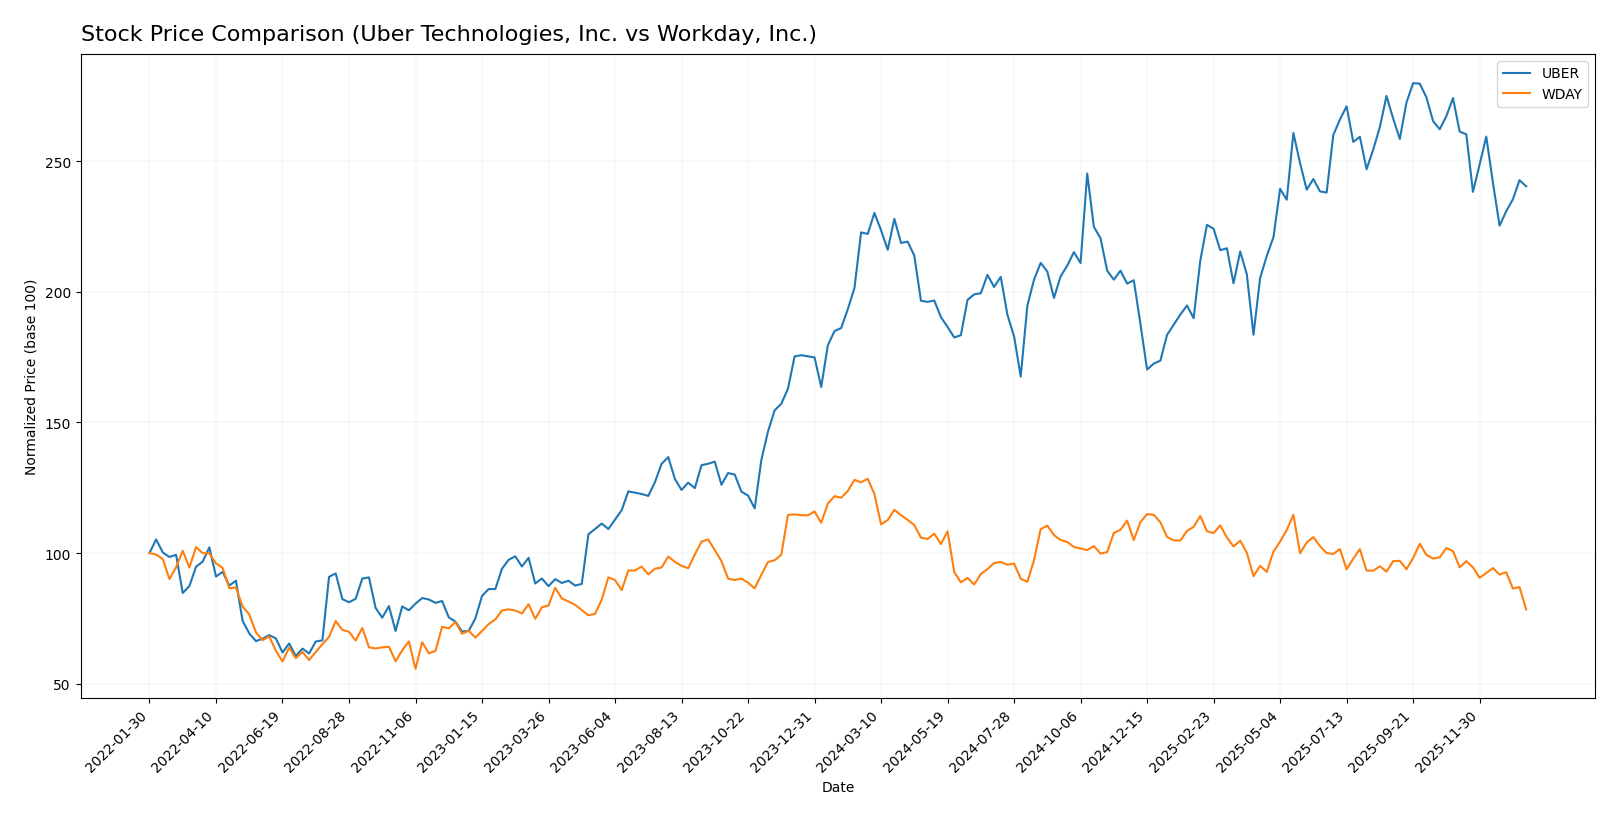
The past year revealed distinct stock price trajectories for Uber Technologies, Inc. and Workday, Inc., with Uber showing a moderate bullish trend despite recent deceleration, while Workday experienced a pronounced bearish trend marked by significant price declines.
Trend Analysis
Uber Technologies, Inc. exhibited a bullish trend over the past 12 months with an 8.21% price increase, though this growth has decelerated recently, accompanied by a high volatility level (std deviation 10.29) and a price range between 58.99 and 98.51.
Workday, Inc. faced a bearish trend over the same period, declining by 38.92% with decelerating losses and higher volatility (std deviation 20.22); its stock fluctuated between 186.83 and 305.88, with a sharper recent downward slope.
Comparing both, Uber delivered the highest market performance with an 8.21% gain, contrasting with Workday’s substantial 38.92% loss, reflecting stronger resilience in Uber’s stock price over the past year.
Target Prices
Here is the current analyst target consensus for Uber Technologies, Inc. and Workday, Inc.
| Company | Target High | Target Low | Consensus |
|---|---|---|---|
| Uber Technologies, Inc. | 140 | 73 | 111.26 |
| Workday, Inc. | 320 | 235 | 274.47 |
Analysts expect Uber’s stock to appreciate from its current price of $84.86 towards a consensus target of $111.26, indicating moderate upside potential. Workday’s consensus target of $274.47 suggests significant upside from its current price of $186.86, reflecting strong growth expectations.
Analyst Opinions Comparison
This section compares analysts’ ratings and financial scores for Uber Technologies, Inc. and Workday, Inc.:
Rating Comparison
Uber Rating
- Rating: B, considered Very Favorable by analysts.
- Discounted Cash Flow Score: 1, rated Very Unfavorable, indicating overvaluation concerns.
- ROE Score: 5, Very Favorable, showing high efficiency in generating profits from equity.
- ROA Score: 5, Very Favorable, demonstrating excellent asset utilization.
- Debt To Equity Score: 2, Moderate, implying a balanced financial risk profile.
- Overall Score: 3, Moderate, reflecting a balanced overall financial standing.
Workday Rating
- Rating: B-, also considered Very Favorable.
- Discounted Cash Flow Score: 4, rated Favorable, suggesting better valuation.
- ROE Score: 3, Moderate, indicating average profit generation from equity.
- ROA Score: 3, Moderate, with average effectiveness in asset use.
- Debt To Equity Score: 2, Moderate, similar financial risk assessment.
- Overall Score: 2, Moderate, indicating a slightly lower overall financial standing.
Which one is the best rated?
Based on the provided data, Uber holds a higher overall rating (B) and stronger scores in ROE and ROA than Workday, which has a B- rating and moderate scores. Uber’s valuation is less favorable, but its profitability metrics are superior.
Scores Comparison
Here is a comparison of the Altman Z-Score and Piotroski Score for Uber and Workday:
Uber Scores
- Altman Z-Score: 4.44, safe zone indicating low bankruptcy risk
- Piotroski Score: 6, average financial strength
Workday Scores
- Altman Z-Score: 4.41, safe zone indicating low bankruptcy risk
- Piotroski Score: 6, average financial strength
Which company has the best scores?
Both Uber and Workday have very similar Altman Z-Scores in the safe zone, signaling low bankruptcy risk. Their Piotroski Scores are equal at 6, reflecting average financial strength. Neither company distinctly outperforms the other based on these scores.
Grades Comparison
Here is a comparison of the recent grades assigned to Uber Technologies, Inc. and Workday, Inc.:
Uber Technologies, Inc. Grades
The following table summarizes the latest grades from recognized grading companies for Uber Technologies, Inc.:
| Grading Company | Action | New Grade | Date |
|---|---|---|---|
| BTIG | Maintain | Buy | 2026-01-15 |
| Wells Fargo | Maintain | Overweight | 2026-01-08 |
| Cantor Fitzgerald | Maintain | Overweight | 2026-01-08 |
| Wolfe Research | Maintain | Outperform | 2026-01-06 |
| Wedbush | Maintain | Neutral | 2025-12-19 |
| Morgan Stanley | Maintain | Overweight | 2025-12-08 |
| Arete Research | Upgrade | Buy | 2025-12-03 |
| Wells Fargo | Maintain | Overweight | 2025-11-05 |
| Guggenheim | Maintain | Buy | 2025-11-05 |
| DA Davidson | Maintain | Buy | 2025-11-05 |
Uber’s grades generally trend positively with multiple buy and overweight recommendations and a recent upgrade from neutral to buy by Arete Research.
Workday, Inc. Grades
The following table shows recent grades from recognized grading companies for Workday, Inc.:
| Grading Company | Action | New Grade | Date |
|---|---|---|---|
| Barclays | Maintain | Overweight | 2026-01-12 |
| RBC Capital | Maintain | Outperform | 2026-01-05 |
| TD Cowen | Maintain | Buy | 2025-11-26 |
| DA Davidson | Maintain | Neutral | 2025-11-26 |
| Wells Fargo | Maintain | Overweight | 2025-11-26 |
| Barclays | Maintain | Overweight | 2025-11-26 |
| Keybanc | Maintain | Overweight | 2025-11-26 |
| Citigroup | Maintain | Neutral | 2025-11-26 |
| JP Morgan | Maintain | Overweight | 2025-11-26 |
| UBS | Maintain | Neutral | 2025-11-26 |
Workday’s ratings show a strong prevalence of overweight and buy grades, with some neutral ratings, reflecting a generally favorable outlook.
Which company has the best grades?
Both Uber Technologies and Workday have received predominantly buy and overweight grades from credible analysts. Uber shows a slightly higher concentration of buy ratings and a recent upgrade, while Workday presents a larger number of overweight ratings but also more neutral opinions. This suggests a broadly positive sentiment for both stocks, with subtle differences in analyst conviction that investors should consider carefully.
Strengths and Weaknesses
Below is a comparison of Uber Technologies, Inc. and Workday, Inc. based on key business criteria.
| Criterion | Uber Technologies, Inc. | Workday, Inc. |
|---|---|---|
| Diversification | Highly diversified with strong revenue streams from Mobility ($25B), Delivery ($13.75B), and Freight ($5.14B) | Less diversified, reliant mainly on Subscription Services ($7.7B) with smaller Professional Services ($728M) |
| Profitability | Strong net margin (22.41%) and ROE (45.72%), neutral ROIC (6.79%) | Moderate net margin (6.23%), low ROE (5.82%) and ROIC (2.73%) |
| Innovation | Growing ROIC trend despite currently shedding value; invests heavily in tech and mobility solutions | Also growing ROIC trend but value shedding; innovation focused on cloud-based enterprise software |
| Global presence | Extensive global footprint in ride-hailing, food delivery, and freight logistics | Global SaaS provider but less operational footprint compared to Uber |
| Market Share | Leading market share in ride-hailing and delivery sectors | Strong position in enterprise cloud HR and finance software markets |
Key takeaways: Uber shows strong diversification and profitability with improving returns despite some value destruction. Workday is less diversified and less profitable but demonstrates growth potential with its cloud software innovation. Both companies require cautious evaluation considering current value shedding.
Risk Analysis
Below is a comparative table of key risks for Uber Technologies, Inc. and Workday, Inc. based on the most recent data from 2025-2026:
| Metric | Uber Technologies, Inc. (UBER) | Workday, Inc. (WDAY) |
|---|---|---|
| Market Risk | Beta 1.20, moderate volatility | Beta 1.14, moderate volatility |
| Debt level | Debt-to-Equity 0.53 (neutral) | Debt-to-Equity 0.37 (favorable) |
| Regulatory Risk | High (ridesharing regulations globally) | Moderate (data privacy and compliance) |
| Operational Risk | High (complex multi-segment operations) | Moderate (cloud service reliability) |
| Environmental Risk | Moderate (fleet emissions concerns) | Low (software-based services) |
| Geopolitical Risk | Moderate (international operations) | Low (primarily US-based) |
The most likely and impactful risks concern Uber’s regulatory challenges amid evolving global ridesharing laws, which could affect its mobility segment profitability. Workday faces pricing pressure reflected in unfavorable valuation ratios, posing market risk despite solid operational stability. Both companies maintain safe financial health zones, but investors should monitor regulatory and valuation risks closely.
Which Stock to Choose?
Uber Technologies, Inc. has shown strong income growth with a 295% revenue increase over five years and favorable profitability metrics, including a 22.41% net margin and 45.72% ROE. Its debt levels are moderate with a net debt to EBITDA of 0.93, and its overall rating is very favorable (B), supported by a safe Altman Z-Score and average Piotroski score.
Workday, Inc. presents solid income growth of 96% over the period with a high gross margin of 75.5% but a more modest net margin of 6.23%. Financial ratios indicate mixed results, with favorable liquidity and debt metrics but unfavorable valuation ratios and moderate profitability. It holds a very favorable rating (B-) with a safe Altman Z-Score and average Piotroski score.
Investors focused on growth might view Workday’s strong gross margin and revenue expansion as appealing despite valuation concerns, while those prioritizing profitability and financial stability could find Uber’s favorable income statement and stronger returns on equity more suitable. Both companies show improving profitability but are currently shedding value relative to cost of capital.
Disclaimer: Investment carries a risk of loss of initial capital. The past performance is not a reliable indicator of future results. Be sure to understand risks before making an investment decision.
Go Further
I encourage you to read the complete analyses of Uber Technologies, Inc. and Workday, Inc. to enhance your investment decisions: