Home > Comparison > Technology > UBER vs U
The strategic rivalry between Uber Technologies, Inc. and Unity Software Inc. shapes the future of the technology sector. Uber operates a capital-intensive, multi-segment platform connecting mobility, delivery, and freight services globally. Unity, by contrast, delivers high-margin software solutions powering real-time 3D content creation across multiple devices. This analysis pits Uber’s scale and diversification against Unity’s innovation and growth potential, aiming to identify which trajectory offers superior risk-adjusted returns for diversified portfolios.
Table of contents
Companies Overview
Uber Technologies and Unity Software stand as pivotal players in the evolving software application landscape.
Uber Technologies, Inc.: Global Mobility and Delivery Leader
Uber dominates the mobility and delivery service sector through its proprietary technology platform connecting riders, drivers, and delivery providers. Its core revenue stems from Mobility, Delivery, and Freight segments, leveraging dynamic pricing and network scale. In 2026, Uber sharpens its focus on expanding financial partnerships and enhancing vehicle solutions to solidify its competitive edge across diverse geographies.
Unity Software Inc.: Real-Time 3D Content Innovator
Unity Software leads in interactive real-time 3D content creation, offering tools for developers and creators worldwide. Its revenue engine revolves around software solutions that enable development, monetization, and operation of 2D and 3D content across multiple platforms. The company strategically prioritizes platform accessibility and global sales expansion to capture growth in AR, VR, and gaming markets in 2026.
Strategic Collision: Similarities & Divergences
Both companies excel in software-driven ecosystems but differ fundamentally: Uber operates a closed, service-based platform, while Unity fosters an open content creation environment. Their battleground lies in harnessing technology for user engagement—Uber in mobility and logistics, Unity in immersive experiences. These contrasting models define distinct investment profiles rooted in network effects versus developer community scale.
Income Statement Comparison
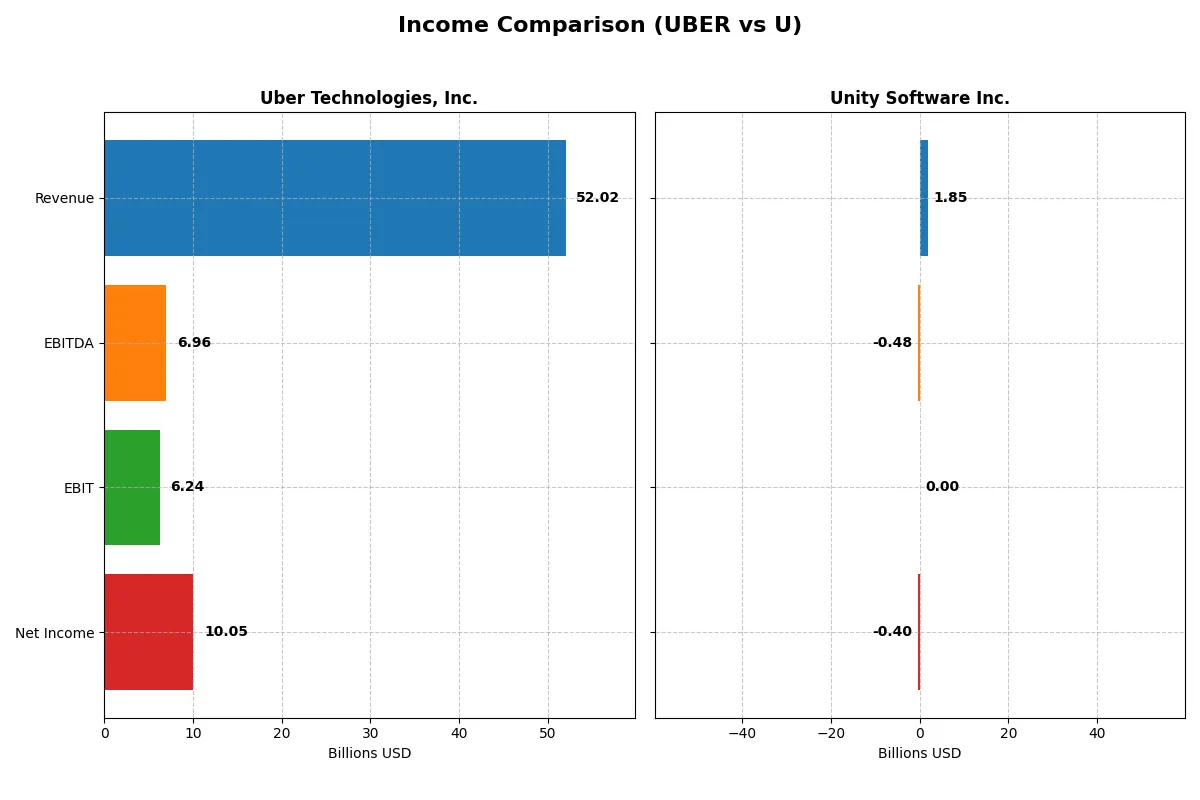
This data dissects the core profitability and scalability of both corporate engines to reveal who dominates the bottom line:
| Metric | Uber Technologies, Inc. (UBER) | Unity Software Inc. (U) |
|---|---|---|
| Revenue | 52B | 1.85B |
| Cost of Revenue | 31.3B | 478M |
| Operating Expenses | 15.1B | 1.85B |
| Gross Profit | 20.7B | 1.37B |
| EBITDA | 7B | -479M |
| EBIT | 6.24B | 0 |
| Interest Expense | 440M | 24M |
| Net Income | 10B | -403M |
| EPS | 4.82 | -0.96 |
| Fiscal Year | 2025 | 2025 |
Income Statement Analysis: The Bottom-Line Duel
This income statement comparison reveals which company operates with greater efficiency and profitability in their core business engines.
Uber Technologies, Inc. Analysis
Uber’s revenue surged from 17.5B in 2021 to 52B in 2025, with net income rebounding from a loss to 10B. Gross margin remains healthy near 40%, while net margin hit 19.3% in 2025. Efficiency improved sharply as operating expenses scaled well with revenue growth, driving EBIT growth of 34% year-over-year.
Unity Software Inc. Analysis
Unity’s revenue climbed steadily from 1.1B in 2021 to 1.85B in 2025, but net losses persisted, with a 2025 net margin of -21.8%. Despite a strong gross margin above 74%, heavy operating expenses keep EBIT negative, though its 100% EBIT growth last year signals momentum toward profitability.
Margin Strength vs. Scale and Profitability
Uber stands out with robust scale and a strong net income turnaround, reflecting disciplined cost control and margin expansion. Unity impresses with superior gross margins and improving EBIT growth but remains unprofitable overall. For investors prioritizing proven profitability and scale, Uber’s profile offers clearer fundamental strength.
Financial Ratios Comparison
These vital ratios act as a diagnostic tool to expose the underlying fiscal health, valuation premiums, and capital efficiency of the companies analyzed:
| Ratios | Uber Technologies, Inc. (UBER) | Unity Software Inc. (U) |
|---|---|---|
| ROE | 37.18% | -12.44% |
| ROIC | 11.21% | -8.16% |
| P/E | 16.85 | -46.16 |
| P/B | 6.27 | 5.74 |
| Current Ratio | 1.14 | 1.84 |
| Quick Ratio | 1.14 | 1.84 |
| D/E | 0.50 | 0.69 |
| Debt-to-Assets | 21.80% | 32.69% |
| Interest Coverage | 12.65 | 19.95 |
| Asset Turnover | 0.84 | 0.27 |
| Fixed Asset Turnover | 17.28 | 27.09 |
| Payout Ratio | 0 | 0 |
| Dividend Yield | 0 | 0 |
| Fiscal Year | 2025 | 2025 |
Efficiency & Valuation Duel: The Vital Signs
Ratios act as a company’s DNA, revealing hidden risks and operational excellence beneath headline figures.
Uber Technologies, Inc.
Uber delivers strong profitability with a 37.18% ROE and a healthy 19.33% net margin, reflecting operational efficiency. Its P/E ratio of 16.85 suggests a fairly valued stock, though a 6.27 P/B ratio raises caution. Uber returns value via reinvestment in growth and maintains a solid balance sheet with favorable leverage and liquidity metrics.
Unity Software Inc.
Unity struggles with negative profitability metrics, including a -12.44% ROE and -21.78% net margin, signaling operational challenges. Its P/E ratio is negative but considered favorable due to losses. The company holds strong liquidity with a 1.84 current ratio but faces risks from high R&D spending and weak interest coverage, showing an unfavorable financial profile overall.
Premium Valuation vs. Operational Safety
Uber balances solid profitability and reasonable valuation, offering a more stable risk-reward profile. Unity’s high liquidity contrasts with deep losses and poor returns, increasing investment uncertainty. Investors seeking operational safety and consistent returns may prefer Uber’s profile, while Unity suits those prioritizing growth potential despite risks.
Which one offers the Superior Shareholder Reward?
Uber Technologies, Inc. (UBER) and Unity Software Inc. (U) share a zero-dividend policy, focusing solely on growth reinvestment and buybacks. Uber boasts stronger free cash flow per share (4.7 vs. 1.0) and a more consistent buyback capacity, reflected in its solid operating cash flow coverage (0.75 vs. 0.19). Unity’s higher gross margin (74% vs. 40%) signals product strength, but persistent net losses and negative profit margins raise sustainability concerns. Uber’s disciplined capital allocation and improving profitability offer a more attractive and sustainable total return profile for 2026 investors.
Comparative Score Analysis: The Strategic Profile
The radar chart reveals the fundamental DNA and trade-offs of Uber Technologies, Inc. and Unity Software Inc., highlighting their core financial strengths and vulnerabilities:
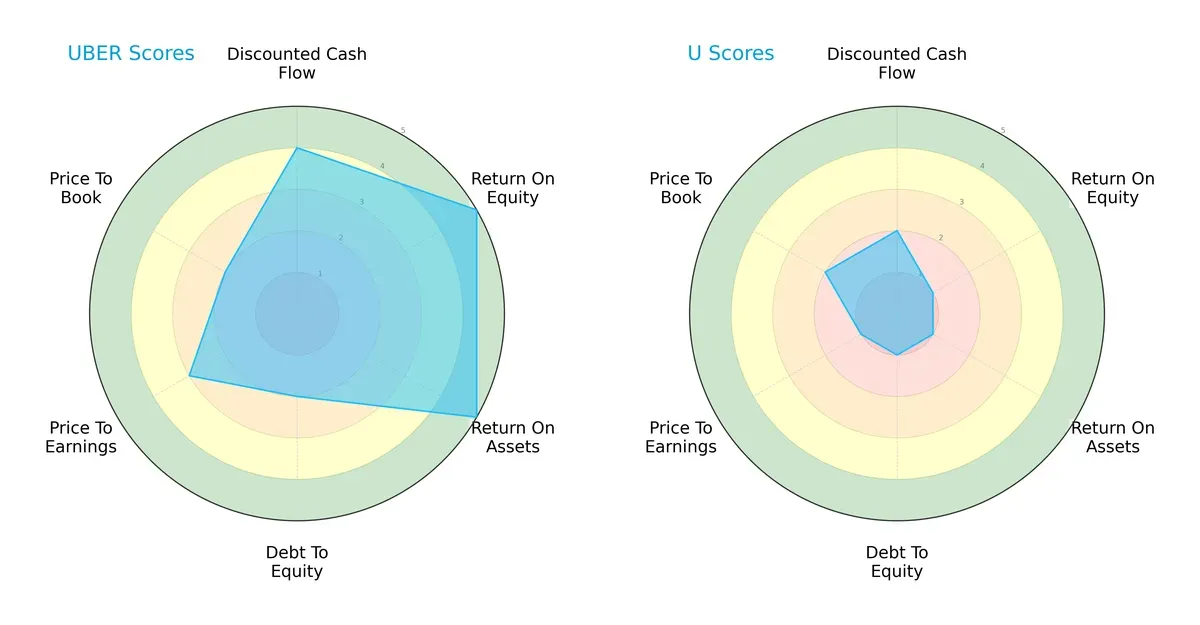
Uber shows a balanced profile with strong returns on equity (5) and assets (5), supported by a favorable discounted cash flow score (4). Its weakness lies in debt management (2) and valuation metrics (PE 3, PB 2). Unity relies on a consistent low base across all metrics, indicating a lack of financial robustness and valuation appeal. Uber’s diversified strengths suggest better capital allocation and operational efficiency compared to Unity’s narrow financial footing.
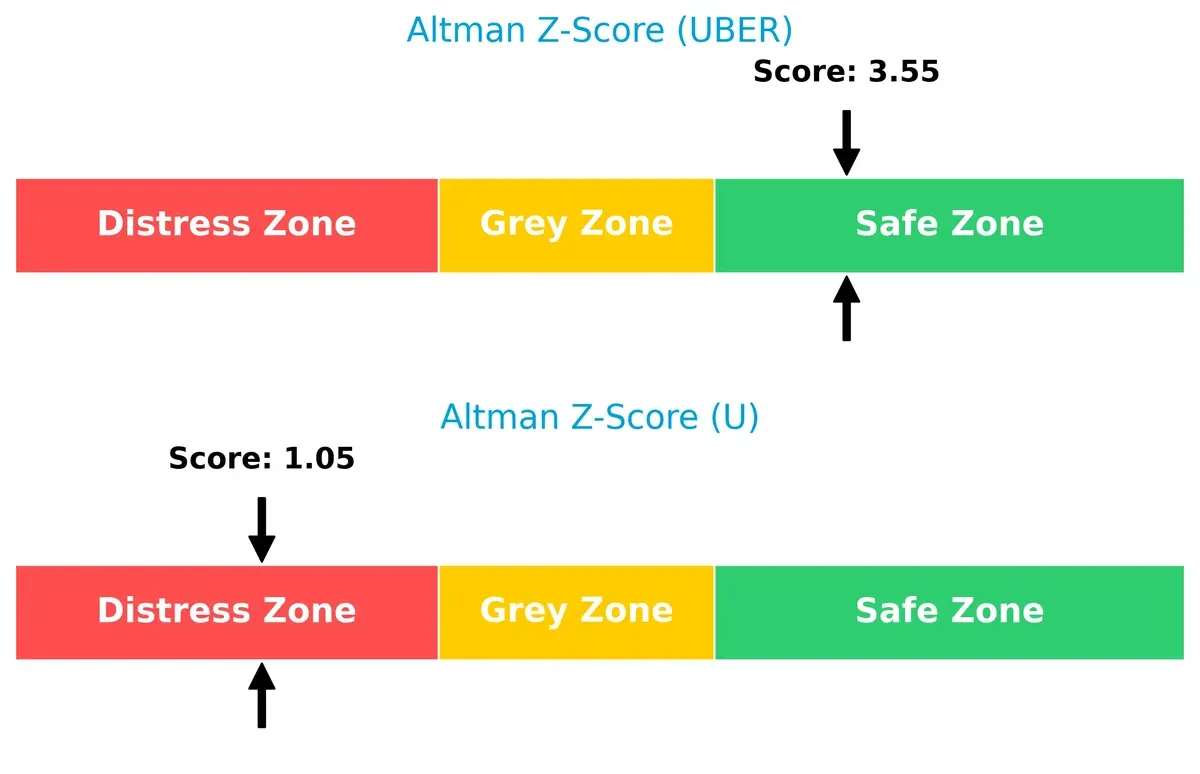
Bankruptcy Risk: Solvency Showdown
Uber’s Altman Z-Score of 3.55 places it securely in the safe zone, indicating robust solvency and low bankruptcy risk. Unity’s 1.05 score signals distress, raising red flags for its long-term survival in this cycle:
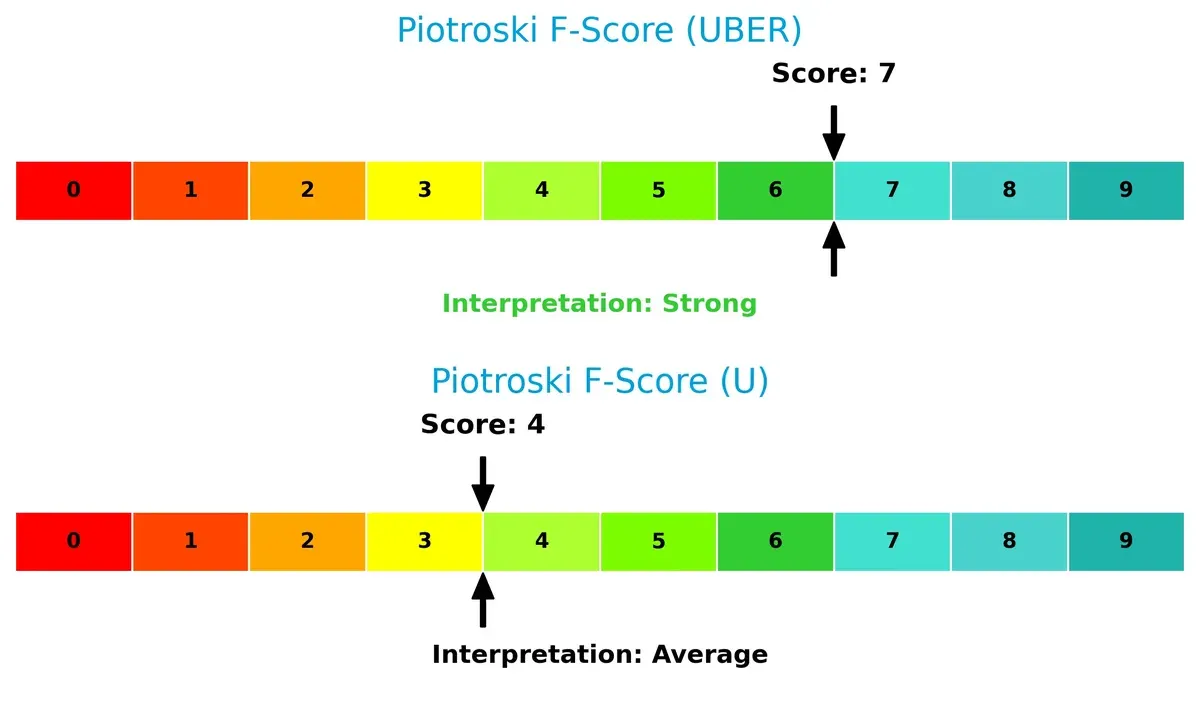
Financial Health: Quality of Operations
Uber’s Piotroski F-Score of 7 reflects strong financial health and operational quality. Unity’s score of 4 shows average financial strength, exposing potential red flags in internal metrics compared to Uber’s solid fundamentals:
How are the two companies positioned?
This section dissects Uber and Unity’s operational DNA by comparing revenue distribution and internal strengths and weaknesses. The goal is to confront their economic moats to identify which model offers the most resilient competitive advantage today.
Revenue Segmentation: The Strategic Mix
This visual comparison dissects how Uber Technologies, Inc. and Unity Software Inc. diversify their income streams and where their primary sector bets lie:
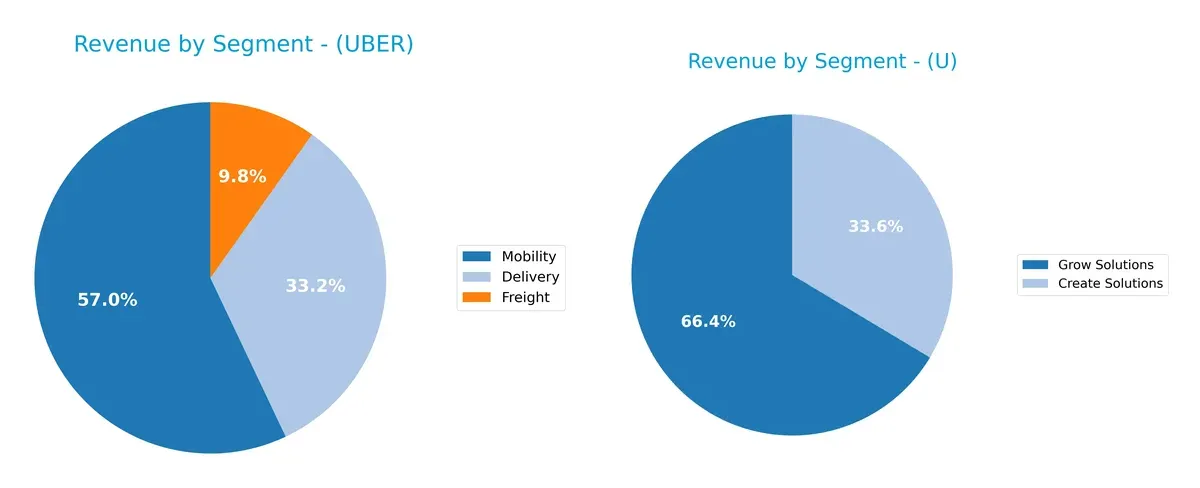
Uber anchors its revenue in Mobility with $29.7B in 2025, dwarfing Delivery at $17.2B and Freight at $5.1B. This concentration shows Uber’s ecosystem lock-in around transport services. Unity, by contrast, pivots between Grow Solutions ($1.23B) and Create Solutions ($621M), showing a more balanced mix. Unity’s diversification reduces reliance on one segment but limits scale compared to Uber’s infrastructure dominance and market footprint.
Strengths and Weaknesses Comparison
This table compares the strengths and weaknesses of Uber Technologies, Inc. and Unity Software Inc.:
Uber Strengths
- Diversified revenue across Delivery, Freight, and Mobility
- Strong profitability with 19.33% net margin and 37.18% ROE
- Favorable leverage and interest coverage
- Large global presence in US, EMEA, Asia Pacific, and Latin America
Unity Strengths
- Solid liquidity with 1.84 current and quick ratios
- Favorable fixed asset turnover at 27.09
- Geographic revenue spread including US, EMEA, and Asia Pacific
- Positive PE ratio reflecting market valuation
Uber Weaknesses
- High price-to-book ratio at 6.27 signals expensive valuation
- Neutral current ratio at 1.14 offers limited short-term liquidity cushion
- No dividend yield
Unity Weaknesses
- Negative profitability metrics with -21.78% net margin and -12.44% ROE
- Unfavorable WACC and interest coverage at zero
- Low asset turnover at 0.27 limits operational efficiency
- Negative global ratios opinion and no dividend yield
Uber demonstrates robust profitability and diversified global operations but faces valuation concerns and modest liquidity. Unity shows liquidity strength and asset utilization but struggles with profitability and financial efficiency, highlighting contrasting strategic challenges.
The Moat Duel: Analyzing Competitive Defensibility
A structural moat is the only true shield preserving long-term profits against relentless competitive pressure. Let’s dissect the core moats of these two tech giants:
Uber Technologies, Inc.: Network Effects Driving Global Scale
Uber’s moat hinges on its vast network effects, connecting millions of riders and drivers worldwide. This manifests in high ROIC exceeding WACC by 2.4%, signaling robust value creation. Expansion into freight and delivery deepens its moat, though regulatory risks remain in 2026.
Unity Software Inc.: Intangible Asset Moat in Real-Time 3D Platform
Unity’s primary moat stems from its proprietary 3D content platform and strong developer ecosystem, distinct from Uber’s scale. Despite negative ROIC versus WACC, improving profitability and user growth signal a recovering moat. Growth hinges on AR/VR adoption and monetization innovation.
Uber’s Global Network vs. Unity’s Platform Innovation
Uber commands a wider, more sustainable moat with proven economic profits and expanding international reach. Unity shows promise but remains in a value-destructive phase, relying on future tech adoption to solidify its moat. Uber is better positioned to defend and grow market share in 2026.
Which stock offers better returns?
The past year shows pronounced price declines for both Uber Technologies, Inc. and Unity Software Inc., with persistent bearish momentum and seller dominance in recent months.
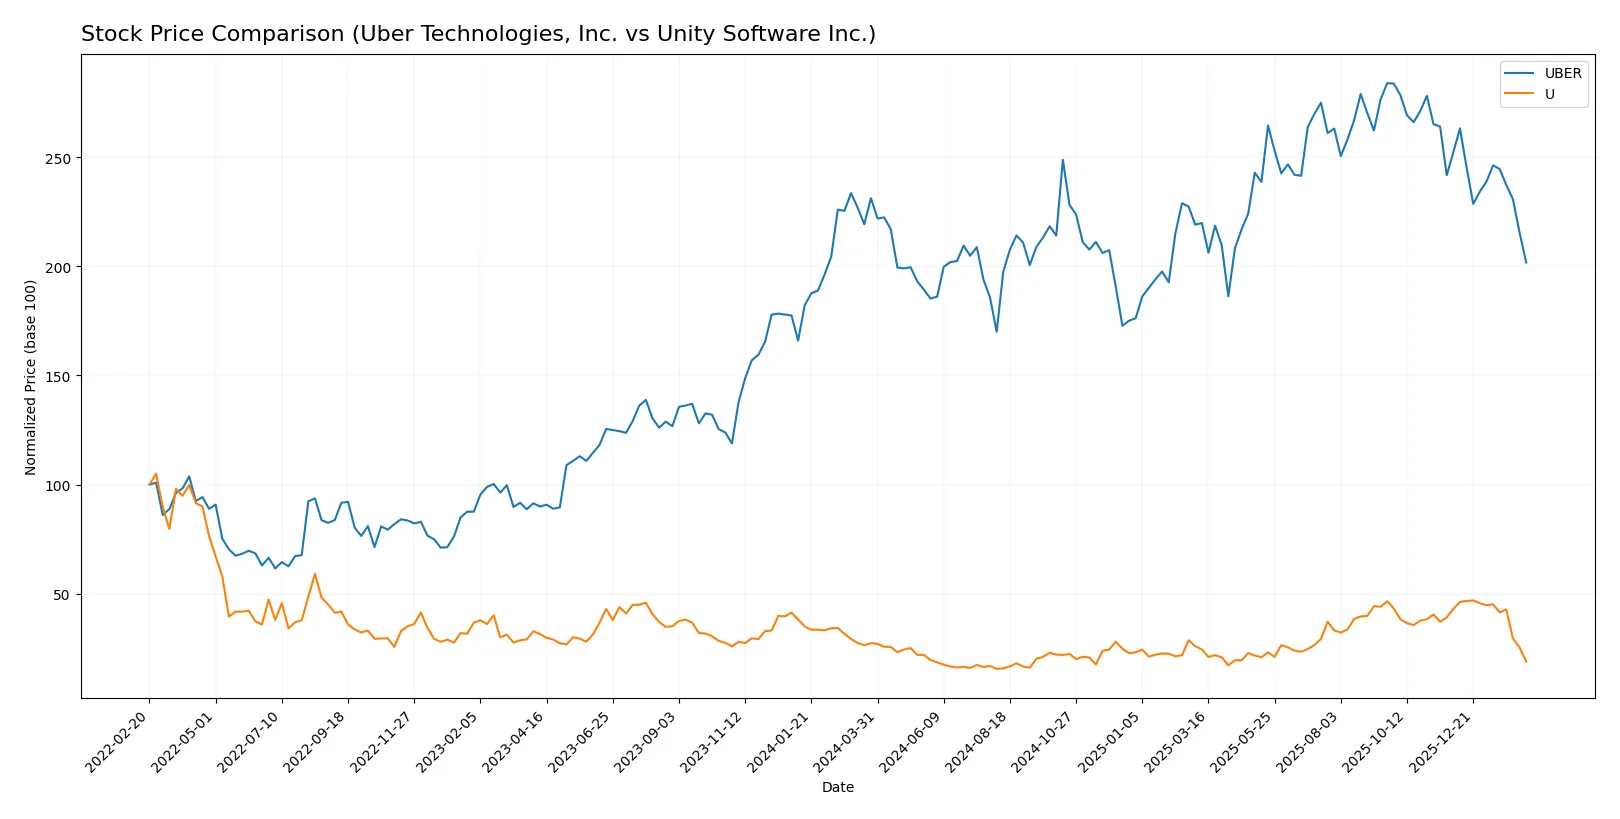
Trend Comparison
Uber’s stock fell 12.76% over the last 12 months, marking a bearish trend with decelerating losses. Its price fluctuated between 58.99 and 98.51, reflecting moderate volatility (std dev 10.33).
Unity’s stock declined 30.79% over the same period, also bearish with decelerating losses. It ranged from 15.32 to 46.42, showing slightly lower volatility (std dev 9.2).
Uber’s less severe decline outperformed Unity’s steeper losses, delivering the higher market return among the two over the past year.
Target Prices
Analysts present a broad consensus indicating significant upside potential for both Uber Technologies, Inc. and Unity Software Inc.
| Company | Target Low | Target High | Consensus |
|---|---|---|---|
| Uber Technologies, Inc. | 72 | 140 | 105.76 |
| Unity Software Inc. | 26 | 60 | 37.7 |
The consensus target for Uber stands about 51% above the current price of $69.99, signaling strong growth expectations. Unity’s target consensus exceeds its $18.68 price by over 100%, reflecting high investor optimism amid volatility.

Don’t Let Luck Decide Your Entry Point
Optimize your entry points with our advanced ProRealTime indicators. You’ll get efficient buy signals with precise price targets for maximum performance. Start outperforming now!
How do institutions grade them?
Uber Technologies, Inc. Grades
Here are the latest institutional grades for Uber Technologies, Inc.:
| Grading Company | Action | New Grade | Date |
|---|---|---|---|
| Citigroup | Maintain | Buy | 2026-02-06 |
| Morgan Stanley | Maintain | Overweight | 2026-02-05 |
| Wedbush | Maintain | Neutral | 2026-02-05 |
| Benchmark | Maintain | Hold | 2026-02-05 |
| JP Morgan | Maintain | Overweight | 2026-02-05 |
| Citizens | Upgrade | Market Outperform | 2026-02-05 |
| RBC Capital | Maintain | Outperform | 2026-02-05 |
| Wells Fargo | Maintain | Overweight | 2026-02-05 |
| Mizuho | Maintain | Outperform | 2026-02-05 |
| Needham | Maintain | Buy | 2026-02-05 |
Unity Software Inc. Grades
Below are the recent institutional grades for Unity Software Inc.:
| Grading Company | Action | New Grade | Date |
|---|---|---|---|
| Goldman Sachs | Maintain | Neutral | 2026-02-12 |
| BTIG | Maintain | Buy | 2026-02-12 |
| Needham | Maintain | Buy | 2026-02-12 |
| Wells Fargo | Maintain | Overweight | 2026-02-12 |
| Wedbush | Maintain | Outperform | 2026-02-12 |
| Macquarie | Maintain | Outperform | 2026-02-12 |
| UBS | Maintain | Neutral | 2026-02-12 |
| Citigroup | Maintain | Buy | 2026-02-12 |
| Barclays | Maintain | Equal Weight | 2026-02-12 |
| Citizens | Maintain | Market Outperform | 2026-02-12 |
Which company has the best grades?
Both companies receive a broad range of positive grades, but Uber shows more consistency around Buy and Overweight ratings. Unity also has strong Buy and Outperform tags but includes more Neutral and Equal Weight grades. Investors might interpret Uber’s steadier buy-side endorsements as a sign of stronger institutional confidence.
Risks specific to each company
The following categories identify the critical pressure points and systemic threats facing both firms in the 2026 market environment:
1. Market & Competition
Uber Technologies, Inc.
- Faces intense competition in ride-sharing, delivery, and freight sectors with global rivals expanding rapidly.
Unity Software Inc.
- Operates in a highly competitive 3D software market with pressure from established players and evolving tech trends.
2. Capital Structure & Debt
Uber Technologies, Inc.
- Maintains a conservative debt-to-equity ratio (0.5) and strong interest coverage (14.18), signaling financial stability.
Unity Software Inc.
- Higher debt-to-equity (0.69) with negative interest coverage raises concerns about financial risk and sustainability.
3. Stock Volatility
Uber Technologies, Inc.
- Exhibits moderate beta (1.21), suggesting average market risk exposure aligned with tech sector norms.
Unity Software Inc.
- Elevated beta (2.09) indicates higher stock price volatility and greater risk sensitivity to market swings.
4. Regulatory & Legal
Uber Technologies, Inc.
- Faces regulatory scrutiny globally on gig worker classification and data privacy, affecting operational costs.
Unity Software Inc.
- Subject to regulations on software export controls and data privacy, with added complexity from international markets.
5. Supply Chain & Operations
Uber Technologies, Inc.
- Operational risk includes driver supply fluctuations and fuel cost volatility impacting service reliability.
Unity Software Inc.
- Dependency on cloud infrastructure and developer ecosystem creates operational risks if platform adoption slows.
6. ESG & Climate Transition
Uber Technologies, Inc.
- Pressured to reduce carbon footprint amid rising electric vehicle integration and sustainability mandates.
Unity Software Inc.
- Faces ESG scrutiny on energy use in data centers and software development, requiring green technology investments.
7. Geopolitical Exposure
Uber Technologies, Inc.
- Broad global footprint exposes it to geopolitical risks including trade tensions and regulatory divergence.
Unity Software Inc.
- International client base subjects it to geopolitical risks, especially amid tightening tech export restrictions.
Which company shows a better risk-adjusted profile?
Uber’s strongest risk lies in regulatory complexity, tempered by its robust capital structure and moderate stock volatility. Unity’s key risk centers on financial instability and high stock volatility, compounded by lower profitability and distress-zone bankruptcy risk. Uber demonstrates a superior risk-adjusted profile, supported by its safe-zone Altman Z-Score (3.55) and strong Piotroski score (7). Unity’s distress-zone Z-Score (1.05) and average Piotroski (4) highlight elevated financial risks. Uber’s robust interest coverage ratio (14.18) versus Unity’s negative coverage confirms my concern over Unity’s financial vulnerability in the current market environment.
Final Verdict: Which stock to choose?
Uber Technologies, Inc. wields unmatched operational efficiency and a proven ability to create value, reflected in its strong and growing ROIC above cost of capital. Its point of vigilance lies in a somewhat stretched valuation multiple and moderate liquidity ratios. Uber suits disciplined growth-oriented portfolios seeking companies with sustainable moats.
Unity Software Inc. offers a strategic moat rooted in its intangible assets and innovative platform, though it currently struggles to convert this into profitability. Its liquidity position appears healthier than Uber’s, presenting a safety cushion amid operational challenges. Unity fits portfolios focused on long-term turnaround potential and innovation-driven growth at a reasonable risk.
If you prioritize consistent value creation and operational strength, Uber is the compelling choice due to its robust profitability and capital efficiency. However, if you seek exposure to innovation with a tolerance for risk and volatility, Unity offers superior upside potential despite its current financial weaknesses. Both require careful risk management aligned with your investment horizon.
Disclaimer: Investment carries a risk of loss of initial capital. The past performance is not a reliable indicator of future results. Be sure to understand risks before making an investment decision.
Go Further
I encourage you to read the complete analyses of Uber Technologies, Inc. and Unity Software Inc. to enhance your investment decisions: