In the dynamic world of software applications, Uber Technologies, Inc. and monday.com Ltd. stand out as innovative players reshaping their respective markets. Uber leads with its comprehensive mobility, delivery, and freight platforms, while monday.com excels in cloud-based work management solutions. Both companies share a commitment to technological innovation, making their comparison valuable for investors seeking growth in the tech sector. Let’s explore which presents the most compelling investment opportunity.

Table of contents
Companies Overview
I will begin the comparison between Uber Technologies, Inc. and monday.com Ltd. by providing an overview of these two companies and their main differences.
Uber Overview
Uber Technologies, Inc. operates proprietary technology applications globally, connecting consumers with independent providers for ridesharing, delivery, and freight services. Its three main segments—Mobility, Delivery, and Freight—cover a broad range of transportation and logistics needs. Founded in 2009 and headquartered in San Francisco, Uber holds a strong position in the software application industry with a market cap of $176B.
monday.com Overview
monday.com Ltd. develops cloud-based software applications focused on work management through its Work OS platform, which serves various organizational needs including marketing, CRM, and project management. Incorporated in 2012 and based in Tel Aviv, the company addresses a diverse client base ranging from businesses to educational and government institutions. monday.com’s market cap stands at approximately $6.5B.
Key similarities and differences
Both Uber and monday.com operate in the software application industry and leverage cloud-based technology to serve global markets. However, Uber focuses primarily on transportation and logistics services, while monday.com specializes in work management software solutions. Additionally, Uber maintains a significantly larger market capitalization and employee base compared to monday.com, reflecting their differing scales and market focuses.
Income Statement Comparison
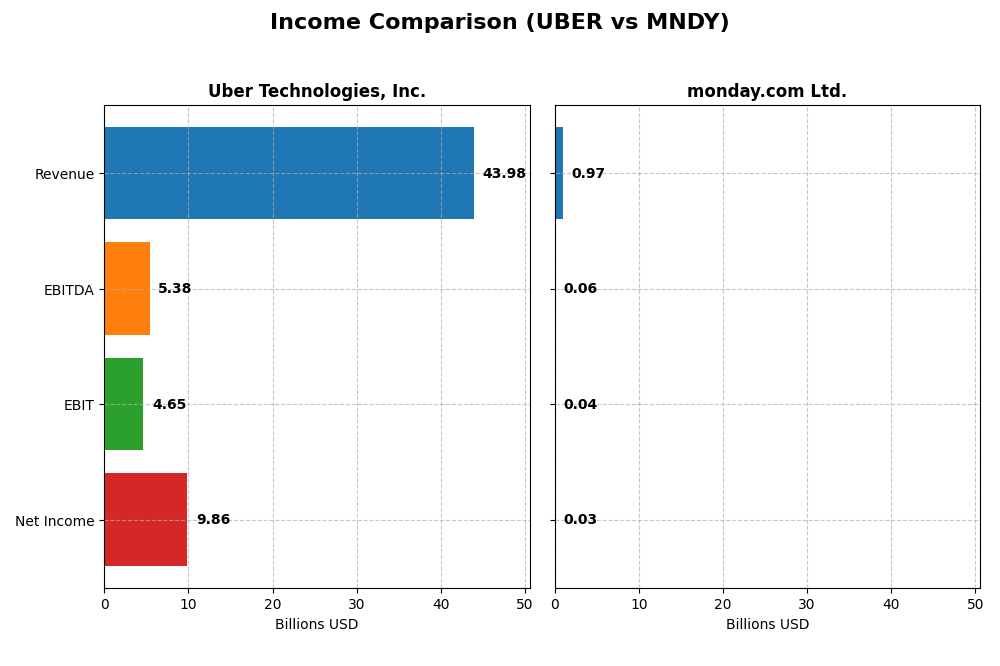
This table presents a side-by-side comparison of key income statement metrics for Uber Technologies, Inc. and monday.com Ltd. for the fiscal year 2024.
| Metric | Uber Technologies, Inc. | monday.com Ltd. |
|---|---|---|
| Market Cap | 176.3B | 6.53B |
| Revenue | 43.98B | 972M |
| EBITDA | 5.39B | 58.0M |
| EBIT | 4.65B | 39.8M |
| Net Income | 9.86B | 32.4M |
| EPS | 4.71 | 0.65 |
| Fiscal Year | 2024 | 2024 |
Income Statement Interpretations
Uber Technologies, Inc.
Uber has shown strong revenue growth from $11.1B in 2020 to $44B in 2024, with net income reversing from a loss of $6.75B in 2020 to a profit of $9.81B in 2024. Margins improved notably, with a gross margin of 39.4% and net margin at 22.4% in 2024. The recent year saw a 17.96% revenue increase and a 342.77% net margin growth, indicating sustained profitability improvements.
monday.com Ltd.
monday.com’s revenue expanded significantly from $161M in 2020 to $972M in 2024, with net income turning positive at $32M in 2024 from losses in prior years. The gross margin remains high at 89.3%, while EBIT and net margins are modest at 4.1% and 3.3%, respectively. In 2024, revenue grew 33.2% and net margin surged 1394.7%, reflecting rapid operational progress and margin recovery.
Which one has the stronger fundamentals?
Uber exhibits robust profitability with consistent margin improvements and substantial net income growth, supported by large-scale operations. monday.com demonstrates impressive revenue growth and high gross margins but has lower and more volatile profitability metrics. While both show favorable income statement trends, Uber’s scale and margin stability suggest stronger fundamental financial performance.
Financial Ratios Comparison
The table below compares key financial ratios for Uber Technologies, Inc. and monday.com Ltd. based on their most recent fiscal year data (2024).
| Ratios | Uber Technologies, Inc. | monday.com Ltd. |
|---|---|---|
| ROE | 45.7% | 3.14% |
| ROIC | 6.79% | -1.73% |
| P/E | 12.8 | 363 |
| P/B | 5.86 | 11.4 |
| Current Ratio | 1.07 | 2.66 |
| Quick Ratio | 1.07 | 2.66 |
| D/E (Debt-to-Equity) | 0.53 | 0.10 |
| Debt-to-Assets | 22.3% | 6.3% |
| Interest Coverage | 5.35 | 0 |
| Asset Turnover | 0.86 | 0.58 |
| Fixed Asset Turnover | 14.1 | 7.13 |
| Payout ratio | 0 | 0 |
| Dividend yield | 0 | 0 |
Interpretation of the Ratios
Uber Technologies, Inc.
Uber shows a generally favorable financial profile with strong net margin at 22.41% and return on equity (ROE) of 45.72%, indicating efficient profitability. Some ratios like price-to-book (PB) at 5.86 are less favorable, suggesting potential overvaluation. The company does not pay dividends, focusing resources on growth and innovation without share buybacks.
monday.com Ltd.
monday.com exhibits weaker profitability with a net margin of 3.33% and ROE of 3.14%, both unfavorable, reflecting limited earnings relative to equity. Its high price-to-earnings (PE) ratio of 363 and price-to-book at 11.41 indicate stretched valuations. The firm also does not distribute dividends, likely prioritizing reinvestment and development over shareholder returns.
Which one has the best ratios?
Uber’s ratios are slightly more favorable overall, with half rated positively and solid profitability metrics, despite some valuation concerns. monday.com presents a more mixed picture, with a balanced share of favorable and unfavorable ratios but weaker profitability and much higher valuation multiples. Uber’s financial metrics suggest greater operational efficiency relative to monday.com.
Strategic Positioning
This section compares the strategic positioning of Uber Technologies, Inc. and monday.com Ltd., including Market position, Key segments, and Exposure to disruption:
Uber Technologies, Inc.
- Large market cap with strong presence in ride-sharing, delivery, and freight, facing intense competition.
- Operates in Mobility, Delivery, and Freight segments driving revenue through transportation and logistics.
- Exposure to technological disruption through proprietary apps in transportation and delivery logistics.
monday.com Ltd.
- Smaller market cap focused on cloud-based work management software, competing in a niche software market.
- Offers a modular Work OS platform serving marketing, CRM, project management, and other business functions.
- Faces disruption risks in cloud software, emphasizing modular and visual work management innovation.
Uber vs monday.com Positioning
Uber has a diversified business model across mobility, delivery, and freight, generating significant revenue streams. monday.com concentrates on software applications for work management, with a smaller employee base and market cap, indicating more focused operations but narrower industry reach.
Which has the best competitive advantage?
Both companies show slightly unfavorable MOAT evaluations with ROIC below WACC but improving profitability trends. Uber’s broader segment diversification contrasts with monday.com’s specialized software focus, though neither currently demonstrates strong value creation.
Stock Comparison
The past year showed divergent price movements for Uber Technologies, Inc. and monday.com Ltd., with Uber demonstrating a moderate bullish trend despite recent weakness, while monday.com experienced a pronounced bearish trajectory.

Trend Analysis
Uber Technologies, Inc. exhibited an overall bullish trend with an 8.5% price increase over the past 12 months, accompanied by decelerating momentum and significant volatility (std deviation 10.29). The stock ranged between 58.99 and 98.51, but recent weeks show a -12.07% price decline with seller dominance.
monday.com Ltd. faced a strong bearish trend, with a 39.06% price drop over the same 12-month period and decelerating trend momentum. Volatility was notably high (std deviation 47.32), with prices fluctuating from 126.7 to 324.31. Recent performance worsened, declining 38.27% amid increased selling pressure.
Comparing the two, Uber delivered the highest market performance with a positive 8.5% gain, contrasting sharply with monday.com’s substantial 39.06% loss over the past year.
Target Prices
The current analyst consensus presents optimistic target prices for both Uber Technologies, Inc. and monday.com Ltd.
| Company | Target High | Target Low | Consensus |
|---|---|---|---|
| Uber Technologies, Inc. | 140 | 73 | 111.26 |
| monday.com Ltd. | 330 | 194 | 264.42 |
Analysts expect Uber’s stock to appreciate significantly from its current price of $84.85, while monday.com’s consensus target price of $264.42 suggests a strong upside from $126.70.
Analyst Opinions Comparison
This section compares analysts’ ratings and grades for Uber Technologies, Inc. and monday.com Ltd.:
Rating Comparison
Uber Rating
- Rating: B, classified as Very Favorable overall.
- Discounted Cash Flow Score: 1, Very Unfavorable valuation.
- ROE Score: 5, Very Favorable indicating efficient profit use.
- ROA Score: 5, Very Favorable asset utilization.
- Debt To Equity Score: 2, Moderate financial risk.
- Overall Score: 3, Moderate financial standing.
monday.com Rating
- Rating: B-, also classified as Very Favorable overall.
- Discounted Cash Flow Score: 4, Favorable valuation.
- ROE Score: 3, Moderate efficiency in generating profit.
- ROA Score: 3, Moderate asset utilization.
- Debt To Equity Score: 3, Moderate financial risk.
- Overall Score: 3, Moderate financial standing.
Which one is the best rated?
Both companies have the same overall score of 3 and are rated very favorably. Uber scores higher on ROE and ROA but has a very unfavorable discounted cash flow score, while monday.com fares better on discounted cash flow but lower on profitability metrics.
Scores Comparison
The scores comparison for Uber Technologies, Inc. and monday.com Ltd. is as follows:
Uber Scores
- Altman Z-Score: 4.44, indicating a safe zone with low bankruptcy risk.
- Piotroski Score: 6, reflecting average financial strength.
monday.com Scores
- Altman Z-Score: 6.33, indicating a safe zone with very low bankruptcy risk.
- Piotroski Score: 5, reflecting average financial strength.
Which company has the best scores?
monday.com Ltd. has a higher Altman Z-Score, suggesting a stronger financial stability regarding bankruptcy risk. Uber has a slightly better Piotroski Score, but both are rated as average in financial strength.
Grades Comparison
Here is a detailed comparison of the most recent grades for Uber Technologies, Inc. and monday.com Ltd.:
Uber Technologies, Inc. Grades
The table below summarizes recent grades issued by reputable grading firms for Uber Technologies, Inc.:
| Grading Company | Action | New Grade | Date |
|---|---|---|---|
| BTIG | Maintain | Buy | 2026-01-15 |
| Wells Fargo | Maintain | Overweight | 2026-01-08 |
| Cantor Fitzgerald | Maintain | Overweight | 2026-01-08 |
| Wolfe Research | Maintain | Outperform | 2026-01-06 |
| Wedbush | Maintain | Neutral | 2025-12-19 |
| Morgan Stanley | Maintain | Overweight | 2025-12-08 |
| Arete Research | Upgrade | Buy | 2025-12-03 |
| Wells Fargo | Maintain | Overweight | 2025-11-05 |
| Guggenheim | Maintain | Buy | 2025-11-05 |
| DA Davidson | Maintain | Buy | 2025-11-05 |
Uber’s grades predominantly indicate a positive outlook, with multiple buy and overweight ratings, and a consensus rating of Buy.
monday.com Ltd. Grades
The table below presents recent grades given by recognized firms for monday.com Ltd.:
| Grading Company | Action | New Grade | Date |
|---|---|---|---|
| BTIG | Maintain | Buy | 2026-01-15 |
| Barclays | Maintain | Overweight | 2026-01-12 |
| Jefferies | Maintain | Buy | 2026-01-05 |
| Citigroup | Maintain | Buy | 2025-12-23 |
| Tigress Financial | Maintain | Buy | 2025-12-11 |
| Baird | Maintain | Outperform | 2025-11-11 |
| Wells Fargo | Maintain | Overweight | 2025-11-11 |
| DA Davidson | Maintain | Buy | 2025-11-11 |
| Morgan Stanley | Maintain | Overweight | 2025-11-11 |
| Piper Sandler | Maintain | Overweight | 2025-11-11 |
monday.com Ltd. also shows a strong positive grading trend with numerous buy and overweight ratings and a consensus rating of Buy.
Which company has the best grades?
Both Uber Technologies, Inc. and monday.com Ltd. exhibit predominantly buy and overweight ratings from respected grading companies, with no sell or strong sell grades. Uber has a slightly higher number of buy ratings, while monday.com shows a consistent overweight and buy pattern. This suggests both companies are positively viewed by analysts, potentially benefiting investors seeking growth opportunities in their portfolios.
Strengths and Weaknesses
Below is a comparative table highlighting key strengths and weaknesses of Uber Technologies, Inc. and monday.com Ltd. based on recent financial and operational data:
| Criterion | Uber Technologies, Inc. | monday.com Ltd. |
|---|---|---|
| Diversification | High: Revenue from Delivery (13.75B), Mobility (25.09B), Freight (5.14B) segments | Low: Single core business focus on work management software |
| Profitability | Strong net margin (22.41%) and ROE (45.72%) | Low net margin (3.33%) and ROE (3.14%) |
| Innovation | Moderate: Growing ROIC trend but currently shedding value (ROIC – WACC = -2.38%) | Moderate: Growing ROIC trend but value destroying (ROIC – WACC = -11.37%) |
| Global presence | Extensive global footprint through mobility and delivery services | Growing international presence but smaller scale |
| Market Share | Large market share in ride-hailing and food delivery markets | Niche market leader in project management tools |
Key takeaways: Uber demonstrates strong profitability and diversification across multiple large-scale segments, though it is currently shedding value despite improving returns. monday.com shows growth potential with improving ROIC but lags in profitability and scale, indicating higher risk and more concentrated exposure. Investors should weigh Uber’s established market position against monday.com’s growth trajectory and risk profile.
Risk Analysis
Below is a table summarizing key risks for Uber Technologies, Inc. and monday.com Ltd. based on the most recent 2024 data:
| Metric | Uber Technologies, Inc. | monday.com Ltd. |
|---|---|---|
| Market Risk | Moderate (Beta 1.20) | Moderate (Beta 1.26) |
| Debt level | Moderate (DE 0.53) | Low (DE 0.10) |
| Regulatory Risk | Moderate (US tech & transport regulations) | Moderate (International software compliance) |
| Operational Risk | Moderate (Scale, gig economy reliance) | Moderate (Cloud platform reliability) |
| Environmental Risk | Low (Limited direct environmental impact) | Low (Software industry) |
| Geopolitical Risk | Moderate (Global footprint) | Moderate (Based in Israel, global exposure) |
Uber faces moderate market and regulatory risks due to its global presence and industry regulations, while monday.com has lower debt risk but high valuation concerns. Uber’s operational risks stem from scaling and gig economy challenges, whereas monday.com’s risks relate to platform stability and international compliance. Geopolitical tensions may impact both given their international operations.
Which Stock to Choose?
Uber Technologies, Inc. shows a favorable income evolution with significant revenue and net income growth, supported by strong profitability ratios such as a 45.72% ROE and a 22.41% net margin. Its debt levels remain manageable with a net debt to EBITDA of 0.93, and the overall rating is very favorable (B).
monday.com Ltd. exhibits robust revenue growth but lower profitability, with a 3.14% ROE and a modest 3.33% net margin. The company maintains low debt levels and strong liquidity, reflected in a current ratio of 2.66, and it holds a very favorable rating (B-) despite some unfavorable valuation metrics.
For investors prioritizing growth and profitability, Uber’s strong income and financial ratios might appear more attractive, while those valuing liquidity and lower leverage could see monday.com as favorable. Both companies show slightly unfavorable economic moats but improving profitability, suggesting a nuanced choice based on risk tolerance and investment strategy.
Disclaimer: Investment carries a risk of loss of initial capital. The past performance is not a reliable indicator of future results. Be sure to understand risks before making an investment decision.
Go Further
I encourage you to read the complete analyses of Uber Technologies, Inc. and monday.com Ltd. to enhance your investment decisions: