In the dynamic software application industry, Workday, Inc. and Tyler Technologies, Inc. stand out as key players driving innovation and digital transformation. Workday focuses on enterprise cloud applications for finance and human capital management, while Tyler specializes in integrated information solutions for the public sector. Their distinct market approaches and overlapping technology strategies make this comparison essential. Join me as we explore which company holds the most promise for investors in 2026.
Table of contents
Companies Overview
I will begin the comparison between Workday, Inc. and Tyler Technologies, Inc. by providing an overview of these two companies and their main differences.
Workday Overview
Workday, Inc. develops enterprise cloud applications globally, focusing on financial management, human capital management, and analytics. Its solutions help organizations plan, execute, and analyze business operations with real-time insights and automation. The company serves diverse industries including healthcare, government, and retail, positioning itself as a major player in cloud-based application software since its founding in 2005.
Tyler Technologies Overview
Tyler Technologies, Inc. provides integrated information management software and services tailored to the public sector. Its offerings cover financial management, judicial systems, public safety, and school administration. The company emphasizes automation of government functions and collaborates with Amazon Web Services for cloud hosting. Founded in 1966, Tyler maintains a strong presence in government technology solutions.
Key similarities and differences
Both Workday and Tyler operate in the software application industry with a focus on specialized enterprise solutions. Workday targets a broad range of industries with cloud-based financial and human resources applications, while Tyler concentrates on public sector management and judicial systems. Workday’s business model is centered on cloud SaaS for multiple sectors, whereas Tyler integrates software with services primarily for government entities.
Income Statement Comparison
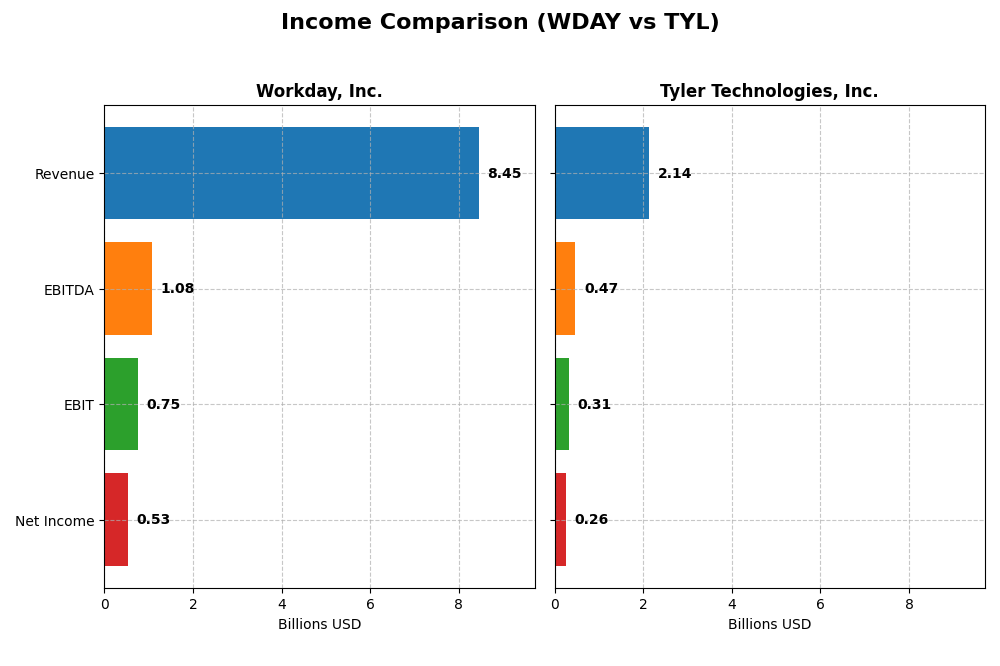
This table provides a side-by-side comparison of key income statement metrics for Workday, Inc. and Tyler Technologies, Inc. for their most recent fiscal years.
| Metric | Workday, Inc. (WDAY) | Tyler Technologies, Inc. (TYL) |
|---|---|---|
| Market Cap | 49.9B | 18.9B |
| Revenue | 8.45B | 2.14B |
| EBITDA | 1.08B | 466M |
| EBIT | 752M | 314M |
| Net Income | 526M | 263M |
| EPS | 1.98 | 6.17 |
| Fiscal Year | 2025 | 2024 |
Income Statement Interpretations
Workday, Inc.
Workday’s revenue showed a strong upward trend from 4.3B in 2021 to 8.4B in 2025, nearly doubling over five years. Net income recovered from losses in 2021-2023 to 526M in 2025. Margins were generally stable with a favorable gross margin around 75.5%. Despite a net margin drop in 2025, overall income growth and EPS improved substantially across the period.
Tyler Technologies, Inc.
Tyler Technologies experienced consistent revenue growth from 1.1B in 2020 to 2.1B in 2024, with net income rising steadily to 263M in the latest year. Margins were favorable, with a gross margin near 41% and a strong net margin of 12.3%. The company showed solid profitability improvements in 2024, including a 44.7% net margin increase and EPS growth of 56%.
Which one has the stronger fundamentals?
Both companies show favorable income statement fundamentals, but Tyler Technologies demonstrates higher net and EBIT margins, reflecting stronger profitability. Workday boasts faster overall revenue and net income growth, but with more margin volatility and recent net margin decline. Tyler’s more consistent profitability contrasts with Workday’s rapid expansion but less stable net income, offering differing profiles of financial strength.
Financial Ratios Comparison
Below is a comparison of key financial ratios for Workday, Inc. and Tyler Technologies, Inc. based on the most recent fiscal year data available.
| Ratios | Workday, Inc. (WDAY) FY 2025 | Tyler Technologies, Inc. (TYL) FY 2024 |
|---|---|---|
| ROE | 5.82% | 7.76% |
| ROIC | 2.73% | 6.20% |
| P/E | 132.15 | 93.42 |
| P/B | 7.69 | 7.25 |
| Current Ratio | 1.85 | 1.35 |
| Quick Ratio | 1.85 | 1.35 |
| D/E (Debt to Equity) | 0.37 | 0.19 |
| Debt-to-Assets | 18.70% | 12.32% |
| Interest Coverage | 3.64 | 50.50 |
| Asset Turnover | 0.47 | 0.41 |
| Fixed Asset Turnover | 5.36 | 10.95 |
| Payout Ratio | 0 | 0 |
| Dividend Yield | 0 | 0 |
Interpretation of the Ratios
Workday, Inc.
Workday presents a mixed ratio profile with a neutral net margin of 6.23% but unfavorable returns on equity (5.82%) and invested capital (2.73%). Its liquidity and solvency ratios, including a current ratio of 1.85 and debt-to-assets at 18.7%, are favorable. The company does not pay dividends, reflecting a reinvestment strategy likely aimed at supporting growth and innovation.
Tyler Technologies, Inc.
Tyler Technologies shows stronger profitability with a favorable net margin of 12.3% but a still unfavorable return on equity at 7.76%. Its weighted average cost of capital (7.99%) and interest coverage ratio (52.96) are favorable, supporting financial stability. Like Workday, Tyler does not distribute dividends, suggesting a focus on reinvestment and operational expansion.
Which one has the best ratios?
Tyler Technologies holds a slightly more favorable overall ratio stance with 50% favorable versus 35.7% unfavorable ratios, compared to Workday’s balanced 42.9% split. Tyler’s stronger profitability and cash flow coverage metrics contrast Workday’s weaker returns and higher valuation multiples, indicating a relatively more robust financial position.
Strategic Positioning
This section compares the strategic positioning of Workday and Tyler Technologies, focusing on market position, key segments, and exposure to technological disruption:
Workday, Inc.
- Large market cap (50B), faces competitive pressure in enterprise cloud applications.
- Key segments: Subscription services dominate; also offers professional services in finance, HR, analytics.
- Exposure includes cloud applications and machine learning to improve efficiency and automation.
Tyler Technologies, Inc.
- Smaller market cap (19B), competes in public sector software with niche focus.
- Diverse segments including enterprise software, appraisal and tax, SaaS, and transaction fees.
- Partnership with AWS for cloud hosting; focus on public sector digital transformation.
Workday vs Tyler Technologies Positioning
Workday has a diversified business model centered on enterprise cloud solutions for multiple industries, while Tyler concentrates on integrated public sector management software. Workday’s scale offers broad market reach, whereas Tyler’s niche focus may limit diversification but target specific government needs.
Which has the best competitive advantage?
Both companies are currently shedding value as ROIC is below WACC. Workday shows improving profitability with a growing ROIC trend, whereas Tyler faces declining ROIC and very unfavorable moat status, indicating weaker competitive advantage.
Stock Comparison
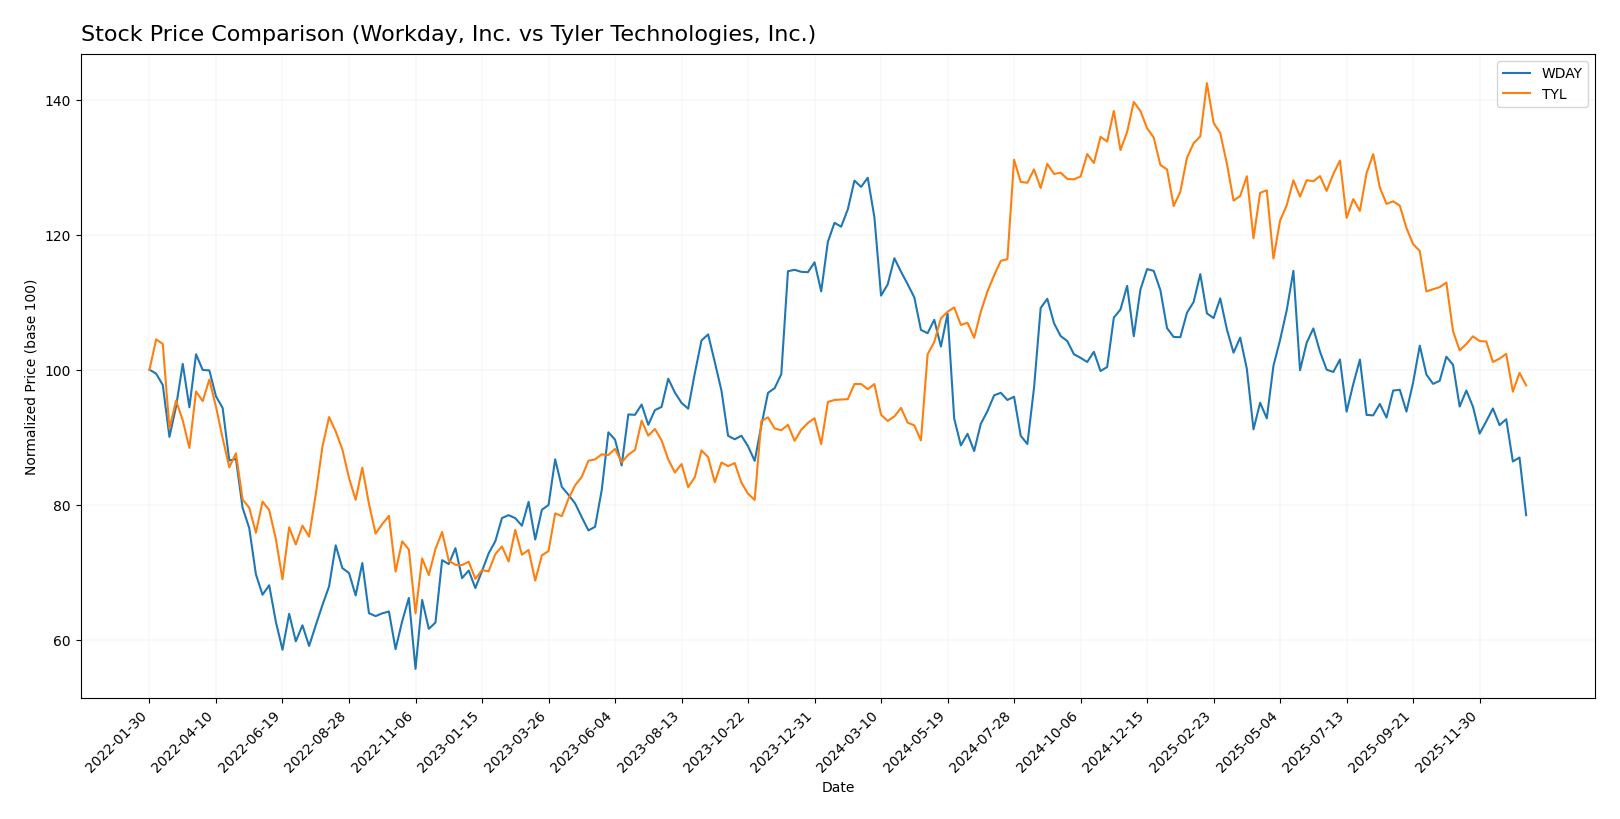
The stock price movements of Workday, Inc. (WDAY) and Tyler Technologies, Inc. (TYL) over the past 12 months reveal contrasting trends with notable price volatility and shifting buyer-seller dynamics.
Trend Analysis
Workday, Inc. (WDAY) experienced a bearish trend over the past year with a price decline of -38.91%, showing deceleration in the downward movement and a high volatility level with a standard deviation of 20.22. The stock hit a high of 305.88 and a low of 186.86.
Tyler Technologies, Inc. (TYL) showed a slight bullish trend with a modest price increase of 0.58% over the same period, also with deceleration in trend momentum. The stock exhibited significant volatility, reflected in a standard deviation of 61.82, with prices ranging between 403.35 and 641.7.
Comparing the two, Tyler Technologies delivered the highest market performance, maintaining a near-neutral overall increase, while Workday’s stock sharply declined during the analyzed 12-month period.
Target Prices
Analysts present a positive target price consensus for both Workday, Inc. and Tyler Technologies, Inc.
| Company | Target High | Target Low | Consensus |
|---|---|---|---|
| Workday, Inc. | 320 | 235 | 274.47 |
| Tyler Technologies, Inc. | 675 | 470 | 584 |
The consensus targets suggest significant upside potential compared to current prices of $186.86 for Workday and $440.01 for Tyler Technologies, reflecting optimistic analyst expectations.
Analyst Opinions Comparison
This section compares analysts’ ratings and grades for Workday, Inc. and Tyler Technologies, Inc.:
Rating Comparison
Workday, Inc. Rating
- Rating: B- with a very favorable status.
- Discounted Cash Flow Score: 4, indicating a favorable outlook on future cash flows.
- ROE Score: 3, reflecting a moderate ability to generate profit from shareholders’ equity.
- ROA Score: 3, indicating moderate effectiveness in asset utilization.
- Debt To Equity Score: 2, representing moderate financial risk.
- Overall Score: 2, categorized as moderate overall financial standing.
Tyler Technologies, Inc. Rating
- Rating: B with a very favorable status.
- Discounted Cash Flow Score: 4, also favorable for future cash flow projections.
- ROE Score: 3, showing a similar moderate efficiency in using equity to generate profits.
- ROA Score: 4, suggesting a favorable effectiveness in generating earnings from assets.
- Debt To Equity Score: 3, indicating moderate financial risk but slightly stronger balance sheet.
- Overall Score: 3, reflecting a moderate but higher overall financial standing than Workday.
Which one is the best rated?
Tyler Technologies holds a higher overall rating (B) and overall score (3) compared to Workday’s B- rating and score of 2. Tyler scores better in ROA and debt to equity, suggesting a marginally stronger financial profile based on this data.
Scores Comparison
Here is a comparison of the Altman Z-Score and Piotroski Score for Workday, Inc. and Tyler Technologies, Inc.:
WDAY Scores
- Altman Z-Score: 4.41 indicates financial safety in the safe zone.
- Piotroski Score: 6, reflecting average financial strength.
TYL Scores
- Altman Z-Score: 7.42 indicates strong financial safety in the safe zone.
- Piotroski Score: 6, reflecting average financial strength.
Which company has the best scores?
Tyler Technologies has a higher Altman Z-Score than Workday, indicating stronger financial safety. Both companies share the same average Piotroski Score of 6.
Grades Comparison
Here is a comparison of the recent grades assigned to Workday, Inc. and Tyler Technologies, Inc.:
Workday, Inc. Grades
This table shows the latest grades from reputable grading firms for Workday, Inc.
| Grading Company | Action | New Grade | Date |
|---|---|---|---|
| Barclays | Maintain | Overweight | 2026-01-12 |
| RBC Capital | Maintain | Outperform | 2026-01-05 |
| TD Cowen | Maintain | Buy | 2025-11-26 |
| DA Davidson | Maintain | Neutral | 2025-11-26 |
| Wells Fargo | Maintain | Overweight | 2025-11-26 |
| Barclays | Maintain | Overweight | 2025-11-26 |
| Keybanc | Maintain | Overweight | 2025-11-26 |
| Citigroup | Maintain | Neutral | 2025-11-26 |
| JP Morgan | Maintain | Overweight | 2025-11-26 |
| UBS | Maintain | Neutral | 2025-11-26 |
Workday’s grades largely show a positive outlook, with multiple Overweight and Buy ratings and few Neutral assessments.
Tyler Technologies, Inc. Grades
This table summarizes recent grades from verified grading firms for Tyler Technologies, Inc.
| Grading Company | Action | New Grade | Date |
|---|---|---|---|
| Piper Sandler | Maintain | Overweight | 2026-01-13 |
| Wells Fargo | Maintain | Equal Weight | 2026-01-08 |
| DA Davidson | Maintain | Neutral | 2025-12-09 |
| Evercore ISI Group | Maintain | In Line | 2025-10-31 |
| DA Davidson | Maintain | Neutral | 2025-10-31 |
| DA Davidson | Maintain | Neutral | 2025-10-10 |
| DA Davidson | Maintain | Neutral | 2025-08-05 |
| Barclays | Maintain | Overweight | 2025-07-31 |
| Needham | Maintain | Buy | 2025-05-13 |
| Barclays | Maintain | Overweight | 2025-04-25 |
Tyler Technologies shows a mix of Overweight, Buy, Neutral, and Equal Weight ratings, reflecting a more cautious stance overall.
Which company has the best grades?
Workday, Inc. has received more consistent positive grades, including multiple Overweight and Buy ratings, compared to Tyler Technologies, which shows more Neutral and Equal Weight ratings. This suggests Workday might be viewed more favorably by analysts, potentially impacting investor sentiment and portfolio positioning accordingly.
Strengths and Weaknesses
Below is a comparative table highlighting the key strengths and weaknesses of Workday, Inc. (WDAY) and Tyler Technologies, Inc. (TYL) based on the latest available data.
| Criterion | Workday, Inc. (WDAY) | Tyler Technologies, Inc. (TYL) |
|---|---|---|
| Diversification | Focused mainly on subscription services (7.7B in 2025) with growing professional services segment; moderate diversification | More diversified revenue streams: SaaS, transaction fees, maintenance, hardware; broader product mix |
| Profitability | Net margin moderate at 6.23%, ROIC 2.73% below WACC; profitability improving but still shedding value | Higher net margin at 12.3%, ROIC 6.2% close to WACC; profitability declining and value being destroyed |
| Innovation | Strong innovation with growing ROIC trend (+162%), but currently value destructive; high PE (132) suggests growth expectations | Less innovation reflected in declining ROIC (-27%); PE lower but still high (93); innovation pace slower |
| Global presence | Large global footprint with significant subscription growth worldwide | More US-focused, with steady growth in niche government software market |
| Market Share | Leading in enterprise cloud HR solutions with strong subscription base | Leading in public sector software with broad product offerings; smaller market but stable |
Key takeaways: Workday shows strong growth potential driven by innovation and subscription services but struggles with profitability and valuation concerns. Tyler Technologies offers more stable profitability in a niche market but faces declining returns and slower innovation. Investors should weigh growth versus stability and be cautious with valuations.
Risk Analysis
Below is a comparative table of key risk metrics for Workday, Inc. (WDAY) and Tyler Technologies, Inc. (TYL) as of their most recent fiscal years.
| Metric | Workday, Inc. (WDAY) | Tyler Technologies, Inc. (TYL) |
|---|---|---|
| Market Risk | Beta 1.14 – moderately volatile | Beta 0.92 – lower volatility |
| Debt level | Debt-to-Equity 0.37 – moderate and favorable | Debt-to-Equity 0.19 – relatively low |
| Regulatory Risk | Moderate – operates globally in software sector | Moderate – public sector software focus |
| Operational Risk | Medium – depends on cloud infrastructure and innovation | Medium – reliant on government contracts |
| Environmental Risk | Low – mainly software business | Low – primarily software services |
| Geopolitical Risk | Moderate – international exposure | Low to moderate – mostly US-focused |
The most impactful risks lie in market volatility and operational dependencies. Workday’s higher beta indicates greater sensitivity to market swings, while Tyler’s dependence on public sector budgets could affect revenue stability. Both maintain manageable debt levels and face typical regulatory scrutiny in technology sectors.
Which Stock to Choose?
Workday, Inc. (WDAY) shows a favorable income statement with strong revenue growth of 16.35% in the last year and a 95.6% increase over five years. Despite this, its profitability ratios such as ROE (5.82%) and ROIC (2.73%) are unfavorable, and it carries moderate net debt to EBITDA of 1.69. The company’s overall rating is very favorable (B-), supported by a safe zone Altman Z-Score and average Piotroski score.
Tyler Technologies, Inc. (TYL) presents a favorable income profile with a steady 9.53% revenue growth last year and 91.45% over five years. Its profitability ratios are mixed, with a 7.76% ROE and neutral ROIC (6.2%), and it maintains a low net debt to EBITDA ratio of -0.23. The company holds a very favorable rating (B) with a strong Altman Z-Score in the safe zone and an average Piotroski score.
Considering ratings and financial metrics, WDAY’s strong income growth but mixed profitability contrasts with TYL’s slightly more balanced ratios and value metrics. Growth-oriented investors might view WDAY’s expanding income and improving profitability as attractive, while those favoring financial stability and consistent returns may find TYL’s profile more appealing. Both stocks show risks and strengths that could influence decisions depending on individual investor risk tolerance and strategy.
Disclaimer: Investment carries a risk of loss of initial capital. The past performance is not a reliable indicator of future results. Be sure to understand risks before making an investment decision.
Go Further
I encourage you to read the complete analyses of Workday, Inc. and Tyler Technologies, Inc. to enhance your investment decisions: