Home > Comparison > Technology > U vs TYL
The strategic rivalry between Unity Software Inc. and Tyler Technologies, Inc. defines the current trajectory of the technology sector’s software application industry. Unity operates a dynamic platform for interactive real-time 3D content, emphasizing innovation and high growth. Tyler Technologies delivers integrated information management solutions for the public sector, focusing on steady, essential service delivery. This analysis will determine which company offers the superior risk-adjusted outlook for a diversified portfolio in 2026.
Table of contents
Companies Overview
Unity Software and Tyler Technologies stand as pivotal players in the software application market, shaping distinct niches with broad technological impact.
Unity Software Inc.: Real-Time 3D Content Pioneer
Unity Software dominates the interactive real-time 3D content platform space. Its core revenue comes from licensing software that enables developers to create and monetize 2D and 3D content across devices. In 2026, Unity focuses strategically on expanding its global developer ecosystem and enhancing AR/VR capabilities for immersive experiences.
Tyler Technologies, Inc.: Public Sector Software Specialist
Tyler Technologies leads in integrated information management solutions for the public sector. Its revenue engine hinges on diversified software for government agencies, covering financial management, courts, tax, and public safety. Tyler’s 2026 strategy emphasizes cloud migration through a partnership with Amazon Web Services to boost scalability and innovation.
Strategic Collision: Similarities & Divergences
Both firms excel in software but differ sharply in focus—Unity embraces a content creation platform for varied industries, while Tyler targets government operations with specialized solutions. Their competition lies in the software application realm but serves vastly different client bases and needs. Unity’s growth is driven by platform adoption and innovation, whereas Tyler offers stable, mission-critical government contracts, defining distinct investment profiles.
Income Statement Comparison
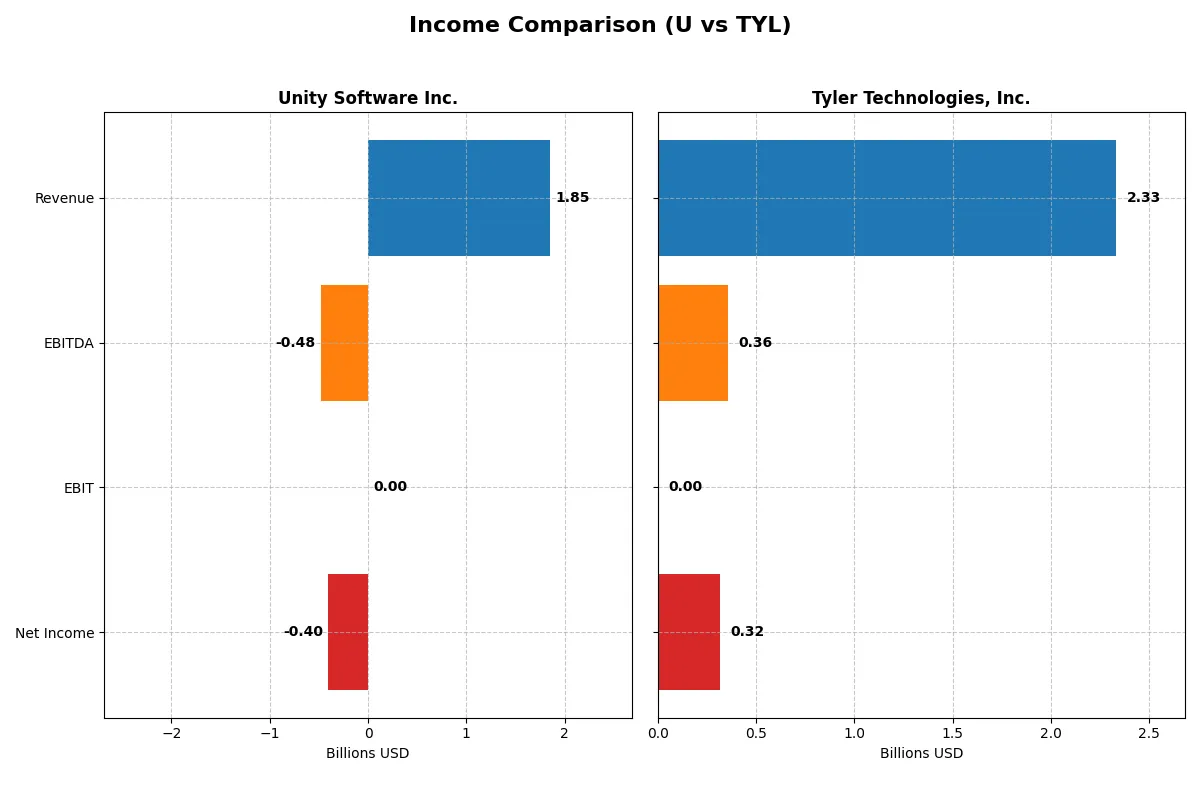
This data dissects the core profitability and scalability of both corporate engines to reveal who dominates the bottom line:
| Metric | Unity Software Inc. (U) | Tyler Technologies, Inc. (TYL) |
|---|---|---|
| Revenue | 1.85B | 2.33B |
| Cost of Revenue | 478M | 1.25B |
| Operating Expenses | 1.85B | 670M |
| Gross Profit | 1.37B | 1.08B |
| EBITDA | -479M | 358M |
| EBIT | 0 | 0 |
| Interest Expense | -24M | -5M |
| Net Income | -403M | 316M |
| EPS | -0.96 | 7.32 |
| Fiscal Year | 2025 | 2025 |
Income Statement Analysis: The Bottom-Line Duel
This income statement comparison reveals which company best converts revenue into profit through operational efficiency and margin management.
Unity Software Inc. Analysis
Unity’s revenue climbs steadily to $1.85B in 2025, showing 67% growth since 2021. Gross margin remains healthy at 74%, indicating strong product value. Net income, however, stays negative at -$403M in 2025 but shows improvement, reflecting narrowing losses and better operational control.
Tyler Technologies, Inc. Analysis
Tyler posts $2.33B revenue in 2025, growing 46% since 2021 with a solid gross margin near 46%. Its net income reaches $316M, a robust profit with a 13.5% net margin. Despite a one-year EBIT dip, Tyler sustains positive momentum and consistent profitability.
Margin Strength vs. Profitability Scale
Unity excels in gross margin and revenue growth but struggles with net losses, highlighting investment in growth over immediate profits. Tyler balances respectable gross margins with strong net income and margin expansion. For investors, Tyler’s consistent profitability offers a more attractive risk-return profile compared to Unity’s growth-at-a-losses approach.
Financial Ratios Comparison
These vital ratios act as a diagnostic tool to expose the underlying fiscal health, valuation premiums, and capital efficiency of the companies compared:
| Ratios | Unity Software Inc. (U) | Tyler Technologies, Inc. (TYL) |
|---|---|---|
| ROE | -12.44% | 7.76% |
| ROIC | -8.16% | 6.20% |
| P/E | -46.16 | 61.99 |
| P/B | 5.74 | — |
| Current Ratio | 1.84 | — |
| Quick Ratio | 1.84 | — |
| D/E | 0.69 | — |
| Debt-to-Assets | 32.69% | — |
| Interest Coverage | 19.95 | -71.61 |
| Asset Turnover | 0.27 | — |
| Fixed Asset Turnover | 27.09 | — |
| Payout ratio | 0 | 0 |
| Dividend yield | 0 | 0 |
| Fiscal Year | 2025 | 2025 |
Efficiency & Valuation Duel: The Vital Signs
Financial ratios act as a company’s DNA, exposing hidden risks and revealing operational excellence behind the numbers.
Unity Software Inc.
Unity reveals negative profitability metrics with a -12.44% ROE and a -21.78% net margin, signaling operational struggles. Its P/E ratio is negative but paired with a high P/B of 5.74, suggesting a stretched valuation. Unity pays no dividend, heavily reinvesting in R&D at over 50% of revenue to fuel growth.
Tyler Technologies, Inc.
Tyler posts a positive 13.53% net margin but lacks a reported ROE, complicating profitability assessment. The stock trades at a high P/E of 61.99, indicating an expensive valuation. Despite no dividend, Tyler maintains prudent capital structure metrics and modest reinvestment in R&D at under 9%, reflecting steady operational discipline.
Valuation Stretch vs. Growth Investment Balance
Unity struggles with negative returns and stretched valuation despite deep R&D focus, while Tyler shows healthier margins but trades at a premium. Tyler’s profile suits investors seeking operational safety, whereas Unity fits those prioritizing aggressive growth and innovation risk.
Which one offers the Superior Shareholder Reward?
I observe that neither Unity Software Inc. (U) nor Tyler Technologies, Inc. (TYL) pays dividends, so shareholder rewards rely on capital gains and buybacks. Unity focuses heavily on reinvestment, reflected in negative net margins and no buyback signals. Tyler posts positive net margins (~13.5% in 2025) and generates strong free cash flow per share (~$14.8B), supporting a modest buyback program implied by low debt ratios and stable leverage. Historically, Tyler’s distribution model prioritizes sustainable growth with moderate capital allocation to buybacks, contrasting Unity’s aggressive growth-at-all-costs approach. I conclude Tyler offers a more attractive and sustainable total return profile for 2026 investors due to its consistent profitability and disciplined capital allocation.
Comparative Score Analysis: The Strategic Profile
The radar chart reveals the fundamental DNA and trade-offs of both firms across key financial dimensions:
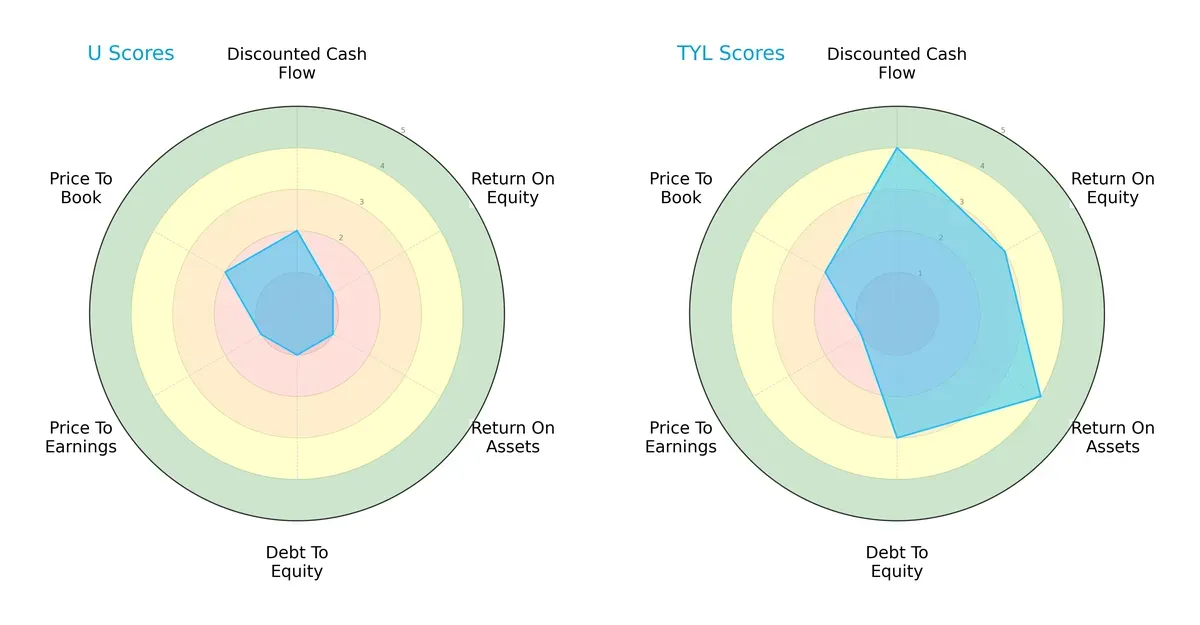
Tyler Technologies commands a more balanced profile, excelling in DCF (4), ROA (4), and moderate debt management (3). Unity Software struggles with very unfavorable scores in ROE (1), ROA (1), and debt-to-equity (1), indicating operational inefficiency and financial risk. Tyler relies on steady asset utilization and cash flow, while Unity depends heavily on a weak valuation edge (P/B at 2) without operational strength.
Bankruptcy Risk: Solvency Showdown
The Altman Z-Score gap signals starkly different survival prospects in this cycle:
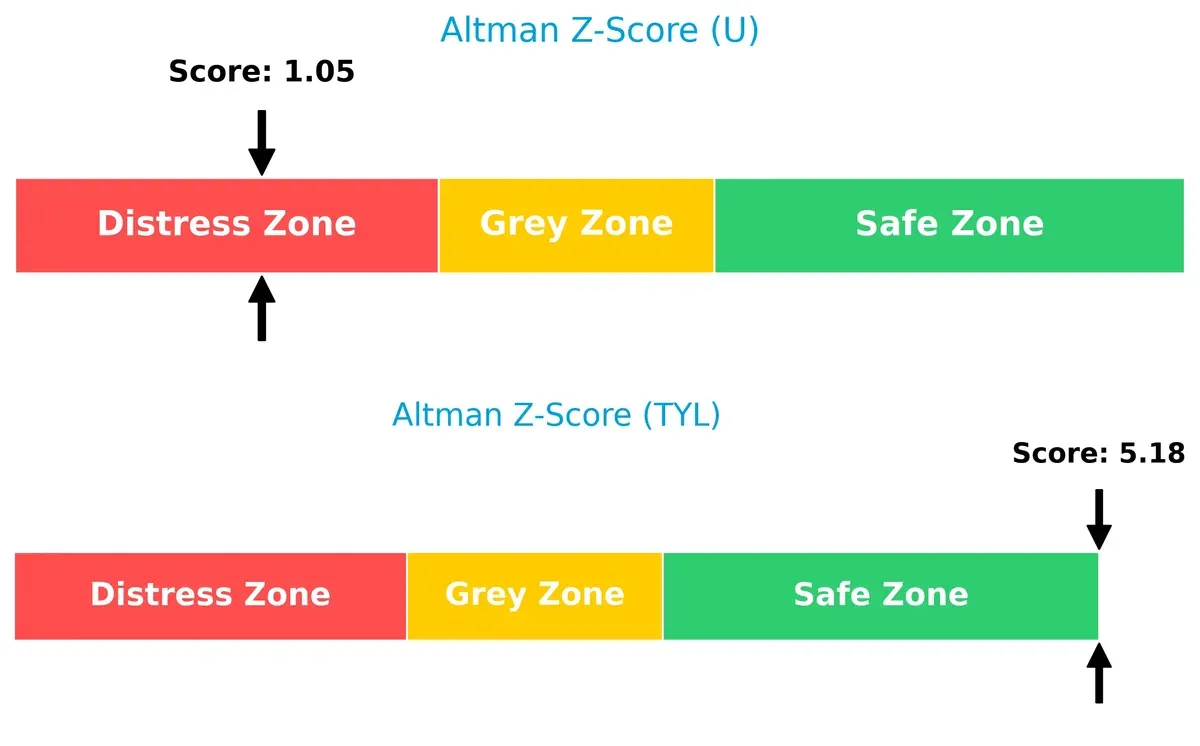
Tyler Technologies scores 5.18, placing it firmly in the safe zone, reflecting robust solvency and low bankruptcy risk. Unity Software’s 1.05 signals distress, flagging high default probability if current trends persist.
Financial Health: Quality of Operations
Piotroski F-Scores offer insight into internal financial quality and operational rigor:
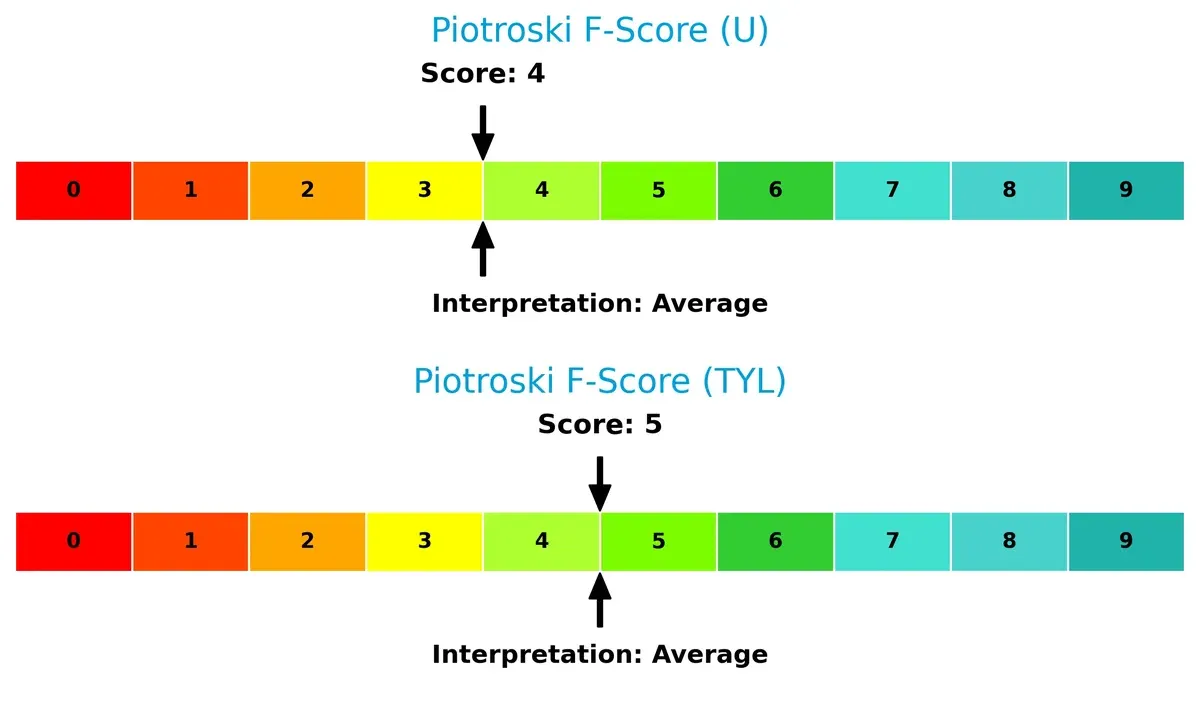
Both firms post average scores—Tyler at 5 and Unity at 4—indicating moderate financial health. Unity’s slightly lower score suggests potential red flags in profitability or liquidity compared to Tyler’s steadier performance. Neither demonstrates peak financial strength, warranting cautious monitoring.
How are the two companies positioned?
This section dissects the operational DNA of Unity and Tyler by comparing their revenue distribution and internal dynamics. The goal is to confront their economic moats to identify which model offers the most resilient competitive advantage today.
Revenue Segmentation: The Strategic Mix
The following visual comparison dissects how Unity Software Inc. and Tyler Technologies, Inc. diversify their income streams and where their primary sector bets lie:
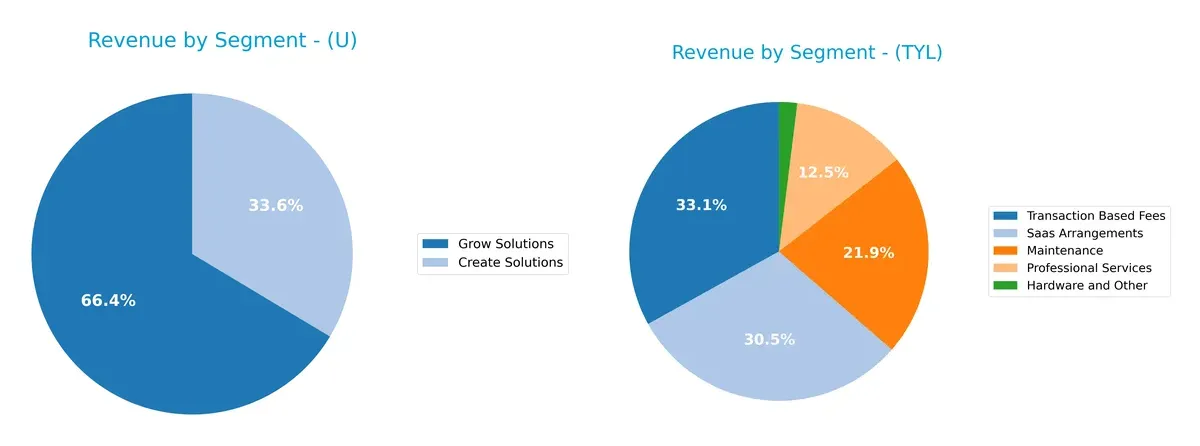
Unity Software anchors revenue in two segments: Create Solutions at $621M and Grow Solutions at $1.23B in 2025, showing moderate diversification. Tyler Technologies presents a broader mix in 2024, spanning Hardware ($41M), Professional Services ($264M), Maintenance ($463M), SaaS Arrangements ($645M), and Transaction Based Fees ($698M). Tyler’s diversified portfolio reduces concentration risk, while Unity’s focus pivots on platform growth, implying ecosystem lock-in potential.
Strengths and Weaknesses Comparison
This table compares the strengths and weaknesses of Unity Software Inc. and Tyler Technologies, Inc.:
Unity Software Inc. Strengths
- Diversified revenue streams across Create and Grow Solutions
- Solid global presence with significant sales in EMEA and Asia Pacific
- Favorable current and quick ratios indicating liquidity
- High fixed asset turnover showing efficient use of assets
Tyler Technologies, Inc. Strengths
- Diversified revenue in Hardware, Professional Services, Maintenance, SaaS, and Transaction Fees
- Strong balance sheet with zero debt to equity and debt to assets
- Favorable price-to-book ratio suggesting undervaluation
Unity Software Inc. Weaknesses
- Negative net margin, ROE, and ROIC indicating unprofitability
- Unfavorable interest coverage and asset turnover ratios
- Higher price-to-book ratio may indicate overvaluation
- No dividend yield
Tyler Technologies, Inc. Weaknesses
- Unavailable WACC complicates cost of capital analysis
- Unfavorable net margin and profitability metrics
- Poor liquidity with zero current and quick ratios
- Negative interest coverage and asset turnover ratios
- No dividend yield
Overall, Unity shows strengths in global diversification and liquidity but suffers from profitability issues. Tyler benefits from a strong capital structure and diversified products but faces liquidity and profitability challenges. Each company’s strategic focus must address these distinct financial profiles.
The Moat Duel: Analyzing Competitive Defensibility
A structural moat is the only reliable shield protecting long-term profits from relentless competition erosion. Let’s break down the moats of two software firms:
Unity Software Inc.: Network Effects Driving Platform Dominance
Unity’s competitive edge stems from powerful network effects, with a vast developer ecosystem cementing its platform status. This generates solid gross margins (74%) despite current profitability challenges. Expansion into AR/VR markets in 2026 could deepen this moat or face disruption.
Tyler Technologies, Inc.: Intangible Assets Anchored in Public Sector Specialization
Tyler’s moat relies on intangible assets—specialized public sector software and regulatory expertise—yielding consistent net margins (13.5%) and stable revenue growth. Unlike Unity, Tyler’s niche focus limits scale but secures recurring contracts, with cloud migration offering growth avenues in 2026.
Network Effects vs. Intangible Assets: The Moat Battle
Unity boasts a wider moat through its expansive ecosystem, but its negative ROIC versus WACC flags value destruction risk. Tyler’s narrower moat delivers steady profitability and value creation, better equipped to defend market share amid sector volatility. I see Tyler as the more resilient defender today.
Which stock offers better returns?
Over the past year, both Unity Software Inc. and Tyler Technologies, Inc. showed significant price declines, with intensified selling pressure and decelerating downward trends.
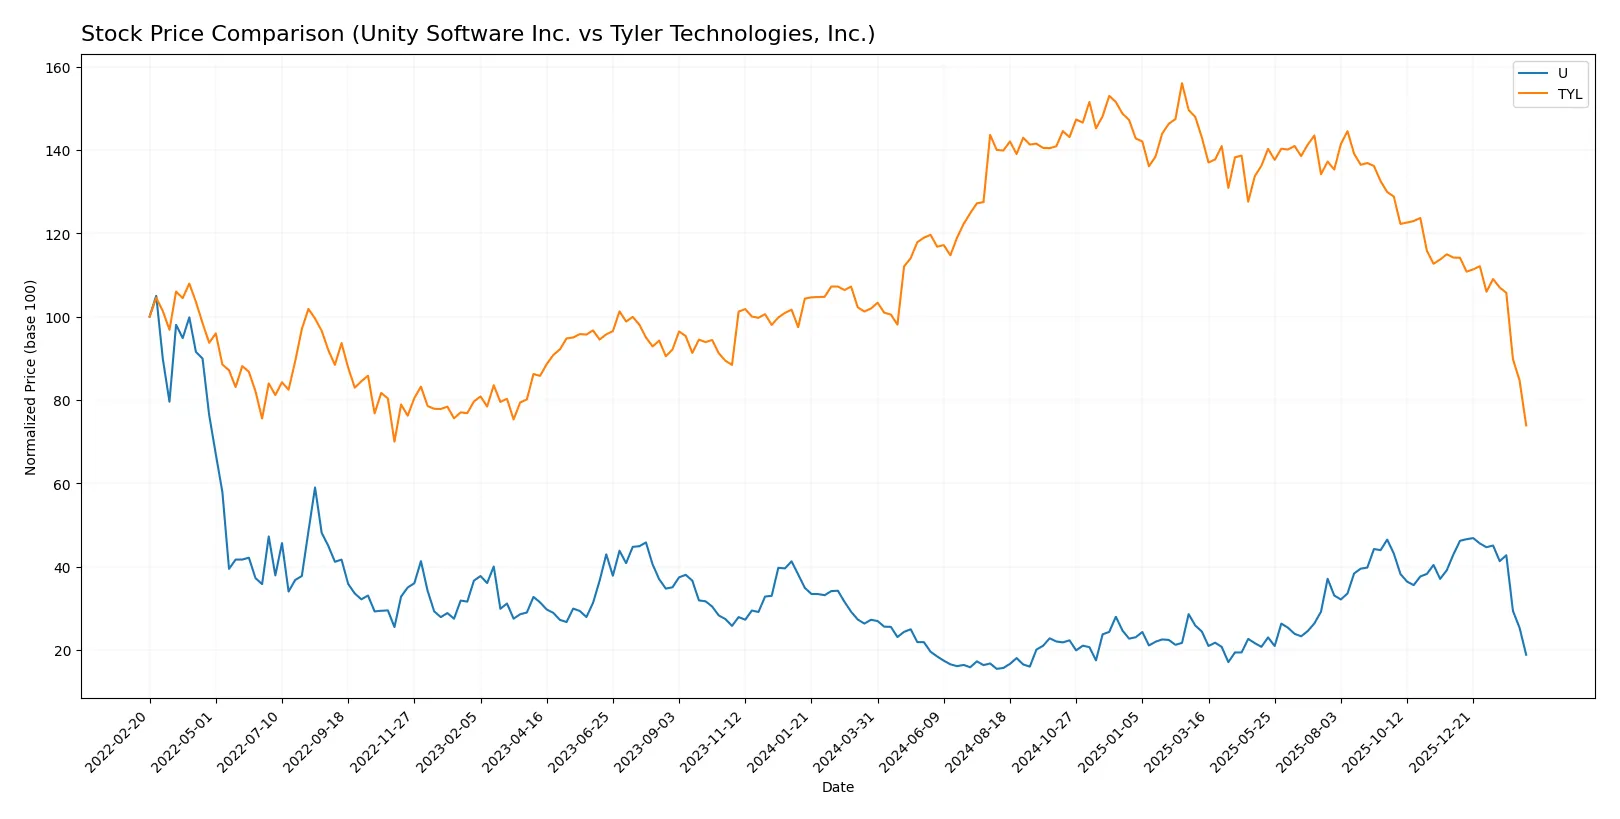
Trend Comparison
Unity Software’s stock fell 30.79% over the last 12 months, marking a bearish trend with decelerating losses. The price ranged between $15.32 and $46.42, showing moderate volatility (9.2% std deviation).
Tyler Technologies declined 27.51% in the same period, also bearish with deceleration. Its price fluctuated widely from $303.94 to $641.70, reflecting high volatility (68.01% std deviation).
Unity’s steeper decline and lower volatility contrast with Tyler’s less severe drop but higher price swings. Unity delivered the weakest market performance over the year.
Target Prices
Analysts present a broad consensus on target prices for Unity Software Inc. and Tyler Technologies, Inc.
| Company | Target Low | Target High | Consensus |
|---|---|---|---|
| Unity Software Inc. | 26 | 60 | 37.7 |
| Tyler Technologies, Inc. | 325 | 675 | 473.91 |
The consensus target for Unity Software stands well above its current price of 18.68, signaling strong upside potential. Tyler Technologies’ consensus target also suggests significant room to grow from the current 303.94 price.

Don’t Let Luck Decide Your Entry Point
Optimize your entry points with our advanced ProRealTime indicators. You’ll get efficient buy signals with precise price targets for maximum performance. Start outperforming now!
How do institutions grade them?
Unity Software Inc. Grades
Here are the latest institutional grades for Unity Software Inc.:
| Grading Company | Action | New Grade | Date |
|---|---|---|---|
| Goldman Sachs | Maintain | Neutral | 2026-02-12 |
| BTIG | Maintain | Buy | 2026-02-12 |
| Needham | Maintain | Buy | 2026-02-12 |
| Wells Fargo | Maintain | Overweight | 2026-02-12 |
| Wedbush | Maintain | Outperform | 2026-02-12 |
| Macquarie | Maintain | Outperform | 2026-02-12 |
| UBS | Maintain | Neutral | 2026-02-12 |
| Citigroup | Maintain | Buy | 2026-02-12 |
| Barclays | Maintain | Equal Weight | 2026-02-12 |
| Citizens | Maintain | Market Outperform | 2026-02-12 |
Tyler Technologies, Inc. Grades
Below are the most recent grades for Tyler Technologies, Inc.:
| Grading Company | Action | New Grade | Date |
|---|---|---|---|
| Oppenheimer | Maintain | Outperform | 2026-02-13 |
| Piper Sandler | Maintain | Overweight | 2026-02-13 |
| Needham | Maintain | Buy | 2026-02-13 |
| TD Cowen | Maintain | Buy | 2026-02-13 |
| Evercore ISI Group | Maintain | In Line | 2026-02-13 |
| Wells Fargo | Maintain | Equal Weight | 2026-02-13 |
| Barclays | Maintain | Overweight | 2026-02-13 |
| Stifel | Maintain | Buy | 2026-02-13 |
| DA Davidson | Upgrade | Buy | 2026-02-11 |
| BTIG | Maintain | Buy | 2026-02-09 |
Which company has the best grades?
Tyler Technologies generally holds stronger buy and outperform ratings with recent upgrades, suggesting higher institutional confidence. Unity Software also receives positive grades but with a wider spread including neutral and equal weight ratings. This divergence may affect investor sentiment and portfolio positioning.
Risks specific to each company
The following categories identify the critical pressure points and systemic threats facing Unity Software Inc. and Tyler Technologies, Inc. in the 2026 market environment:
1. Market & Competition
Unity Software Inc.
- Faces intense competition in interactive 3D software from established tech giants and emerging startups.
Tyler Technologies, Inc.
- Operates in niche public sector software with less direct competition but slower growth dynamics.
2. Capital Structure & Debt
Unity Software Inc.
- Moderate debt levels (D/E 0.69) but struggles with negative interest coverage, signaling financial stress.
Tyler Technologies, Inc.
- Shows very low to no debt, indicating a conservative capital structure and stronger balance sheet stability.
3. Stock Volatility
Unity Software Inc.
- High beta (2.085) reflects significant price volatility against the market, increasing risk for investors.
Tyler Technologies, Inc.
- Low beta (0.897) suggests more stable stock price behavior relative to the broader market.
4. Regulatory & Legal
Unity Software Inc.
- Subject to evolving software content and data privacy regulations across multiple global markets.
Tyler Technologies, Inc.
- Faces regulatory scrutiny linked to public sector contracts and compliance, but with fewer international complexities.
5. Supply Chain & Operations
Unity Software Inc.
- Relies on cloud infrastructure and global digital delivery, vulnerable to tech service disruptions.
Tyler Technologies, Inc.
- Operations focused on integrated software services with more controlled supply chains and stable client base.
6. ESG & Climate Transition
Unity Software Inc.
- Pressure to improve energy efficiency in data centers and reduce carbon footprint in digital operations.
Tyler Technologies, Inc.
- Increasing demand for transparency and sustainability in public sector software solutions, with moderate ESG risks.
7. Geopolitical Exposure
Unity Software Inc.
- Diverse international presence exposes it to geopolitical tensions and trade restrictions.
Tyler Technologies, Inc.
- Primarily US-focused business minimizes exposure to geopolitical risks but may face federal budget constraints.
Which company shows a better risk-adjusted profile?
Unity Software’s most pressing risk is its fragile financial health, marked by negative profitability and distress-level Altman Z-score. Tyler Technologies contends with valuation concerns and moderate growth but benefits from a robust balance sheet and safer Altman Z-score. Tyler offers a superior risk-adjusted profile, underscored by lower volatility and stronger financial stability. Recent data confirm Unity’s distress zone Z-score at 1.05, highlighting heightened bankruptcy risk, while Tyler’s 5.18 score signals safety, justifying cautious preference for Tyler in 2026.
Final Verdict: Which stock to choose?
Unity Software’s superpower lies in its rapidly improving profitability and innovation-driven growth. Despite current value destruction, its expanding ROIC indicates potential future economic gains. A point of vigilance is its ongoing net losses and balance sheet stress. It suits aggressive growth portfolios willing to embrace volatility.
Tyler Technologies commands a strategic moat through its specialized government software niche and stable recurring revenues. Its better financial stability and solid free cash flow provide a safer harbor compared to Unity. This makes it appealing for GARP investors seeking steady growth with reasonable risk.
If you prioritize aggressive innovation and turnaround potential, Unity outshines with its accelerating profitability trend despite current challenges. However, if you seek better stability and consistent cash generation, Tyler offers a more reliable profile for conservative growth strategies. Both require careful risk assessment given their bearish recent price trends.
Disclaimer: Investment carries a risk of loss of initial capital. The past performance is not a reliable indicator of future results. Be sure to understand risks before making an investment decision.
Go Further
I encourage you to read the complete analyses of Unity Software Inc. and Tyler Technologies, Inc. to enhance your investment decisions: