Home > Comparison > Technology > UBER vs TYL
The strategic rivalry between Uber Technologies, Inc. and Tyler Technologies, Inc. shapes innovation within the technology sector. Uber operates a dynamic, global platform connecting consumers with mobility and delivery services, emphasizing scalable network effects. Tyler Technologies delivers specialized, high-margin software solutions tailored to public sector clients, focusing on stable recurring revenue. This analysis evaluates which operational model offers superior risk-adjusted returns, guiding investors seeking durable growth and resilience in their portfolios.
Table of contents
Companies Overview
Uber Technologies and Tyler Technologies dominate distinct niches within the software application industry.
Uber Technologies, Inc.: Global Mobility and Delivery Powerhouse
Uber commands the ride-sharing ecosystem by connecting consumers with independent drivers globally. It generates revenue mainly through its Mobility, Delivery, and Freight segments, facilitating transportation, food, and goods delivery. In 2026, Uber emphasizes expanding its platform capabilities and financial partnerships to fortify its competitive advantage in urban mobility and logistics.
Tyler Technologies, Inc.: Public Sector Software Specialist
Tyler Technologies leads in integrated public sector software solutions, streamlining government and educational operations. Its revenue stems from modular software in financial management, judicial systems, and tax administration. In 2026, Tyler prioritizes cloud collaboration with AWS, enhancing its scalable SaaS offerings to support complex public sector workflows efficiently.
Strategic Collision: Similarities & Divergences
Both firms operate in software but diverge sharply: Uber pursues a consumer-centric, platform-driven model, while Tyler focuses on a niche B2G software ecosystem. Their battlegrounds differ—Uber competes in dynamic urban markets; Tyler in long-term government contracts. This contrast shapes their distinct risk profiles and growth trajectories, reflecting unique investment considerations in technology infrastructure versus marketplace facilitation.
Income Statement Comparison
This data dissects the core profitability and scalability of both corporate engines to reveal who dominates the bottom line:
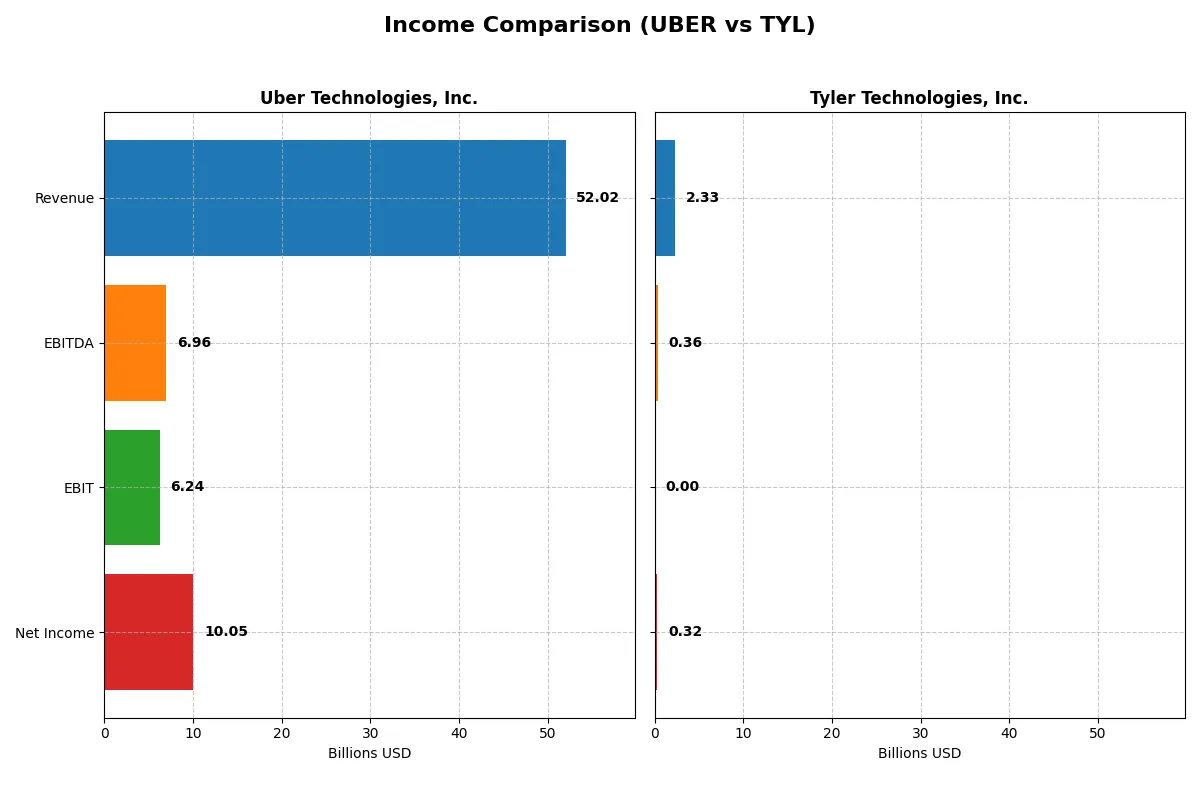
| Metric | Uber Technologies, Inc. (UBER) | Tyler Technologies, Inc. (TYL) |
|---|---|---|
| Revenue | 52.0B | 2.3B |
| Cost of Revenue | 31.3B | 1.2B |
| Operating Expenses | 15.1B | 670M |
| Gross Profit | 20.7B | 1.1B |
| EBITDA | 7.0B | 358M |
| EBIT | 6.2B | 0 |
| Interest Expense | 440M | 5M |
| Net Income | 10.1B | 316M |
| EPS | 4.82 | 7.32 |
| Fiscal Year | 2025 | 2025 |
Income Statement Analysis: The Bottom-Line Duel
This income statement comparison reveals which company runs a more efficient and profitable business engine through recent financial performance.
Uber Technologies, Inc. Analysis
Uber’s revenue soared from 17.5B in 2021 to 52B in 2025, with net income exploding from -496M to 10B. Gross margin improved to 39.75%, sustaining solid profitability. Despite a slight net margin dip last year, Uber’s 2025 figures show strong operating leverage and accelerating EBIT growth, signaling robust momentum.
Tyler Technologies, Inc. Analysis
Tyler’s revenue grew steadily from 1.59B in 2021 to 2.33B in 2025, with net income nearly doubling to 316M. Gross margin holds a healthy 46.46%, but EBIT margin remains at zero due to rising operating expenses. The latest year shows solid net margin expansion and EPS growth, though operating income stalled, reflecting efficiency challenges.
Margin Expansion vs. Revenue Scaling
Uber dominates with explosive top-line and bottom-line growth, leveraging scale to expand operating profit margins sharply. Tyler delivers consistent revenue gains and superior gross margin but struggles to convert this into EBIT growth. For investors, Uber’s profile offers dynamic profit acceleration, while Tyler reflects steady but constrained earnings expansion.
Financial Ratios Comparison
These vital ratios act as a diagnostic tool to expose the underlying fiscal health, valuation premiums, and capital efficiency of the companies compared below:
| Ratios | Uber Technologies, Inc. (UBER) | Tyler Technologies, Inc. (TYL) |
|---|---|---|
| ROE | 37.18% | 0% |
| ROIC | 11.21% | 0% |
| P/E | 16.85 | 61.99 |
| P/B | 6.27 | 0 |
| Current Ratio | 1.14 | 0 |
| Quick Ratio | 1.14 | 0 |
| D/E | 0.50 | 0 |
| Debt-to-Assets | 21.80% | 0% |
| Interest Coverage | 12.65 | -71.61 |
| Asset Turnover | 0.84 | 0 |
| Fixed Asset Turnover | 17.28 | 0 |
| Payout Ratio | 0% | 0% |
| Dividend Yield | 0% | 0% |
| Fiscal Year | 2025 | 2025 |
Efficiency & Valuation Duel: The Vital Signs
Financial ratios serve as a company’s DNA, unveiling hidden operational strengths and risks beyond surface-level numbers.
Uber Technologies, Inc.
Uber delivers robust profitability with a 37.18% ROE and a strong 19.33% net margin, signaling operational efficiency. Its P/E of 16.85 suggests a fairly valued stock, though a 6.27 PB ratio appears stretched. Uber retains earnings to fuel growth, compensating for a zero dividend yield, reflecting a reinvestment strategy in innovation and expansion.
Tyler Technologies, Inc.
Tyler reports a modest 13.53% net margin but a concerning zero ROE and ROIC, indicating weak profitability versus capital employed. The P/E stands high at 61.99, marking an expensive valuation. Lack of dividends and unfavorable liquidity ratios point to potential financial stress. Favorable debt metrics coexist with operational inefficiencies, signaling caution.
Balanced Profitability vs. Stretched Valuation
Uber offers superior profitability and operational efficiency at a reasonable valuation, contrasting sharply with Tyler’s expensive multiples and weaker returns. Investors seeking growth with solid fundamentals might lean toward Uber. Tyler’s profile fits those willing to accept valuation risk amid uncertain capital returns.
Which one offers the Superior Shareholder Reward?
I compare Uber Technologies, Inc. (UBER) and Tyler Technologies, Inc. (TYL) based on their distribution strategies, dividend yields, payout ratios, and share buyback intensity. Neither company pays dividends, focusing instead on reinvestment and buybacks. Uber’s 2025 free cash flow per share stands at $4.71 with zero dividend payout, showing no direct shareholder distribution. Buybacks remain modest, suggesting reinvestment in growth. Tyler posts a much higher free cash flow per share of $14.79, also with no dividends, but executes more aggressive buybacks, enhancing shareholder value via share count reduction. Tyler’s superior operating margin (15.3% vs. Uber’s 10.7%) and consistent free cash flow coverage (97.5%) underpin a sustainable buyback model. Uber’s lower margin and higher leverage risk its capacity to maintain buybacks at scale. I conclude Tyler offers the more attractive total return profile in 2026, balancing robust cash flow, efficient capital allocation, and shareholder-friendly buybacks.
Comparative Score Analysis: The Strategic Profile
The radar chart reveals the fundamental DNA and trade-offs of Uber Technologies, Inc. and Tyler Technologies, Inc., highlighting their strategic strengths and vulnerabilities:
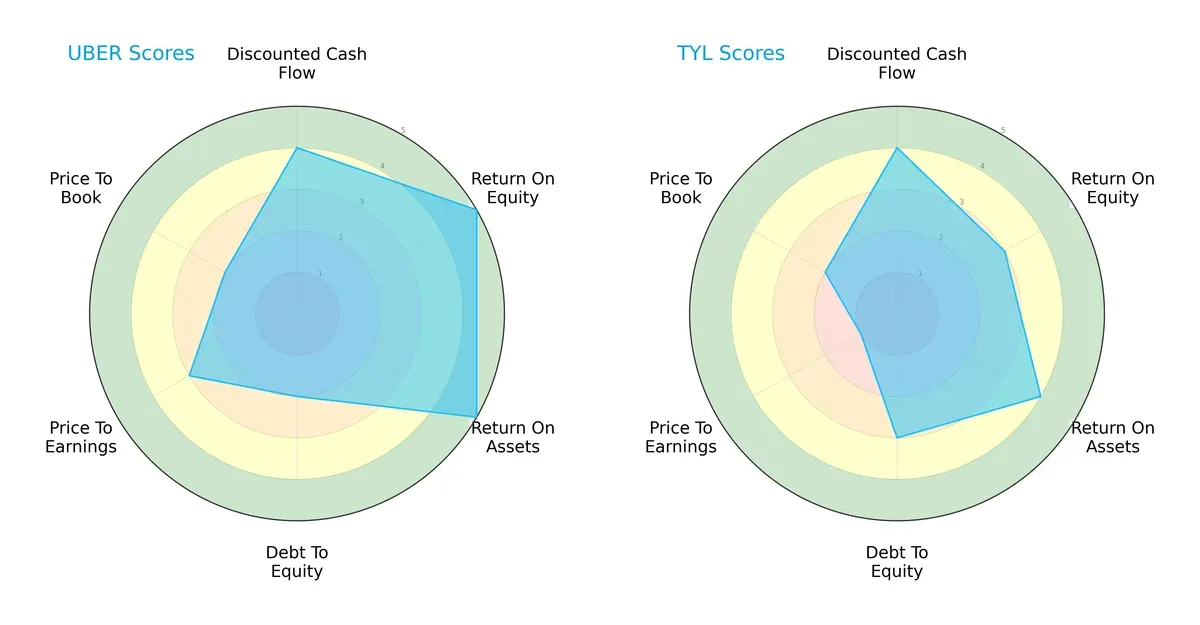
Uber dominates in profitability metrics with top-tier ROE (5) and ROA (5) scores, reflecting superior asset and equity efficiency. Tyler maintains a more balanced debt-to-equity profile (3 vs. Uber’s 2) but lags in valuation attractiveness, scoring very low in P/E (1). Uber’s weaker debt-to-equity and price-to-book scores suggest higher financial leverage and premium valuation risks. Overall, Uber leverages a strong profit engine with financial risk, while Tyler presents a steadier but less aggressive profile.
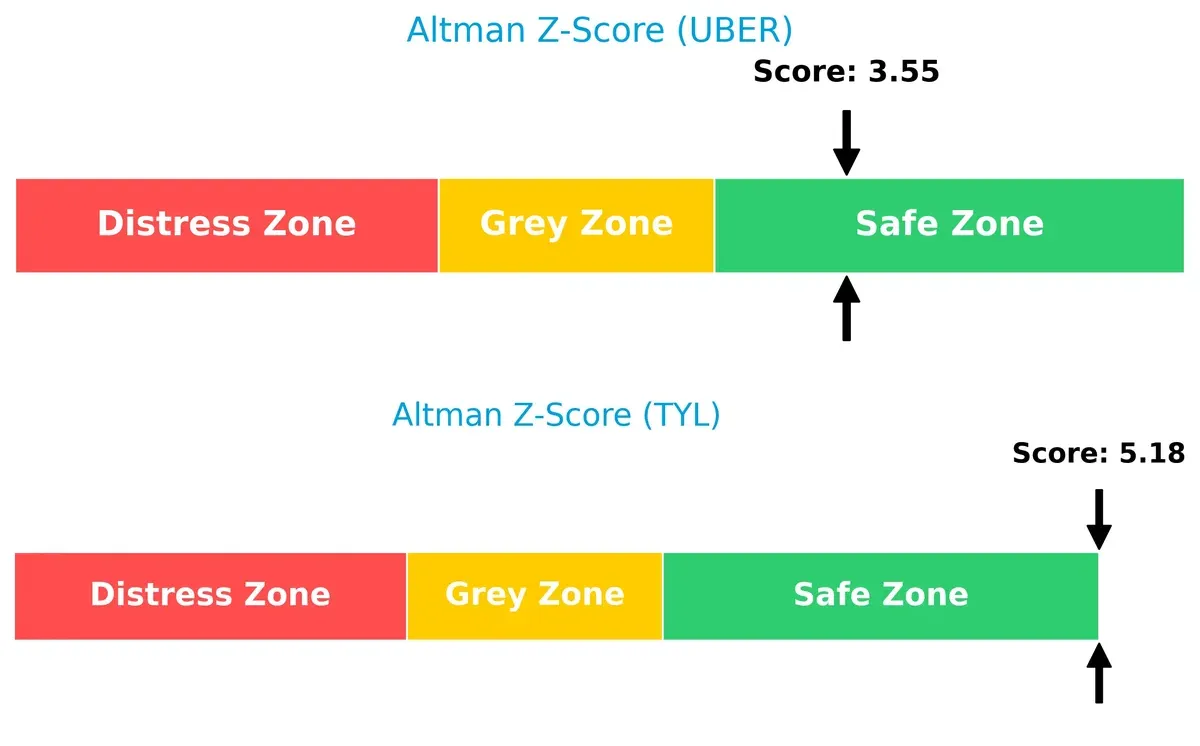
Bankruptcy Risk: Solvency Showdown
Uber’s Altman Z-Score of 3.55 trails Tyler’s stronger 5.18, both safely above the distress threshold, signaling robust solvency but with Tyler better insulated from long-term financial stress:
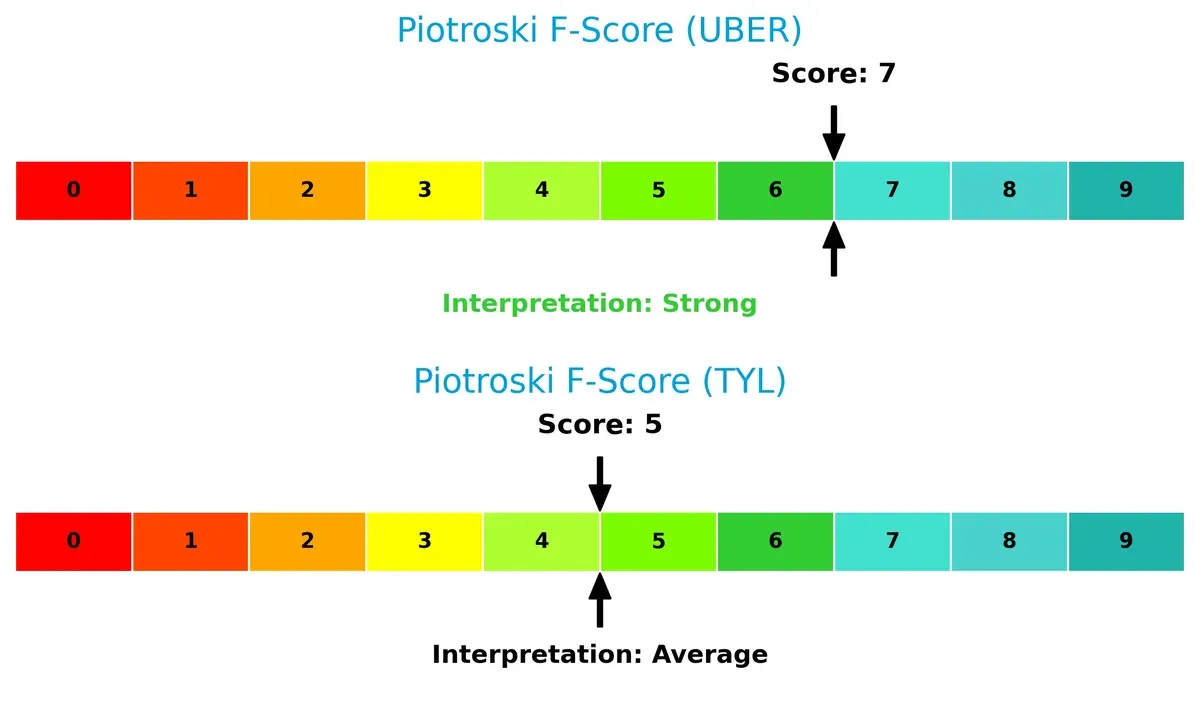
Financial Health: Quality of Operations
Uber’s Piotroski F-Score of 7 surpasses Tyler’s 5, indicating Uber’s operations deliver stronger internal financial health and efficiency. Tyler’s moderate score signals caution on operational metrics:
How are the two companies positioned?
This section dissects Uber and Tyler’s operational DNA by comparing their revenue distribution and internal dynamics. The goal is to confront their economic moats and identify which model offers the most resilient competitive advantage today.
Revenue Segmentation: The Strategic Mix
This comparison dissects how Uber Technologies, Inc. and Tyler Technologies, Inc. diversify their income streams and reveals their primary sector bets:
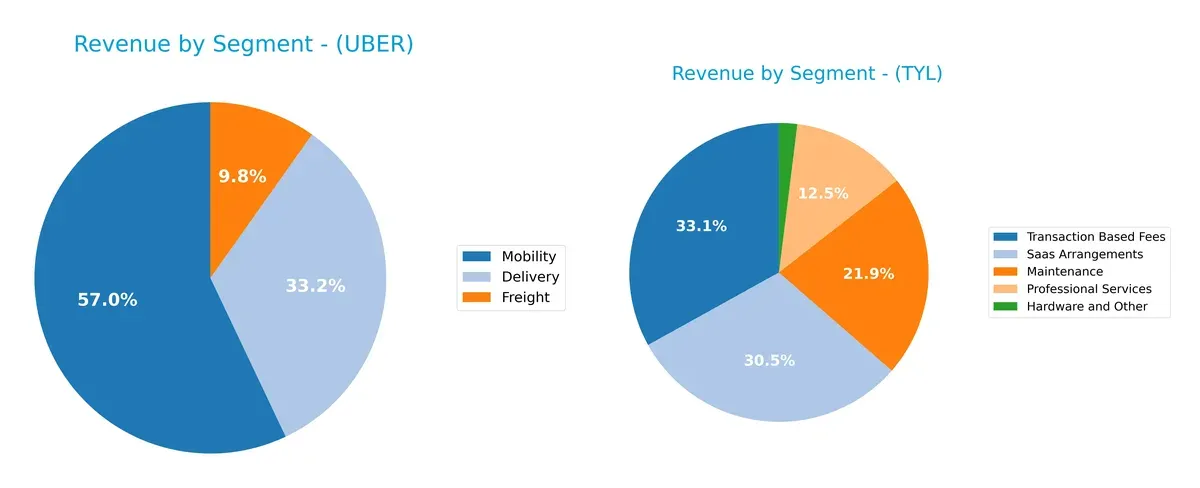
Uber’s revenue pivots heavily on Mobility at $29.7B, dwarfing Delivery at $17.2B and Freight at $5.1B in 2025. This indicates concentrated exposure to ride-hailing demand. Tyler shows a more diversified mix with Enterprise Software leading at $1.37B and Platform Technologies at $595M in 2023, plus multiple smaller streams. Tyler’s spread reduces concentration risk, while Uber leans on ecosystem lock-in in urban transport.
Strengths and Weaknesses Comparison
This table compares the strengths and weaknesses of Uber Technologies, Inc. and Tyler Technologies, Inc.:
Uber Strengths
- Diversified revenue streams with Delivery, Freight, and Mobility segments
- Strong profitability with 19.33% net margin and 37.18% ROE
- Favorable leverage and interest coverage ratios
- Global presence across Americas, EMEA, and Asia Pacific
Tyler Strengths
- Favorable debt metrics with zero debt-to-assets ratio
- Positive net margin of 13.53%
- Diverse software and services offerings including SaaS and transaction fees
- Favorable price-to-book ratio indicating undervaluation
Uber Weaknesses
- High price-to-book ratio at 6.27 signals possible overvaluation
- Neutral current ratio at 1.14 reflects moderate liquidity
- No dividend yield limits income for shareholders
Tyler Weaknesses
- Unfavorable ROE and ROIC at zero indicating poor capital efficiency
- Unavailable WACC complicates cost of capital assessment
- Poor liquidity with zero current and quick ratios
- High P/E at 61.99 suggests expensive valuation
- Negative interest coverage ratio highlights financial risk
- Lack of geographic diversification
Uber’s strengths lie in its diversified business model and global reach, balanced with some valuation and liquidity concerns. Tyler shows financial conservatism but suffers from weak profitability and liquidity, which may constrain growth.
The Moat Duel: Analyzing Competitive Defensibility
A structural moat alone protects long-term profits from relentless competition erosion. Let’s dissect how Uber and Tyler Technologies defend their turf:
Uber Technologies, Inc.: Network Effects Powerhouse
Uber’s moat stems from powerful network effects connecting riders, drivers, and delivery services worldwide. This manifests in a strong ROIC outperforming WACC by 2.4%, signaling efficient capital use. Expanding freight and delivery markets in 2026 could deepen its competitive edge.
Tyler Technologies, Inc.: Specialized Public Sector Software Niche
Tyler’s moat relies on high switching costs embedded in government software contracts. Unlike Uber’s broad consumer base, Tyler’s niche focus stabilizes revenue but shows a declining ROIC trend, raising caution. Growth hinges on expanding SaaS offerings and cloud partnerships in 2026.
Uber’s Network Effects vs. Tyler’s Contractual Lock-in
Uber’s growing ROIC and diverse market reach create a wider and more sustainable moat. Tyler’s niche offers stability but a shrinking ROIC signals potential vulnerability. Uber is better positioned to defend and expand market share long-term.
Which stock offers better returns?
Both Uber Technologies, Inc. and Tyler Technologies, Inc. experienced notable price declines over the past year, with steady deceleration in their bearish trends and shifts in trading dynamics.
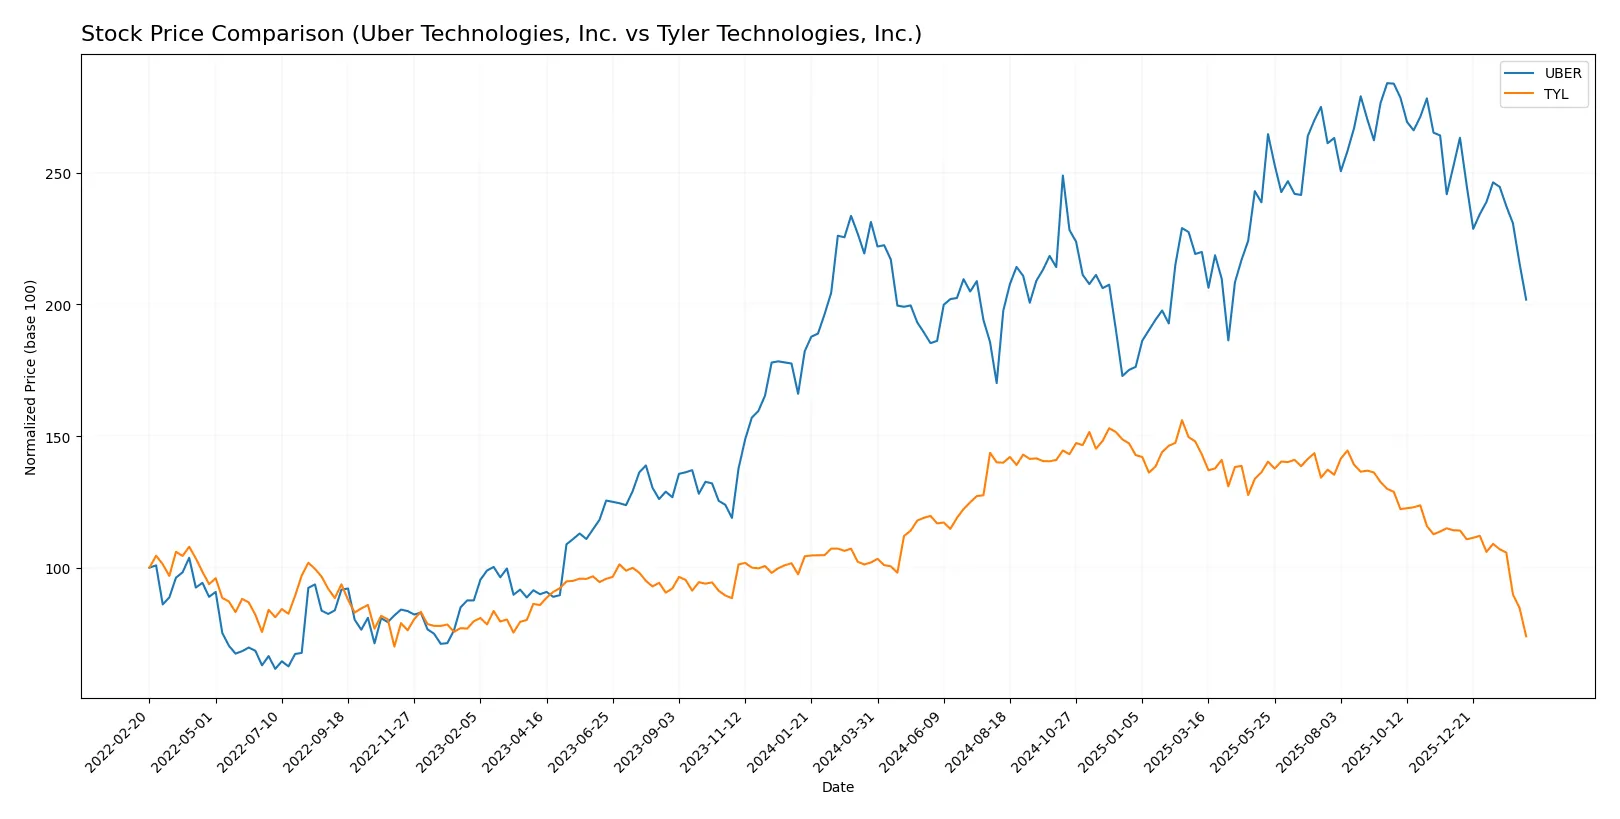
Trend Comparison
Uber’s stock price fell 12.76% over the past 12 months, signaling a bearish trend with decelerating losses. The price ranged between 59 and 98.5, showing moderate volatility at a 10.33 standard deviation.
Tyler Technologies’ stock dropped 27.51% over the same period, also bearish with decelerating momentum. The price fluctuated widely from 304 to 642, reflecting very high volatility at a 68.01 standard deviation.
Tyler’s steeper decline and greater volatility contrast with Uber’s milder drop. Uber delivered the higher market performance by a significant margin over the past year.
Target Prices
Analysts show a bullish consensus for both Uber Technologies, Inc. and Tyler Technologies, Inc.
| Company | Target Low | Target High | Consensus |
|---|---|---|---|
| Uber Technologies, Inc. | 72 | 140 | 105.76 |
| Tyler Technologies, Inc. | 325 | 675 | 473.91 |
Uber’s target consensus sits 51% above its current price, signaling strong upside potential. Tyler’s consensus more than doubles its present price, reflecting elevated growth expectations.

Don’t Let Luck Decide Your Entry Point
Optimize your entry points with our advanced ProRealTime indicators. You’ll get efficient buy signals with precise price targets for maximum performance. Start outperforming now!
How do institutions grade them?
Uber Technologies, Inc. Grades
The following table summarizes recent institutional grades for Uber Technologies, Inc.:
| Grading Company | Action | New Grade | Date |
|---|---|---|---|
| Citigroup | Maintain | Buy | 2026-02-06 |
| Morgan Stanley | Maintain | Overweight | 2026-02-05 |
| Wedbush | Maintain | Neutral | 2026-02-05 |
| Benchmark | Maintain | Hold | 2026-02-05 |
| JP Morgan | Maintain | Overweight | 2026-02-05 |
| Citizens | Upgrade | Market Outperform | 2026-02-05 |
| RBC Capital | Maintain | Outperform | 2026-02-05 |
| Wells Fargo | Maintain | Overweight | 2026-02-05 |
| Mizuho | Maintain | Outperform | 2026-02-05 |
| Needham | Maintain | Buy | 2026-02-05 |
Tyler Technologies, Inc. Grades
Below is a summary of recent institutional grades for Tyler Technologies, Inc.:
| Grading Company | Action | New Grade | Date |
|---|---|---|---|
| Oppenheimer | Maintain | Outperform | 2026-02-13 |
| Piper Sandler | Maintain | Overweight | 2026-02-13 |
| Needham | Maintain | Buy | 2026-02-13 |
| TD Cowen | Maintain | Buy | 2026-02-13 |
| Evercore ISI Group | Maintain | In Line | 2026-02-13 |
| Wells Fargo | Maintain | Equal Weight | 2026-02-13 |
| Barclays | Maintain | Overweight | 2026-02-13 |
| Stifel | Maintain | Buy | 2026-02-13 |
| DA Davidson | Upgrade | Buy | 2026-02-11 |
| BTIG | Maintain | Buy | 2026-02-09 |
Which company has the best grades?
Tyler Technologies shows a consistent pattern of Buy and Outperform ratings, including an upgrade from DA Davidson. Uber has a mix of Buy, Overweight, and Neutral grades with a single upgrade. Tyler’s grades suggest stronger institutional confidence, potentially attracting investors seeking growth signals.
Risks specific to each company
The following categories identify the critical pressure points and systemic threats facing both firms in the 2026 market environment:
1. Market & Competition
Uber Technologies, Inc.
- Operates in highly competitive, fast-evolving mobility and delivery markets globally. Faces pressure from new entrants and regulatory shifts.
Tyler Technologies, Inc.
- Focuses on public sector software, a niche with slower growth but less direct competition. Faces pressure from tech modernization demands.
2. Capital Structure & Debt
Uber Technologies, Inc.
- Maintains moderate leverage (D/E 0.5) with strong interest coverage (14.18), indicating healthy debt management.
Tyler Technologies, Inc.
- Shows no reported debt, suggesting conservative capital structure but limited financial leverage for growth.
3. Stock Volatility
Uber Technologies, Inc.
- Beta at 1.206 signals above-market volatility, typical for tech growth stocks sensitive to economic cycles.
Tyler Technologies, Inc.
- Beta at 0.897 indicates lower volatility, reflecting steady demand in public sector software.
4. Regulatory & Legal
Uber Technologies, Inc.
- Faces ongoing regulatory risks worldwide due to labor laws, data privacy, and platform compliance.
Tyler Technologies, Inc.
- Encounters regulatory scrutiny mostly related to government contracts and data security standards.
5. Supply Chain & Operations
Uber Technologies, Inc.
- Relies on gig workers and digital platforms, vulnerable to operational disruptions and labor disputes.
Tyler Technologies, Inc.
- Depends on software development and cloud hosting partnerships, exposed to tech infrastructure risks.
6. ESG & Climate Transition
Uber Technologies, Inc.
- Under pressure to reduce carbon footprint amid rising focus on sustainable urban mobility solutions.
Tyler Technologies, Inc.
- Faces ESG challenges linked to public sector transparency and sustainable IT practices.
7. Geopolitical Exposure
Uber Technologies, Inc.
- Operates globally, exposed to geopolitical instability, trade tensions, and regulatory divergence.
Tyler Technologies, Inc.
- Primarily U.S.-focused, limiting direct geopolitical risk but sensitive to domestic political cycles.
Which company shows a better risk-adjusted profile?
Uber’s main risk is regulatory and market competition across diverse global markets, demanding agile adaptation. Tyler’s key risk centers on weak financial ratios and operational reliance on government IT budgets. Uber’s higher leverage and volatility increase risk, but its favorable profitability and strong Altman Z-score indicate resilience. Tyler’s lack of debt reduces financial risk but poor liquidity and profitability metrics raise red flags. I see Uber offering a better risk-adjusted profile supported by strong operating metrics and a robust bankruptcy safety score, despite higher market volatility. Tyler’s financial fragility and valuation concerns justify caution.
Final Verdict: Which stock to choose?
Uber Technologies, Inc. impresses with its superpower of delivering scalable profitability through a growing and efficient capital base. Its expanding competitive moat signals durable value creation. A point of vigilance remains in its elevated price-to-book ratio, which could temper valuation appeal. Uber suits investors seeking aggressive growth with a tolerance for market swings.
Tyler Technologies, Inc. commands a strategic moat rooted in specialized software solutions for the public sector, offering resilient recurring revenue streams. It presents a relatively safer profile compared to Uber, though its valuation metrics appear stretched, suggesting caution. Tyler fits well within a Growth at a Reasonable Price (GARP) portfolio seeking steady business models.
If you prioritize dynamic growth fueled by operational efficiency and expanding economic profits, Uber is the compelling choice due to its sustainable competitive advantage and superior return on invested capital. However, if you seek stability with a focus on niche market dominance and recurring revenue, Tyler offers better steadiness despite a higher valuation premium. Each caters to distinct investor profiles mindful of risk and reward trade-offs.
Disclaimer: Investment carries a risk of loss of initial capital. The past performance is not a reliable indicator of future results. Be sure to understand risks before making an investment decision.
Go Further
I encourage you to read the complete analyses of Uber Technologies, Inc. and Tyler Technologies, Inc. to enhance your investment decisions: