In today’s fast-evolving technology landscape, selecting the right software company for your investment portfolio requires careful analysis. Tyler Technologies, Inc. (TYL) and monday.com Ltd. (MNDY) both operate in the software application industry, yet they target different niches—public sector management versus cloud-based work operating systems. This comparison explores their market positions and innovation strategies to help you identify which company offers the most compelling investment opportunity. Let’s dive in to find out which one suits your portfolio best.
Table of contents
Companies Overview
I will begin the comparison between Tyler Technologies and monday.com by providing an overview of these two companies and their main differences.
Tyler Technologies Overview
Tyler Technologies, Inc. focuses on providing integrated information management solutions tailored for the public sector. Its offerings include financial management, judicial solutions, public safety software, and property appraisal systems. Operating since 1966 and headquartered in Plano, Texas, Tyler collaborates with Amazon Web Services for cloud hosting and serves government agencies with a broad portfolio of modular and automated software applications.
monday.com Overview
monday.com Ltd. develops cloud-based work operating systems designed to offer modular software applications and work management tools. Headquartered in Tel Aviv, Israel, and founded in 2012, the company targets organizations across various sectors including education and government. monday.com’s platform supports diverse functions such as marketing, CRM, project management, and software development, emphasizing visual and customizable workflow solutions.
Key similarities and differences
Both companies operate in the software application industry and provide cloud-based solutions targeted at organizational management. Tyler Technologies specializes in public sector and government-focused software with a long-established presence and a comprehensive suite of integrated systems. In contrast, monday.com emphasizes flexible work operating systems across multiple business areas and maintains a more recent market presence with a focus on modular, visual tools for varied industries globally.
Income Statement Comparison
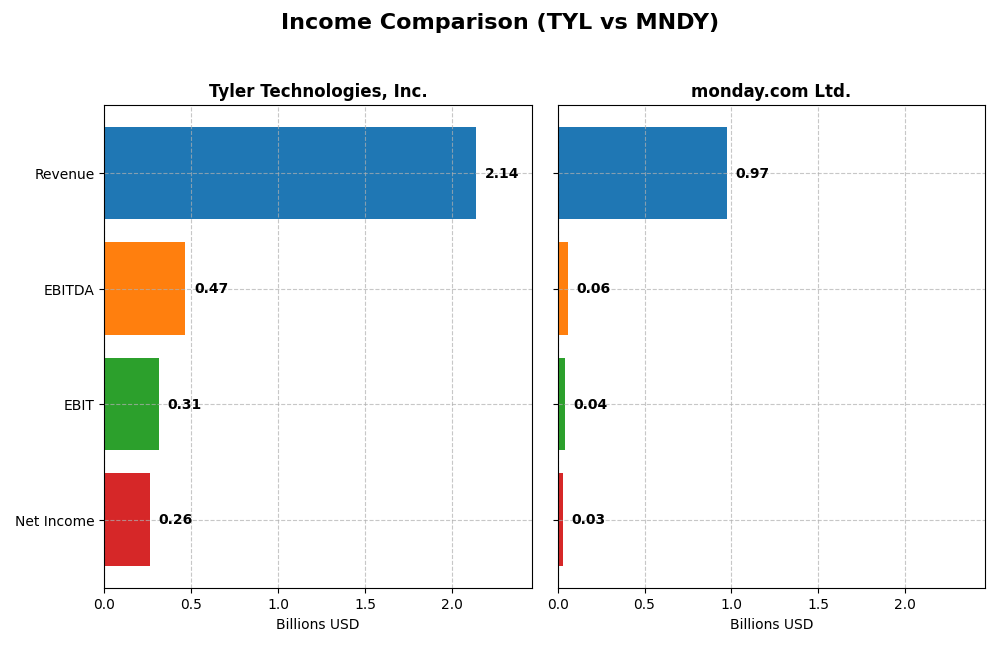
This table compares the key income statement metrics for Tyler Technologies, Inc. and monday.com Ltd. for the most recent fiscal year 2024.
| Metric | Tyler Technologies, Inc. | monday.com Ltd. |
|---|---|---|
| Market Cap | 18.9B | 6.5B |
| Revenue | 2.14B | 972M |
| EBITDA | 466M | 58M |
| EBIT | 314M | 40M |
| Net Income | 263M | 32M |
| EPS | 6.17 | 0.65 |
| Fiscal Year | 2024 | 2024 |
Income Statement Interpretations
Tyler Technologies, Inc.
Tyler Technologies showed a steady revenue increase from $1.11B in 2020 to $2.14B in 2024, with net income rising from $195M to $263M over the same period. Margins remained mostly stable, with a slight net margin dip overall but a strong rebound in 2024. The latest year marked a 9.53% revenue growth and a significant 44.73% improvement in net margin, signaling enhanced profitability.
monday.com Ltd.
monday.com experienced rapid revenue growth from $161M in 2020 to $972M in 2024, alongside a net income recovery from a loss of $152M to a positive $32M. Gross margin stayed high at 89.33%, but EBIT margin remained modest at 4.09%. The 2024 year saw a 33.21% revenue increase and a remarkable turnaround in net margin by 1394.74%, reflecting strong operational improvements.
Which one has the stronger fundamentals?
Tyler Technologies exhibits consistent profitability, favorable gross and EBIT margins, and solid income growth, though with a slight overall net margin contraction. monday.com demonstrates exceptional top-line expansion and margin recovery from losses, with favorable gross margin but still modest EBIT and net margins. Both companies present favorable income trends, but Tyler shows more stability while monday.com shows rapid growth and margin improvement.
Financial Ratios Comparison
Below is a comparison of key financial ratios for Tyler Technologies, Inc. (TYL) and monday.com Ltd. (MNDY) for the fiscal year 2024.
| Ratios | Tyler Technologies, Inc. (TYL) | monday.com Ltd. (MNDY) |
|---|---|---|
| ROE | 7.76% | 3.14% |
| ROIC | 6.20% | -1.73% |
| P/E | 93.42 | 363.0 |
| P/B | 7.25 | 11.41 |
| Current Ratio | 1.35 | 2.66 |
| Quick Ratio | 1.35 | 2.66 |
| D/E (Debt-to-Equity) | 0.19 | 0.10 |
| Debt-to-Assets | 12.32% | 6.29% |
| Interest Coverage | 50.50 | 0 |
| Asset Turnover | 0.41 | 0.58 |
| Fixed Asset Turnover | 10.95 | 7.13 |
| Payout ratio | 0 | 0 |
| Dividend yield | 0% | 0% |
Interpretation of the Ratios
Tyler Technologies, Inc.
Tyler Technologies shows a balanced ratio profile with 50% favorable and 35.7% unfavorable ratings. Strong points include a solid net margin of 12.3%, low debt-to-equity at 0.19, and excellent interest coverage at 52.96. However, the company faces concerns with a high PE ratio of 93.42 and low asset turnover of 0.41. Tyler pays no dividends, likely reinvesting earnings to support growth and operations.
monday.com Ltd.
monday.com exhibits a mixed ratio set with 42.86% favorable and 42.86% unfavorable ratios. The company benefits from a strong current ratio of 2.66, low debt-to-assets of 6.29%, and infinite interest coverage, indicating no interest expenses. Unfavorable metrics include a low net margin of 3.33%, negative ROIC, and a very high PE ratio of 362.98. monday.com does not pay dividends, focusing on reinvestment and expansion.
Which one has the best ratios?
Tyler Technologies holds a slightly favorable overall ratio stance with better profitability and leverage metrics, while monday.com presents a neutral profile with more mixed financial signals and weaker profitability. Tyler’s balance of favorable and unfavorable ratios suggests a more stable financial footing compared to monday.com’s higher uncertainty and risk indicators.
Strategic Positioning
This section compares the strategic positioning of Tyler Technologies and monday.com, including Market position, Key segments, and Exposure to technological disruption:
Tyler Technologies, Inc. (TYL)
- Established US public sector software provider with moderate beta, facing NYSE competition.
- Focused on integrated public sector solutions, including enterprise software, tax appraisal, and SaaS arrangements.
- Partners with Amazon Web Services for cloud hosting, indicating adoption of cloud tech to mitigate disruption.
monday.com Ltd. (MNDY)
- Emerging global SaaS provider on NASDAQ with higher beta and broader international presence.
- Concentrated on cloud-based Work OS, modular applications, and work management tools across sectors.
- Cloud-native SaaS platform inherently positioned to adapt to technological changes.
Tyler Technologies vs monday.com Positioning
Tyler Technologies offers diversified public sector software solutions with stable market presence, while monday.com focuses on a concentrated cloud-based platform serving various industries internationally. Tyler’s range may reduce risk, whereas monday.com’s specialization supports agility but may increase exposure to market shifts.
Which has the best competitive advantage?
Both companies are shedding value relative to their cost of capital. Tyler shows declining profitability and a very unfavorable moat, while monday.com has a slightly unfavorable moat with improving ROIC, suggesting a potentially strengthening competitive position despite current value destruction.
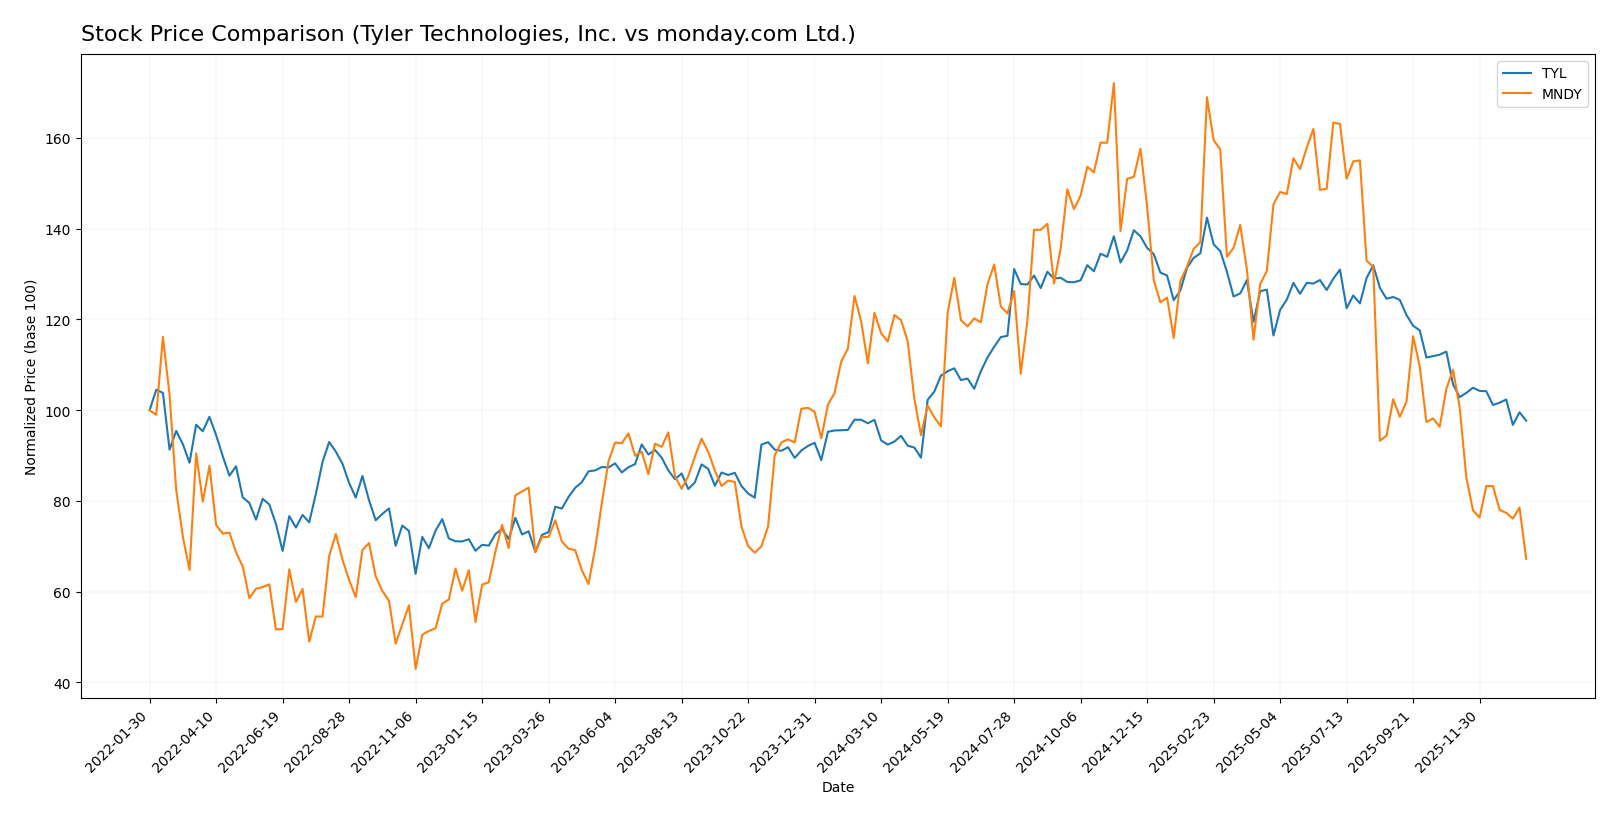
Stock Comparison
The stock price movements over the past 12 months reveal contrasting dynamics between Tyler Technologies, Inc. and monday.com Ltd., with Tyler showing mild gains amid decelerating momentum and monday.com experiencing a significant decline.
Trend Analysis
Tyler Technologies, Inc. exhibited a slight overall price increase of 0.58% over the past year, indicating a bullish trend with decelerating price momentum. The stock reached a peak of 641.7 and a low of 403.35, showing notable price range but stabilizing volatility.
monday.com Ltd. recorded a substantial overall price decline of 39.06%, reflecting a clear bearish trend with decelerating acceleration. The stock’s highest and lowest prices were 324.31 and 126.7, respectively, accompanied by elevated volatility.
Comparing both companies, Tyler Technologies delivered the highest market performance over the analyzed period, maintaining a near-neutral but positive trend, whereas monday.com faced steep losses and a pronounced bearish trajectory.
Target Prices
The consensus target prices for Tyler Technologies, Inc. and monday.com Ltd. reflect optimistic analyst expectations.
| Company | Target High | Target Low | Consensus |
|---|---|---|---|
| Tyler Technologies, Inc. | 675 | 470 | 584 |
| monday.com Ltd. | 330 | 194 | 264.42 |
Analysts expect Tyler Technologies’ stock to appreciate significantly from the current price of 440.01 USD, while monday.com Ltd.’s consensus target of 264.42 USD is more than double its current price of 126.7 USD, indicating strong growth potential.
Analyst Opinions Comparison
This section compares analysts’ ratings and grades for Tyler Technologies, Inc. and monday.com Ltd.:
Rating Comparison
TYL Rating
- Rated B, considered very favorable by analysts.
- Discounted Cash Flow Score: 4, indicating favorable future cash flow outlook.
- Return on Equity Score: 3, showing moderate efficiency in profit generation.
- Return on Assets Score: 4, favorable asset utilization.
- Debt To Equity Score: 3, moderate financial risk.
- Overall Score: 3, reflecting a moderate overall financial standing.
MNDY Rating
- Rated B-, also considered very favorable by analysts.
- Discounted Cash Flow Score: 4, similarly favorable for future cash flows.
- Return on Equity Score: 3, indicating moderate profit generation efficiency.
- Return on Assets Score: 3, moderate asset utilization.
- Debt To Equity Score: 3, also moderate financial risk.
- Overall Score: 3, reflecting a moderate overall financial standing.
Which one is the best rated?
Based on the provided data, TYL and MNDY share the same overall score of 3 and equal debt-to-equity and discounted cash flow scores. However, TYL has a higher return on assets score, making it slightly better rated in asset utilization.
Scores Comparison
The following table presents a comparison of Tyler Technologies and monday.com scores:
TYL Scores
- Altman Z-Score: 7.42, indicating a safe zone with low bankruptcy risk.
- Piotroski Score: 6, reflecting average financial strength.
MNDY Scores
- Altman Z-Score: 6.33, indicating a safe zone with low bankruptcy risk.
- Piotroski Score: 5, reflecting average financial strength.
Which company has the best scores?
Based on the provided data, Tyler Technologies has slightly higher Altman Z-Score and Piotroski Score values than monday.com, indicating marginally better financial stability and strength.
Grades Comparison
Here is a detailed comparison of the latest available grades for Tyler Technologies, Inc. and monday.com Ltd.:
Tyler Technologies, Inc. Grades
The table below summarizes recent grades from major financial institutions for Tyler Technologies, Inc.:
| Grading Company | Action | New Grade | Date |
|---|---|---|---|
| Piper Sandler | Maintain | Overweight | 2026-01-13 |
| Wells Fargo | Maintain | Equal Weight | 2026-01-08 |
| DA Davidson | Maintain | Neutral | 2025-12-09 |
| Evercore ISI Group | Maintain | In Line | 2025-10-31 |
| DA Davidson | Maintain | Neutral | 2025-10-31 |
| DA Davidson | Maintain | Neutral | 2025-10-10 |
| DA Davidson | Maintain | Neutral | 2025-08-05 |
| Barclays | Maintain | Overweight | 2025-07-31 |
| Needham | Maintain | Buy | 2025-05-13 |
| Barclays | Maintain | Overweight | 2025-04-25 |
Tyler Technologies’ grades mostly range from Neutral to Overweight, with no changes in recent ratings, indicating a stable outlook among analysts.
monday.com Ltd. Grades
Below is a summary of monday.com Ltd.’s recent grades from recognized grading companies:
| Grading Company | Action | New Grade | Date |
|---|---|---|---|
| BTIG | Maintain | Buy | 2026-01-15 |
| Barclays | Maintain | Overweight | 2026-01-12 |
| Jefferies | Maintain | Buy | 2026-01-05 |
| Citigroup | Maintain | Buy | 2025-12-23 |
| Tigress Financial | Maintain | Buy | 2025-12-11 |
| Baird | Maintain | Outperform | 2025-11-11 |
| Wells Fargo | Maintain | Overweight | 2025-11-11 |
| DA Davidson | Maintain | Buy | 2025-11-11 |
| Morgan Stanley | Maintain | Overweight | 2025-11-11 |
| Piper Sandler | Maintain | Overweight | 2025-11-11 |
monday.com Ltd. consistently receives Buy and Overweight ratings, with some Outperform grades, reflecting a strong analyst consensus.
Which company has the best grades?
monday.com Ltd. has received more consistently positive grades, predominantly Buy and Overweight, compared to Tyler Technologies’ Neutral to Overweight range. This suggests stronger analyst confidence in monday.com’s prospects, which may influence investor sentiment towards higher growth expectations.
Strengths and Weaknesses
Below is a comparison of key strengths and weaknesses for Tyler Technologies, Inc. (TYL) and monday.com Ltd. (MNDY) based on the most recent financial and operational data.
| Criterion | Tyler Technologies, Inc. (TYL) | monday.com Ltd. (MNDY) |
|---|---|---|
| Diversification | Diversified revenue streams: SaaS, transaction fees, maintenance, and professional services | Focused primarily on cloud-based work OS; less diversified |
| Profitability | Moderate net margin at 12.3%, neutral ROIC (~6.2%), but declining value creation (ROIC < WACC) | Low net margin (3.33%), negative ROIC (-1.73%), value is being destroyed but improving |
| Innovation | Strong enterprise software platform with steady upgrades | High innovation in collaboration tools with rapidly growing ROIC |
| Global presence | Primarily US-based with growing enterprise market penetration | Global SaaS platform with expanding international footprint |
| Market Share | Solid position in government software solutions with stable revenue base | Emerging player in collaborative work management with aggressive growth |
Key takeaways: Tyler Technologies offers diversified revenue and decent profitability but currently struggles with value creation due to declining ROIC. monday.com shows promising innovation and improving profitability trends but remains unprofitable with a narrower revenue base. Investors should weigh stability versus growth potential carefully.
Risk Analysis
Below is a comparative table highlighting key risks for Tyler Technologies, Inc. (TYL) and monday.com Ltd. (MNDY) based on the latest 2024 data and 2026 market context:
| Metric | Tyler Technologies, Inc. (TYL) | monday.com Ltd. (MNDY) |
|---|---|---|
| Market Risk | Moderate (Beta 0.92) | Higher (Beta 1.26) |
| Debt Level | Low (Debt/Equity 0.19) | Very Low (Debt/Equity 0.10) |
| Regulatory Risk | Moderate (US public sector focus) | Moderate (Global SaaS, Israel HQ) |
| Operational Risk | Low (Established with 7.5K employees) | Moderate (Younger, 2.5K employees) |
| Environmental Risk | Low (Software provider, minimal footprint) | Low (Cloud-based services) |
| Geopolitical Risk | Low (US-based) | Moderate (Exposure to Middle East & Europe) |
The most significant risk is market volatility for monday.com, amplified by its higher beta and international exposure, increasing sensitivity to geopolitical tensions. Tyler Technologies, while more stable financially with low debt and a strong Altman Z-score, faces moderate regulatory risk due to its reliance on US public sector contracts. Both companies have favorable debt levels but differ in operational maturity and market risk profiles.
Which Stock to Choose?
Tyler Technologies, Inc. (TYL) shows consistent income growth with a favorable net margin of 12.3% and a slight improvement in profitability metrics. Its financial ratios are slightly favorable overall, supported by low debt levels and strong interest coverage, but with some valuation concerns. The company’s rating is very favorable, reflecting solid financial standing despite moderate ROE and P/E ratios.
monday.com Ltd. (MNDY) demonstrates robust revenue and net income growth, with a very high gross margin but weaker profitability metrics overall. Its financial ratios are neutral due to mixed performance, including favorable liquidity and debt measures but poor returns and high valuation multiples. The rating is also very favorable, albeit with moderate scores in key profitability and valuation metrics.
Investors seeking growth potential might find monday.com’s strong top-line expansion and improving profitability appealing, while those prioritizing stability could view Tyler Technologies’ consistent income quality and balanced financial ratios as more favorable. The choice could depend on one’s risk tolerance and investment strategy focus.
Disclaimer: Investment carries a risk of loss of initial capital. The past performance is not a reliable indicator of future results. Be sure to understand risks before making an investment decision.
Go Further
I encourage you to read the complete analyses of Tyler Technologies, Inc. and monday.com Ltd. to enhance your investment decisions: