In today’s rapidly evolving tech landscape, companies like Twilio Inc. and Verint Systems Inc. are reshaping how businesses engage with their customers. Both operate in the communication and software sectors, focusing on customer engagement, yet they employ distinct innovation strategies. Twilio is renowned for its cloud-based communication platform, while Verint excels in customer engagement analytics. As we delve into their strengths and prospects, I invite you to discover which company may be the more compelling investment opportunity for your portfolio.
Table of contents
Company Overview
Twilio Inc. Overview
Twilio Inc. (TWLO) is a leader in the cloud communications sector, offering a robust platform that empowers developers to integrate voice, messaging, video, and email functionalities into their applications. Founded in 2008 and headquartered in San Francisco, California, Twilio aims to facilitate seamless customer engagement across various channels. With a market capitalization of approximately $19.88B, the company is well-positioned within the Communication Services sector, serving clients globally. As of recent trading, Twilio’s stock price is $129.69, reflecting a year-to-date range of $77.51 to $151.95. The company continues to innovate in the rapidly evolving landscape of digital communication.
Verint Systems Inc. Overview
Verint Systems Inc. (VRNT) specializes in customer engagement solutions, providing a comprehensive suite of applications designed to enhance customer interactions and operational efficiency. Established in 1994 and based in Melville, New York, Verint focuses on analytics, workforce optimization, and engagement management. The company’s market capitalization stands around $1.24B, with shares currently trading at $20.51. Verint’s offerings include tools for forecasting, scheduling, and real-time workforce management, making it a critical player in the Software – Infrastructure industry. The firm is committed to helping organizations improve customer satisfaction and operational compliance.
Key similarities and differences
Both Twilio and Verint focus on enhancing customer engagement through technology, but their approaches differ significantly. Twilio is centered on providing a versatile communication platform primarily for developers, while Verint emphasizes analytics and workforce optimization tools for broader customer interaction management. Despite these differences, both companies aim to drive customer satisfaction and operational efficiency within their respective domains.
Income Statement Comparison
The following table provides a comparative overview of the latest income statements for Twilio Inc. and Verint Systems Inc., showcasing key financial metrics.
| Metric | Twilio Inc. (TWLO) | Verint Systems Inc. (VRNT) |
|---|---|---|
| Market Cap | 19.88B | 1.24B |
| Revenue | 4.46B | 909.19M |
| EBITDA | 136.47M | 158.01M |
| EBIT | -88.61M | 108.48M |
| Net Income | -109.40M | 82.27M |
| EPS | -0.66 | 1.05 |
| Fiscal Year | 2024 | 2025 |
Interpretation of Income Statement
In comparing the latest fiscal years, Twilio’s revenue increased to 4.46B, but it continues to post a net loss of 109.40M, indicating ongoing challenges in profitability. Conversely, Verint has shown stability with revenue close to 909.19M and a positive net income of 82.27M, reflecting effective cost management and operational efficiency. While Twilio’s margins remain under pressure, Verint’s performance indicates strong operational health, suggesting a more favorable investment outlook in the current year.
Financial Ratios Comparison
The following table presents a comparison of key financial metrics and ratios for Twilio Inc. (TWLO) and Verint Systems Inc. (VRNT) based on the most recent data.
| Metric | TWLO | VRNT |
|---|---|---|
| ROE | -1.38% | 6.22% |
| ROIC | -0.55% | 4.79% |
| P/E | -163.92 | 19.17 |
| P/B | 2.25 | 1.19 |
| Current Ratio | 4.20 | 1.12 |
| Quick Ratio | 4.20 | 1.09 |
| D/E | 0.14 | 0.34 |
| Debt-to-Assets | 0.10 | 0.20 |
| Interest Coverage | 0 | 10.50 |
| Asset Turnover | 0.45 | 0.40 |
| Fixed Asset Turnover | 18.24 | 11.96 |
| Payout Ratio | 0 | 24.41% |
| Dividend Yield | 0% | 1.27% |
Interpretation of Financial Ratios
Twilio’s ratios indicate significant challenges, particularly with negative returns on equity (ROE) and investment capital (ROIC), suggesting operational inefficiencies. Conversely, Verint displays solid profitability with a positive ROE and manageable debt levels, indicating a more stable financial position. However, Verint’s high P/E ratio could suggest it is overvalued compared to its earnings, necessitating caution for potential investors.
Dividend and Shareholder Returns
Twilio Inc. (TWLO) does not pay dividends, which aligns with its high reinvestment strategy during its growth phase, focusing on R&D and market expansion. However, it engages in share buybacks, illustrating a commitment to shareholder returns despite the lack of dividends. Conversely, Verint Systems Inc. (VRNT) offers a modest dividend yield of 1.27% with a payout ratio of approximately 24%. This distribution, supported by stable cash flows, appears sustainable, promoting long-term shareholder value creation.
Strategic Positioning
Twilio Inc. (TWLO) holds a significant portion of the cloud communications market, leveraging its robust API offerings to enable customer engagement across various platforms. Its competitive pressure stems from established players and emerging startups, driving innovation and pricing strategies. Conversely, Verint Systems Inc. (VRNT) focuses on customer engagement solutions, competing through advanced analytics and automation. Both companies face technological disruption as they adapt to evolving customer expectations and the growing importance of AI in their respective sectors.
Stock Comparison
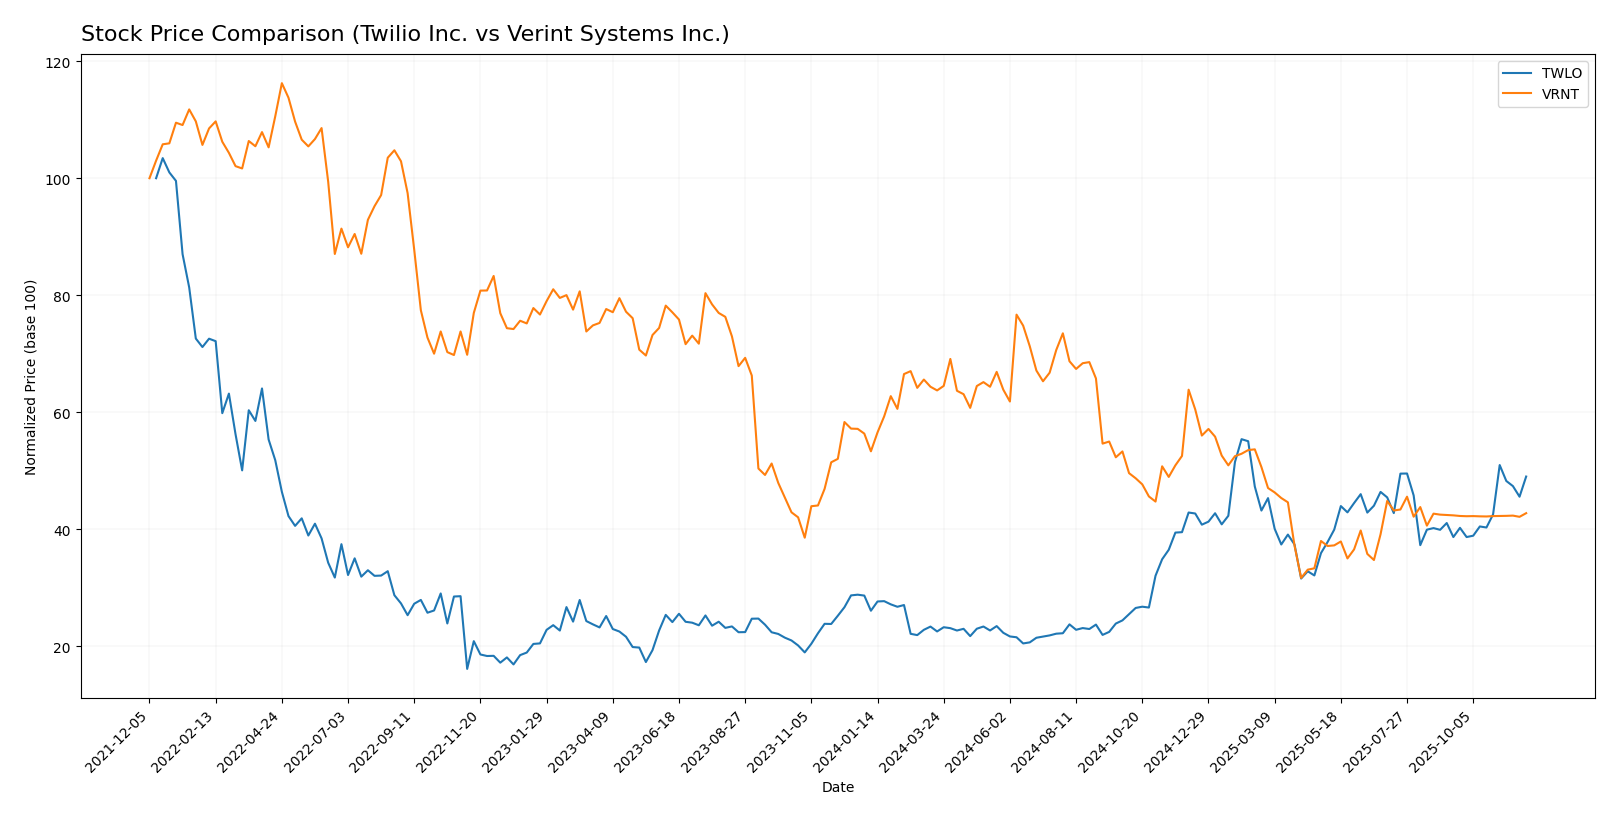
Over the past year, Twilio Inc. (TWLO) has exhibited a remarkable upward trajectory, while Verint Systems Inc. (VRNT) has faced notable downward pressures in its stock price, reflecting contrasting trading dynamics between these two companies.
Trend Analysis
For Twilio Inc. (TWLO), the overall price change over the past year stands at +87.87%. This significant increase indicates a bullish trend, characterized by acceleration in price movements. The stock reached a notable high of 146.58 and a low of 54.24, with a standard deviation of 26.7 suggesting considerable volatility. More recently, from September 14, 2025, to November 30, 2025, TWLO experienced a price change of +26.74%, with a standard deviation of 11.5, reinforcing the trend’s acceleration.
In contrast, Verint Systems Inc. (VRNT) has seen a price decline of -19.82% over the past year, marking a bearish trend with acceleration as well. The stock’s highest price was 36.78, while the lowest was 15.20, with a standard deviation of 5.53 indicating lower volatility compared to TWLO. In the recent period, from September 14, 2025, to November 30, 2025, VRNT recorded a slight increase of +0.89%, but this is insufficient to alter the overall bearish sentiment.
Analyst Opinions
Recent analyst recommendations for Twilio Inc. (TWLO) show a consensus rating of “hold” with a B- grade. Analysts highlight concerns over its price-to-earnings ratio, which is lower than industry standards, indicating potential undervaluation. However, the company’s return on assets score of 4 suggests operational efficiency, as noted by analysts like Morgan Stanley. Currently, there are no recent recommendations for Verint Systems Inc. (VRNT). Overall, while TWLO has a hold consensus, caution is advised for investors considering entry points.
Stock Grades
I have gathered reliable stock grade information for two companies, Twilio Inc. (TWLO) and Verint Systems Inc. (VRNT). Below are the current ratings from reputable grading companies.
Twilio Inc. Grades
| Grading Company | Action | New Grade | Date |
|---|---|---|---|
| Keybanc | maintain | Overweight | 2025-10-31 |
| TD Cowen | maintain | Hold | 2025-10-31 |
| UBS | maintain | Buy | 2025-10-31 |
| Piper Sandler | maintain | Overweight | 2025-10-31 |
| Wells Fargo | maintain | Overweight | 2025-10-31 |
| Rosenblatt | maintain | Buy | 2025-10-31 |
| Stifel | maintain | Hold | 2025-10-31 |
| Needham | maintain | Buy | 2025-10-31 |
| B of A Securities | maintain | Underperform | 2025-10-31 |
| Mizuho | maintain | Outperform | 2025-10-31 |
Verint Systems Inc. Grades
| Grading Company | Action | New Grade | Date |
|---|---|---|---|
| RBC Capital | downgrade | Sector Perform | 2025-08-26 |
| Needham | downgrade | Hold | 2025-08-25 |
| Rosenblatt | downgrade | Neutral | 2025-08-25 |
| Wedbush | maintain | Outperform | 2025-06-05 |
| Needham | maintain | Buy | 2025-06-05 |
| Needham | maintain | Buy | 2025-04-25 |
| Wedbush | maintain | Outperform | 2025-03-28 |
| RBC Capital | maintain | Outperform | 2025-03-27 |
| Needham | maintain | Buy | 2025-03-27 |
| Evercore ISI Group | maintain | In Line | 2025-03-27 |
Overall, Twilio Inc. shows a consistent trend of maintaining its positive ratings, particularly with multiple “Overweight” and “Buy” grades. In contrast, Verint Systems Inc. has experienced a notable downgrade from “Buy” to “Hold” and “Neutral” by several analysts, indicating a shift in sentiment that warrants careful consideration for investors.
Target Prices
The consensus target prices for Twilio Inc. and Verint Systems Inc. suggest potential upside for both stocks.
| Company | Target High | Target Low | Consensus |
|---|---|---|---|
| Twilio Inc. | 156 | 120 | 143.22 |
| Verint Systems Inc. | 20.5 | 20.5 | 20.5 |
For Twilio Inc. (current price: 129.69), the consensus target of 143.22 indicates a favorable outlook. Meanwhile, Verint Systems Inc. aligns closely with its current price of 20.51, reflecting steady analyst expectations.
Strengths and Weaknesses
The following table summarizes the strengths and weaknesses of Twilio Inc. (TWLO) and Verint Systems Inc. (VRNT) based on the most recent data available.
| Criterion | Twilio Inc. (TWLO) | Verint Systems Inc. (VRNT) |
|---|---|---|
| Diversification | Medium | High |
| Profitability | Negative margins | Positive margins |
| Innovation | High | Moderate |
| Global presence | Strong | Moderate |
| Market Share | Moderate | High |
| Debt level | Low | Moderate |
Key takeaways from the analysis indicate that while Twilio demonstrates high innovation and a strong global presence, it struggles with profitability. Conversely, Verint offers better profitability and market share, although its innovation is more moderate.
Risk Analysis
Below is a summary of the key risks associated with Twilio Inc. (TWLO) and Verint Systems Inc. (VRNT).
| Metric | Twilio Inc. (TWLO) | Verint Systems Inc. (VRNT) |
|---|---|---|
| Market Risk | High | Moderate |
| Regulatory Risk | Moderate | Moderate |
| Operational Risk | High | Low |
| Environmental Risk | Low | Low |
| Geopolitical Risk | Moderate | Low |
In my analysis, Twilio faces significant operational and market risks due to its high beta (1.321), indicating volatility. In contrast, Verint presents lower operational risk, supported by a solid gross profit margin of 71.3%. However, both companies must navigate regulatory challenges, particularly in rapidly evolving tech environments.
Which one to choose?
In comparing Twilio Inc. (TWLO) and Verint Systems Inc. (VRNT), TWLO demonstrates a stronger growth potential, with a recent upward price trend of 87.87% indicating a bullish market sentiment. However, it still struggles with profitability, reflected in its negative net profit margin of -2.45% for 2024 and a price-to-earnings ratio of -163.92. In contrast, VRNT, while experiencing a bearish trend with a -19.82% price change, shows stable profitability with a net income margin of 9.05% and a reasonable price-to-earnings ratio of 19.17.
For investors seeking growth, TWLO may be appealing despite its volatility, while those prioritizing stability and profitability might prefer VRNT. However, both companies face risks, including intense competition and market dependence.
Disclaimer: This article is not financial advice. Each investor is responsible for their own investment decisions.
Go further
I encourage you to read the complete analyses of Twilio Inc. and Verint Systems Inc. to enhance your investment decisions: