Home > Comparison > Financial Services > USB vs TFC
The strategic rivalry between U.S. Bancorp and Truist Financial Corporation shapes regional banking dynamics in the U.S. U.S. Bancorp operates as a diversified financial services powerhouse, emphasizing wealth management and commercial banking. Truist, with a focus on consumer and insurance services, leverages a leaner operational model concentrated in the Southeast. This analysis will assess which bank’s strategic path offers superior risk-adjusted returns for a balanced portfolio facing evolving market pressures.

Table of contents
Companies Overview
U.S. Bancorp and Truist Financial Corporation both command significant regional banking markets in the U.S.
U.S. Bancorp: Midwest and West Regional Banking Powerhouse
U.S. Bancorp stands as a diversified financial services holding company with a broad range of offerings. Its core revenue engine includes commercial banking, consumer banking, wealth management, and payment services. In 2026, the company emphasizes expanding digital channels alongside maintaining its extensive physical network of 2,230 banking offices and 4,059 ATMs.
Truist Financial Corporation: Southeastern and Mid-Atlantic Banking Leader
Truist Financial Corporation operates as a holding company focused on retail and commercial banking combined with insurance and wealth management. It generates revenue through deposit products, lending, insurance services, and investment advisory. The firm’s 2026 strategy centers on integrating its diverse financial segments to deepen customer relationships across 2,517 offices.
Strategic Collision: Similarities & Divergences
Both banks compete as regional powerhouses with strong retail and commercial banking roots. U.S. Bancorp leans on a broader service portfolio and digital expansion, while Truist prioritizes segment integration and insurance offerings. Their primary battleground lies in customer acquisition and retention within their geographic footprints. These distinctions create contrasting risk and growth profiles for investors.
Income Statement Comparison
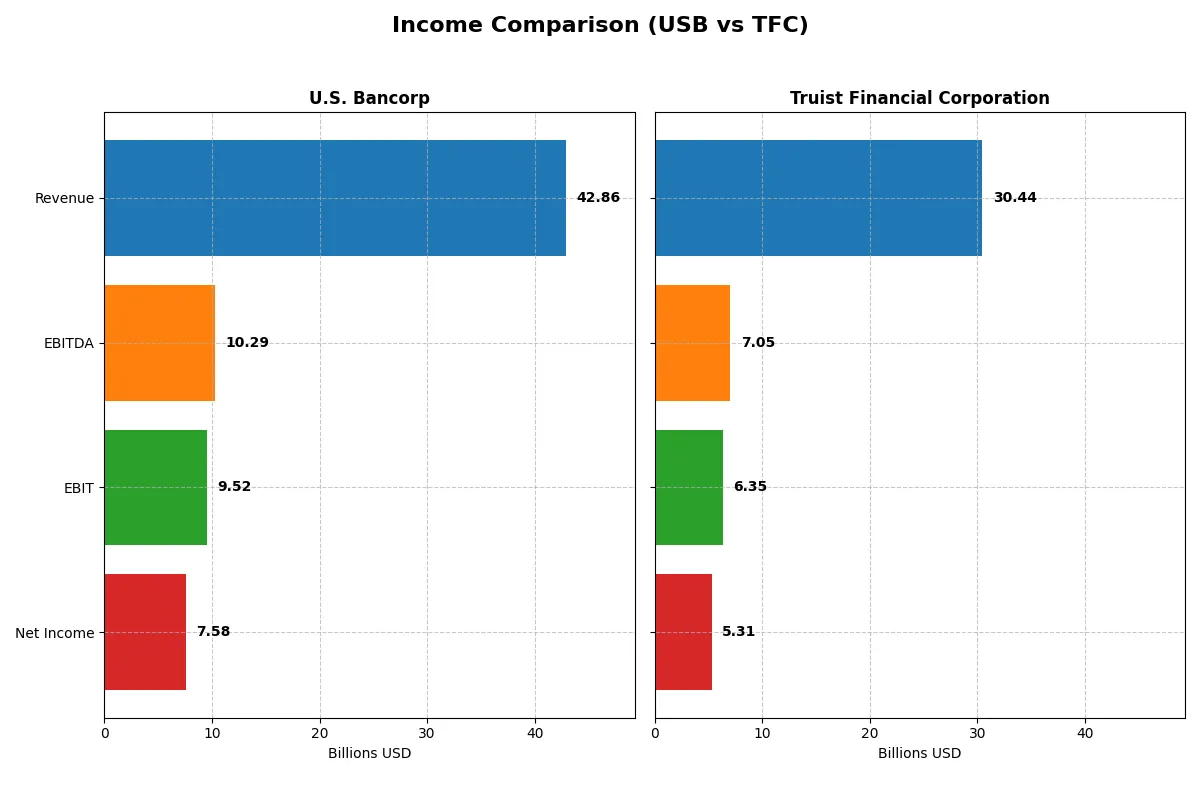
This table dissects the core profitability and scalability of both corporate engines to reveal who dominates the bottom line:
| Metric | U.S. Bancorp (USB) | Truist Financial Corporation (TFC) |
|---|---|---|
| Revenue | 42.9B | 30.4B |
| Cost of Revenue | 15.9B | 11.5B |
| Operating Expenses | 17.4B | 12.6B |
| Gross Profit | 26.9B | 18.9B |
| EBITDA | 10.3B | 7.1B |
| EBIT | 9.5B | 6.3B |
| Interest Expense | 14.3B | 10.1B |
| Net Income | 7.6B | 5.3B |
| EPS | 4.62 | 3.86 |
| Fiscal Year | 2025 | 2025 |
Income Statement Analysis: The Bottom-Line Duel
This income statement comparison reveals the true efficiency and profitability of two major financial institutions over recent years.
U.S. Bancorp Analysis
U.S. Bancorp’s revenue grew steadily from 23.7B in 2021 to 42.9B in 2025, showing strong scale. Net income peaked at 7.6B in 2025, despite a slight overall decline since 2021. The gross margin remains robust at 62.8%, and the net margin improved to 17.7%, reflecting efficient cost control and strong profitability momentum in 2025.
Truist Financial Corporation Analysis
Truist’s revenue climbed from 23.1B in 2021 to 30.4B in 2025, with a significant 25.5% jump in the last year alone. Net income, however, shows volatility, swinging from a loss in 2023 to 5.3B in 2025. The gross margin holds steady near 62.2%, while the net margin is slightly lower at 17.4%. Recent gains stem from a sharp EBIT recovery, signaling operational turnaround.
Margin Strength vs. Revenue Momentum
U.S. Bancorp delivers consistent margin strength and steady revenue growth, making it the fundamental winner in efficiency and profitability. Truist shows impressive revenue momentum but suffers from volatile net income and weaker margin stability. For investors, U.S. Bancorp’s profile offers greater reliability and disciplined earnings power.
Financial Ratios Comparison
These vital ratios act as a diagnostic tool to expose the underlying fiscal health, valuation premiums, and capital efficiency of the companies compared:
| Ratios | U.S. Bancorp (USB) | Truist Financial Corporation (TFC) |
|---|---|---|
| ROE | 11.62% | 8.14% |
| ROIC | 11.14% | 3.61% |
| P/E | 10.95 | 11.75 |
| P/B | 1.27 | 0.96 |
| Current Ratio | 2.73 | 0.87 |
| Quick Ratio | 2.73 | 0.87 |
| D/E | 1.20 | 1.07 |
| Debt-to-Assets | 11.26% | 12.75% |
| Interest Coverage | 0.66 | 0.63 |
| Asset Turnover | 0.062 | 0.056 |
| Fixed Asset Turnover | 11.38 | 9.60 |
| Payout ratio | 41.46% | 49.67% |
| Dividend yield | 3.79% | 4.23% |
| Fiscal Year | 2025 | 2025 |
Efficiency & Valuation Duel: The Vital Signs
Financial ratios serve as a company’s DNA, exposing hidden risks and revealing operational excellence critical for investment decisions.
U.S. Bancorp
U.S. Bancorp demonstrates solid profitability with a neutral ROE of 11.62% and a favorable net margin of 17.68%. Its valuation appears attractive, with a P/E of 10.95 and P/B of 1.27 signaling efficiency rather than stretched pricing. The company rewards shareholders with a 3.79% dividend yield, balancing returns and financial health.
Truist Financial Corporation
Truist shows a lower ROE at 8.14%, reflecting weaker profitability despite a similar net margin of 17.44%. Its P/E of 11.75 and P/B under 1 suggest reasonable valuation but less operational efficiency. Truist offers a higher dividend yield of 4.23%, focusing on shareholder income rather than aggressive reinvestment or growth.
Dividend Yield and Profitability: Balanced Efficiency vs. Income Focus
U.S. Bancorp offers a better blend of operational efficiency and valuation favorability, presenting a more balanced risk-reward profile. Truist’s higher dividend yield suits income-focused investors but comes with weaker profitability and a neutral overall ratio evaluation. Investors prioritizing efficiency may prefer U.S. Bancorp, while income seekers might lean toward Truist.
Which one offers the Superior Shareholder Reward?
I observe U.S. Bancorp (USB) delivers a more balanced shareholder reward model than Truist Financial (TFC) in 2026. USB pays a 3.8% dividend yield with a sustainable 41% payout ratio, supported by consistent free cash flow and moderate leverage. It also pursues steady buybacks, enhancing total returns. TFC offers a higher 4.2% yield but carries payout volatility and weaker cash flow coverage, with less visible buyback activity. USB’s disciplined capital allocation and reliable distributions position it as the superior total return choice in today’s banking sector environment.
Comparative Score Analysis: The Strategic Profile
The radar chart reveals the fundamental DNA and trade-offs of U.S. Bancorp and Truist Financial Corporation:
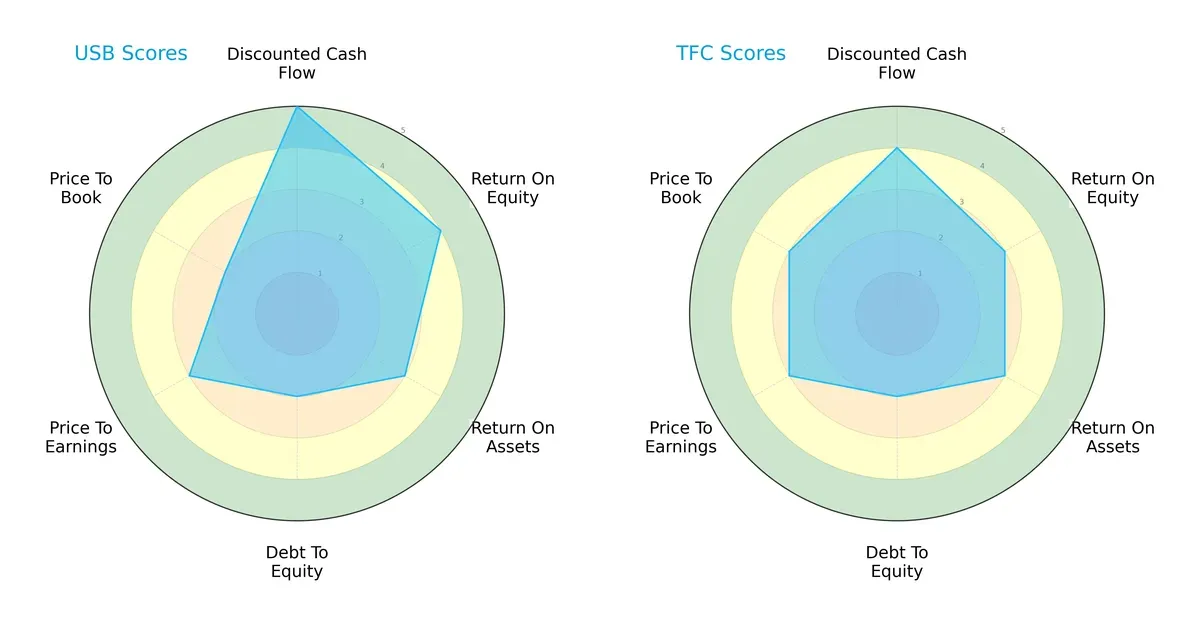
U.S. Bancorp leads in discounted cash flow (5 vs. 4) and return on equity (4 vs. 3), showing a stronger cash generation and shareholder profitability edge. Truist holds a slight valuation advantage with a better price-to-book score (3 vs. 2). Both share moderate debt-to-equity risks (2 each), but U.S. Bancorp’s profile is more unbalanced, relying on cash flow strength. Truist offers a more balanced overall score set.
Bankruptcy Risk: Solvency Showdown
U.S. Bancorp (0.41) and Truist (0.12) both fall in the distress zone, signaling high bankruptcy risk in this cycle:
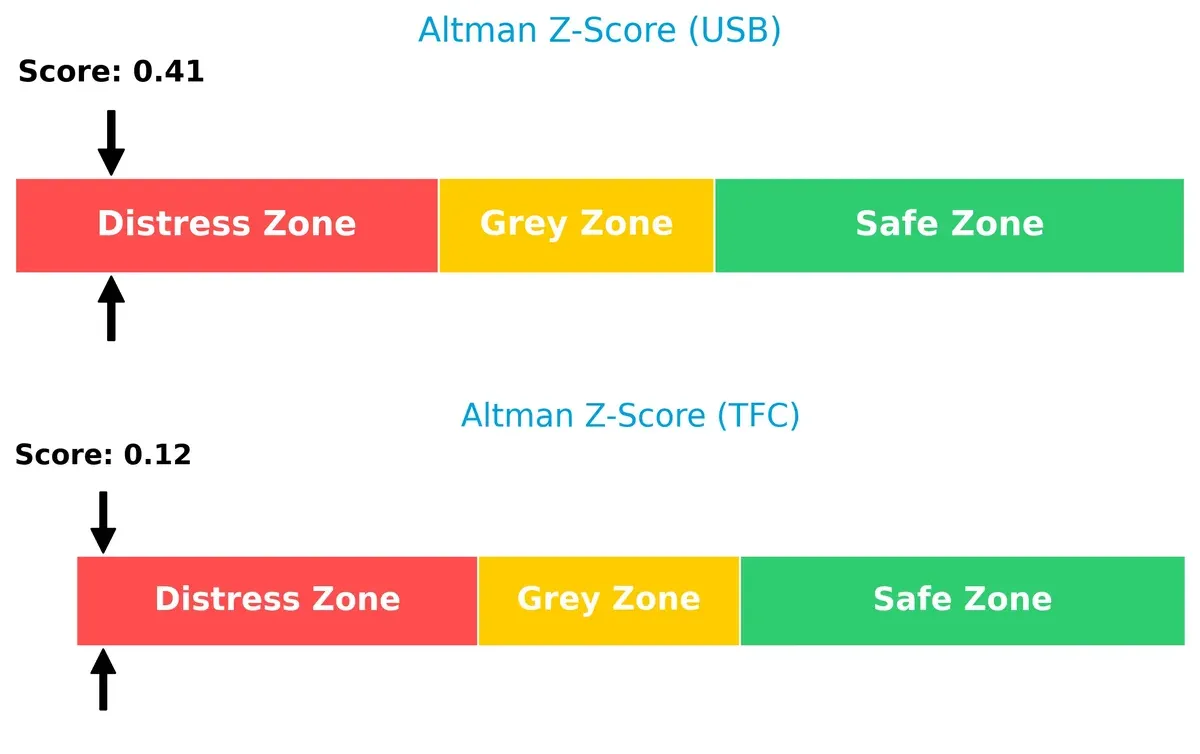
Both firms show weak solvency buffers. This is a red flag for long-term survival, especially given economic uncertainties. Investors must weigh these risks carefully.
Financial Health: Quality of Operations
Truist’s Piotroski score of 7 signals stronger financial health than U.S. Bancorp’s 6, suggesting better operational quality and fewer internal red flags:
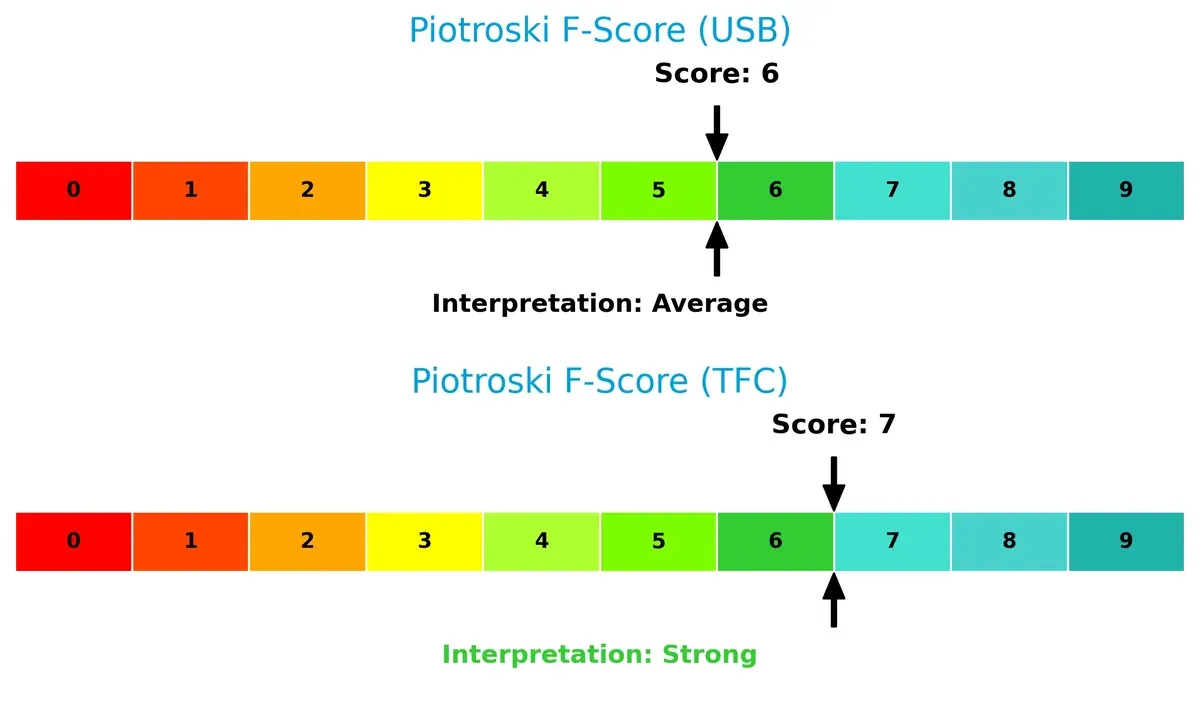
Truist demonstrates more robust fundamentals and efficiency. U.S. Bancorp’s average score warrants caution, as it may face operational challenges ahead.
How are the two companies positioned?
This section dissects the operational DNA of U.S. Bancorp and Truist by comparing their revenue distribution and internal strengths and weaknesses. The goal is to confront their economic moats to reveal which business model offers the most resilient, sustainable competitive advantage today.
Revenue Segmentation: The Strategic Mix
The following comparison dissects how U.S. Bancorp and Truist Financial diversify their income streams and where their primary sector bets lie:
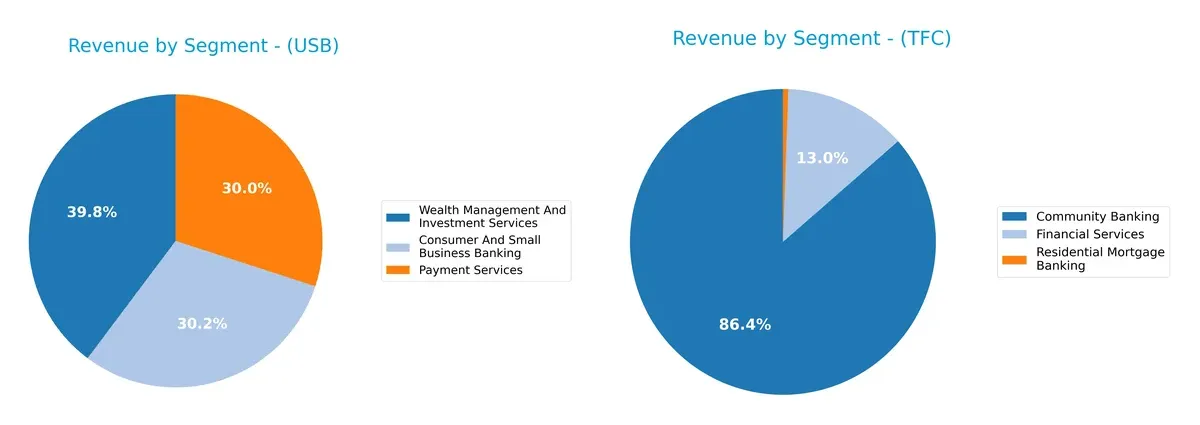
U.S. Bancorp anchors its revenue on Wealth Management ($12.2B) and Consumer Banking ($9.3B), showcasing a balanced, diversified mix. In contrast, Truist Financial’s latest data reveals minimal, concentrated revenue in Community Banking (~$153M), with other segments near zero or negative. USB’s broad ecosystem reduces concentration risk, while TFC’s limited scope signals higher vulnerability to sector-specific shifts and less infrastructure dominance.
Strengths and Weaknesses Comparison
This table compares the strengths and weaknesses of U.S. Bancorp and Truist Financial Corporation based on key financial and business metrics:
U.S. Bancorp Strengths
- Higher net margin at 17.68%
- Favorable PE at 10.95
- Strong current and quick ratios at 2.73
- Favorable dividend yield at 3.79%
- Diverse revenue streams across multiple banking segments
Truist Financial Corporation Strengths
- Favorable net margin at 17.44%
- Favorable PE at 11.75
- Favorable dividend yield at 4.23%
- Lower debt to assets ratio at 12.75%
- Positive fixed asset turnover at 9.6
U.S. Bancorp Weaknesses
- Unfavorable ROIC below WACC at 11.14% vs. 11.45%
- High debt to equity ratio at 1.2
- Low interest coverage ratio at 0.66
- Asset turnover very low at 0.06
- Neutral ROE at 11.62%
- Negative segment in Treasury and Corporate Support
Truist Financial Corporation Weaknesses
- Unfavorable ROE at 8.14%
- Unfavorable ROIC at 3.61% below WACC at 9.04%
- Low current and quick ratios near 0.87
- Unfavorable debt to equity at 1.07
- Negative interest coverage at 0.63
- Limited revenue diversification with concentrated segments
U.S. Bancorp benefits from better liquidity and broader revenue diversification, though it struggles with profitability relative to capital costs. Truist shows strong dividend yield but faces challenges in capital efficiency and liquidity. Both companies must address weaknesses to improve competitive positioning.
The Moat Duel: Analyzing Competitive Defensibility
A structural moat protects long-term profits from relentless competition and market erosion. Without it, sustainable value evaporates quickly:
U.S. Bancorp: Efficiency Through Growing Profitability
U.S. Bancorp’s moat centers on operational efficiency and growing ROIC, despite currently shedding value versus WACC. Stable margins and expanding profitability hint at a strengthening competitive edge in 2026.
Truist Financial Corporation: Struggling with Declining Returns
Truist relies on regional banking scale but faces a shrinking ROIC and value destruction. Its moat is weaker and under pressure, risking further erosion unless it revitalizes profitability or expands strategically.
Efficiency Growth vs. Scale Struggle: Who Holds the Stronger Moat?
U.S. Bancorp’s improving profitability and expanding ROIC create a deeper moat than Truist’s shrinking returns. USB is better positioned to defend and grow market share in the competitive regional banking space.
Which stock offers better returns?
Over the past year, U.S. Bancorp and Truist Financial Corporation both show robust price gains with accelerating bullish trends, driven by strong buyer dominance and distinct volume dynamics.
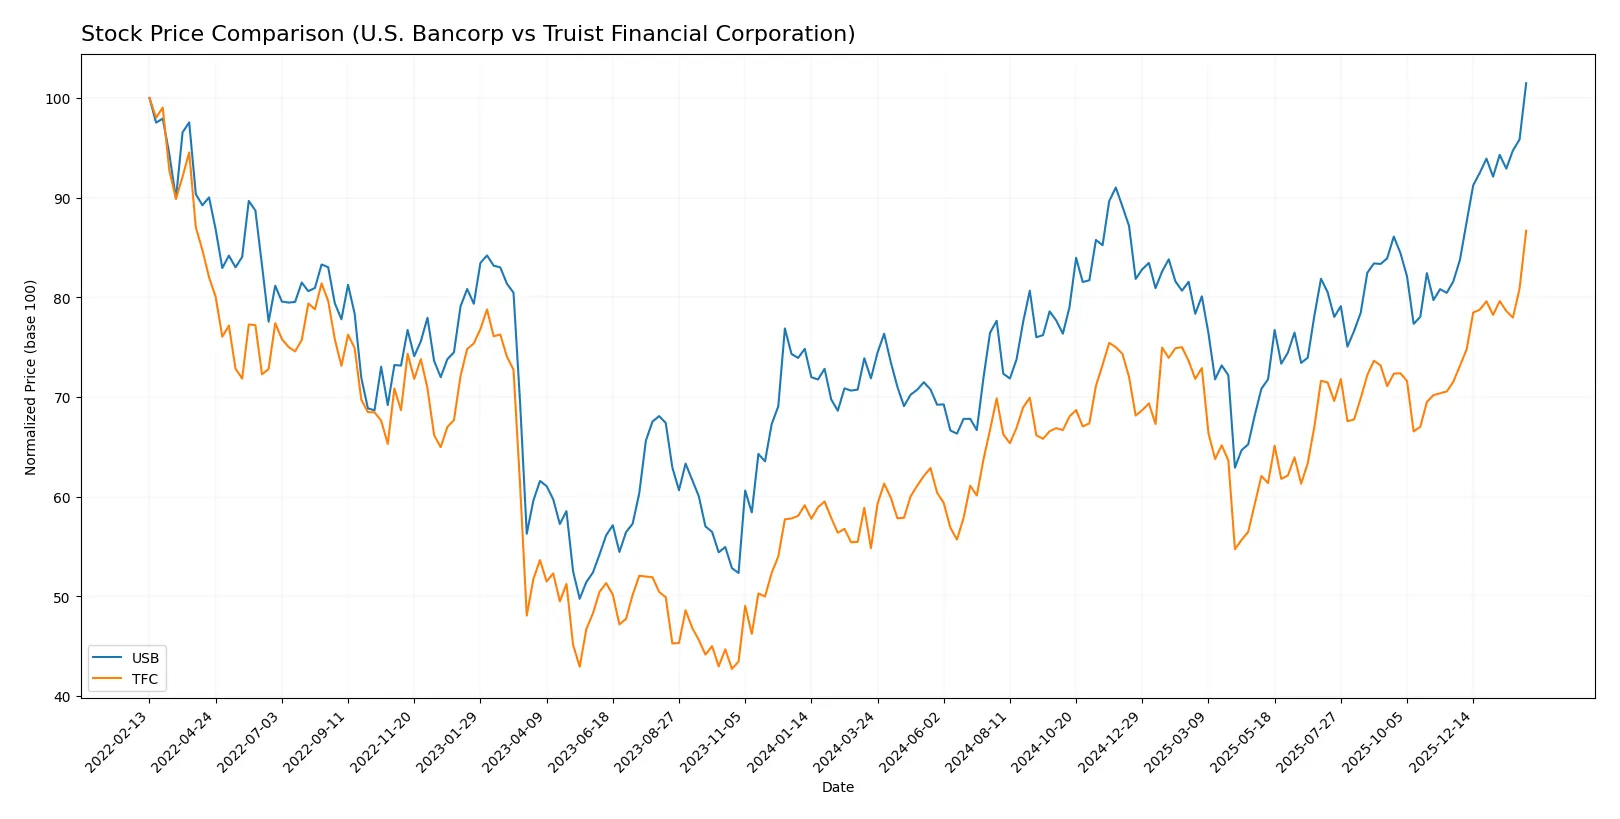
Trend Comparison
U.S. Bancorp’s stock rose 41.21% over 12 months, marking a bullish trend with accelerating momentum. It reached a high of 59.42 and maintained a solid volatility level (4.52 std deviation).
Truist Financial’s share price increased 58.09% in the same period, also bullish with acceleration. The stock hit 55.11 at its peak and showed slightly lower volatility (4.17 std deviation).
Truist Financial outperformed U.S. Bancorp by nearly 17 percentage points, delivering the highest market returns despite a declining overall volume trend.
Target Prices
Analysts set a moderate upside for these regional banks, reflecting cautious optimism amid financial sector headwinds.
| Company | Target Low | Target High | Consensus |
|---|---|---|---|
| U.S. Bancorp | 52 | 65 | 58.96 |
| Truist Financial Corporation | 50 | 58 | 54.38 |
The consensus targets for U.S. Bancorp and Truist Financial exceed current prices slightly, implying modest appreciation potential. This aligns with their stable banking fundamentals but suggests limited aggressive growth expectations.

Don’t Let Luck Decide Your Entry Point
Optimize your entry points with our advanced ProRealTime indicators. You’ll get efficient buy signals with precise price targets for maximum performance. Start outperforming now!
How do institutions grade them?
U.S. Bancorp Grades
The table below shows recent grades from reputable grading companies for U.S. Bancorp.
| Grading Company | Action | New Grade | Date |
|---|---|---|---|
| Argus Research | Maintain | Buy | 2026-01-22 |
| DA Davidson | Maintain | Buy | 2026-01-21 |
| Oppenheimer | Maintain | Outperform | 2026-01-21 |
| RBC Capital | Maintain | Outperform | 2026-01-21 |
| Keefe, Bruyette & Woods | Maintain | Market Perform | 2026-01-21 |
| TD Cowen | Maintain | Buy | 2026-01-21 |
| Truist Securities | Maintain | Hold | 2026-01-21 |
| Wolfe Research | Downgrade | Peer Perform | 2026-01-07 |
| TD Cowen | Maintain | Buy | 2026-01-07 |
| Barclays | Maintain | Overweight | 2026-01-05 |
Truist Financial Corporation Grades
Below is a summary of recent official grades for Truist Financial Corporation from credible sources.
| Grading Company | Action | New Grade | Date |
|---|---|---|---|
| Argus Research | Maintain | Buy | 2026-01-23 |
| Piper Sandler | Maintain | Neutral | 2026-01-22 |
| TD Cowen | Maintain | Buy | 2026-01-22 |
| Raymond James | Maintain | Outperform | 2026-01-07 |
| TD Cowen | Maintain | Buy | 2026-01-07 |
| Evercore ISI Group | Upgrade | Outperform | 2026-01-06 |
| Barclays | Downgrade | Underweight | 2026-01-05 |
| Citigroup | Maintain | Buy | 2025-12-31 |
| Keefe, Bruyette & Woods | Maintain | Market Perform | 2025-12-17 |
| Morgan Stanley | Maintain | Equal Weight | 2025-12-17 |
Which company has the best grades?
U.S. Bancorp consistently receives Buy and Outperform grades, indicating strong institutional confidence. Truist Financial has a more mixed profile, including Neutral and Underweight calls. This divergence may influence investor sentiment and portfolio positioning.
Risks specific to each company
The following categories identify the critical pressure points and systemic threats facing both firms in the 2026 market environment:
1. Market & Competition
U.S. Bancorp
- Faces intense regional banking competition with a strong Midwest and West presence.
Truist Financial Corporation
- Operates in Southeastern and Mid-Atlantic regions amid fierce regional rivalry and market consolidation.
2. Capital Structure & Debt
U.S. Bancorp
- Debt-to-equity ratio is 1.2, slightly unfavorable, signaling moderate leverage risk.
Truist Financial Corporation
- Debt-to-equity ratio is 1.07, also unfavorable, but marginally better leverage position.
3. Stock Volatility
U.S. Bancorp
- Beta of 1.057 indicates market-level volatility, aligned with S&P 500 benchmarks.
Truist Financial Corporation
- Lower beta of 0.855 suggests less volatility and potentially safer stock price movements.
4. Regulatory & Legal
U.S. Bancorp
- Subject to stringent banking regulations; risks stem from evolving financial compliance demands.
Truist Financial Corporation
- Faces similar regulatory scrutiny with additional complexity from insurance operations.
5. Supply Chain & Operations
U.S. Bancorp
- Operates 2,230 branches, large ATM network; operational efficiency critical amid digital shift.
Truist Financial Corporation
- Runs 2,517 branches; integration risks from merger history may affect operational stability.
6. ESG & Climate Transition
U.S. Bancorp
- Increasing pressure to align lending with climate goals; exposure to fossil fuel sectors a risk.
Truist Financial Corporation
- ESG initiatives underway but must balance insurance underwriting with climate-related risk exposures.
7. Geopolitical Exposure
U.S. Bancorp
- Primarily U.S.-focused, limiting geopolitical risk but sensitive to national economic policies.
Truist Financial Corporation
- Similar U.S. focus; regional economic disparities could impact revenue stability.
Which company shows a better risk-adjusted profile?
U.S. Bancorp’s primary risk lies in its capital structure and low interest coverage, raising financial leverage concerns. Truist faces operational integration and regulatory complexities, but boasts lower stock volatility and a stronger Piotroski score. Given these factors, Truist exhibits a slightly better risk-adjusted profile, supported by its stronger operational metrics and comparatively stable leverage. However, both firms reside in the distress zone per Altman Z-scores, signaling elevated bankruptcy risk that investors must monitor closely.
Final Verdict: Which stock to choose?
U.S. Bancorp’s superpower lies in its robust liquidity and consistent profitability, making it a reliable cash generator. However, its slightly unfavorable ROIC versus WACC signals a need for caution on capital efficiency. It suits portfolios aiming for steady income with moderate growth.
Truist Financial’s strategic moat is its improving revenue growth and solid dividend yield, offering recurring income potential. Yet, its declining profitability and weaker capital returns compared to U.S. Bancorp mark it as riskier. It fits well within GARP portfolios seeking growth balanced with value.
If you prioritize capital efficiency and stable cash flows, U.S. Bancorp outshines due to its superior liquidity and income consistency. However, if you seek growth with reasonable valuation, Truist Financial offers better revenue momentum despite its profitability challenges. Both present distinct analytical scenarios depending on risk tolerance and investment horizon.
Disclaimer: Investment carries a risk of loss of initial capital. The past performance is not a reliable indicator of future results. Be sure to understand risks before making an investment decision.
Go Further
I encourage you to read the complete analyses of U.S. Bancorp and Truist Financial Corporation to enhance your investment decisions: