Home > Comparison > Consumer Cyclical > TSCO vs WSM
The strategic rivalry between Tractor Supply Company and Williams-Sonoma, Inc. defines the competitive landscape of specialty retail. Tractor Supply operates as a capital-intensive rural lifestyle retailer, while Williams-Sonoma excels as a high-margin omni-channel home goods provider. This analysis contrasts their operational models and growth trajectories to identify which offers superior risk-adjusted returns. I aim to clarify which company better fits a diversified portfolio amid evolving consumer trends and economic cycles.
Table of contents
Companies Overview
Tractor Supply Company and Williams-Sonoma, Inc. are key players in the U.S. specialty retail market with distinct customer bases.
Tractor Supply Company: The Rural Lifestyle Retailer
Tractor Supply Company dominates the rural lifestyle retail sector, generating revenue mainly through its extensive network of 2,016 stores selling agricultural, pet, and hardware products. Its strategic focus in 2022 emphasized expanding its footprint with 178 Petsense stores, serving recreational farmers and ranchers. The company leverages strong private-label brands to strengthen its competitive edge.
Williams-Sonoma, Inc.: The Omni-Channel Home Specialty Retailer
Williams-Sonoma, Inc. is a leading omni-channel specialty retailer focused on home furnishings, cookware, and decor. It drives revenue via 544 stores and global e-commerce platforms, emphasizing brand diversification across Williams Sonoma, Pottery Barn, and West Elm. In 2022, it prioritized digital innovation, including 3-D imaging and augmented reality, to enhance customer experience and global reach.
Strategic Collision: Similarities & Divergences
Both companies excel in specialty retail but diverge sharply in customer focus—rural lifestyle versus upscale home goods. Their battle for market share plays out through physical store expansion and digital innovation. Tractor Supply’s broad physical presence contrasts with Williams-Sonoma’s tech-driven, global omni-channel approach. These differences define distinct risk and growth profiles for investors eyeing niche retail sectors.
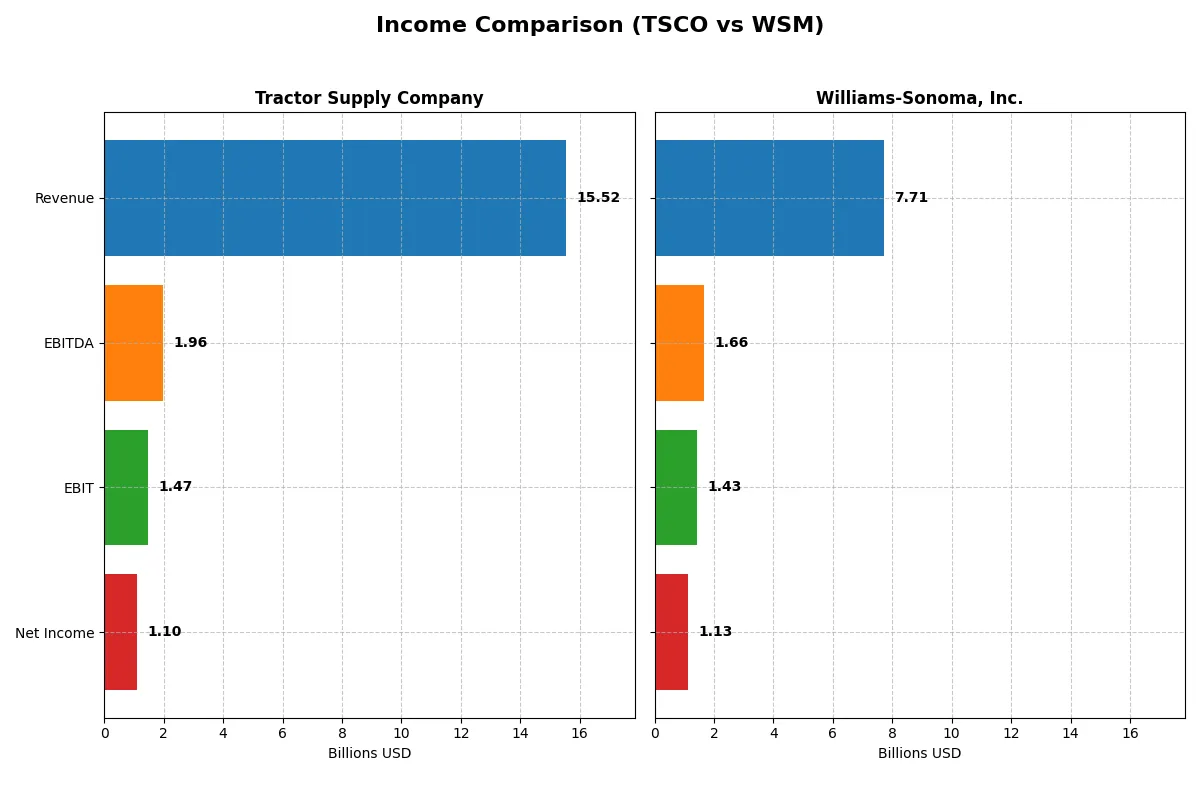
Income Statement Comparison
This data dissects the core profitability and scalability of both corporate engines to reveal who dominates the bottom line:
| Metric | Tractor Supply Company (TSCO) | Williams-Sonoma, Inc. (WSM) |
|---|---|---|
| Revenue | 15.5B | 7.7B |
| Cost of Revenue | 10.4B | 4.1B |
| Operating Expenses | 3.7B | 2.2B |
| Gross Profit | 5.2B | 3.6B |
| EBITDA | 2.0B | 1.7B |
| EBIT | 1.5B | 1.4B |
| Interest Expense | 69M | 0 |
| Net Income | 1.1B | 1.1B |
| EPS | 2.07 | 8.91 |
| Fiscal Year | 2025 | 2024 |
Income Statement Analysis: The Bottom-Line Duel
This income statement comparison reveals which company converts revenue into profit more efficiently and sustains margin strength over time.
Tractor Supply Company Analysis
Tractor Supply Company’s revenue grew steadily from 12.7B in 2021 to 15.5B in 2025, a 22% rise. Net income rose modestly to 1.1B in 2025, showing consistent profitability. Its gross margin holds firm at 33.2%, while net margin remains a favorable 7.1%. However, recent slight declines in gross profit and EBIT margins indicate emerging pressure on efficiency.
Williams-Sonoma, Inc. Analysis
Williams-Sonoma posted a peak revenue near 8B in 2023 but slipped slightly to 7.7B by 2024. Despite this, net income surged 19% to 1.13B in 2024. The company enjoys robust margins: a strong 46.5% gross margin and a solid 14.6% net margin. Earnings growth and margin expansion highlight effective cost control and operational leverage in the latest year.
Margin Strength vs. Revenue Growth
Williams-Sonoma outperforms Tractor Supply in profitability and margin expansion, with a net margin twice as high and superior earnings growth. Tractor Supply leads in revenue scale and steady top-line growth but faces margin compression risks. Investors valuing margin resilience and profit growth may favor Williams-Sonoma’s efficient model over Tractor Supply’s volume-driven approach.
Financial Ratios Comparison
These vital ratios act as a diagnostic tool to expose the underlying fiscal health, valuation premiums, and capital efficiency of the companies compared below:
| Ratios | Tractor Supply Company (TSCO) | Williams-Sonoma, Inc. (WSM) |
|---|---|---|
| ROE | 42.46% | 52.52% |
| ROIC | 13.11% | 29.89% |
| P/E | 24.18 | 23.71 |
| P/B | 10.27 | 12.45 |
| Current Ratio | 1.34 | 1.44 |
| Quick Ratio | 0.16 | 0.74 |
| D/E | 3.73 | 0.63 |
| Debt-to-Assets | 88.12% | 25.41% |
| Interest Coverage | 21.22 | N/A |
| Asset Turnover | 1.42 | 1.45 |
| Fixed Asset Turnover | 2.23 | 3.49 |
| Payout ratio | 44.49% | 24.89% |
| Dividend yield | 1.84% | 1.05% |
| Fiscal Year | 2025 | 2024 |
Efficiency & Valuation Duel: The Vital Signs
Financial ratios act as the company’s DNA, revealing hidden risks and operational excellence that shape investor decisions.
Tractor Supply Company
Tractor Supply Company posts a strong 42.5% ROE and a moderate 7.1% net margin, signaling robust profitability. Its P/E of 24.2 suggests a fairly valued stock, while a high P/B of 10.3 flags potential overvaluation. Tractor Supply returns value through a 1.8% dividend yield, balancing shareholder payouts with reinvestment.
Williams-Sonoma, Inc.
Williams-Sonoma commands a higher profitability profile with a 52.5% ROE and a 14.6% net margin. Its P/E ratio stands similarly neutral at 23.7, but a higher P/B of 12.5 indicates stretched valuation. The company offers a 1.1% dividend yield, reflecting moderate shareholder returns alongside solid cash flow efficiency.
Operational Strength vs. Valuation Stretch
Williams-Sonoma delivers superior profitability and operational efficiency but at a slightly higher valuation risk than Tractor Supply. Tractor Supply’s balanced valuation and steady dividends may appeal to investors prioritizing moderate risk. Williams-Sonoma suits those seeking higher returns with acceptance of valuation premiums.
Which one offers the Superior Shareholder Reward?
I see Tractor Supply Company (TSCO) delivers a 1.8% dividend yield with a 44% payout ratio, well-covered by free cash flow at 45%. Its buybacks are modest, reflecting a balanced capital return approach. Williams-Sonoma (WSM) yields 1.05% with a lower 25% payout ratio but reinvests heavily in growth, supported by an 84% free cash flow coverage and robust buybacks. WSM’s aggressive buybacks and stronger cash flow sustainability suggest a superior total return profile in 2026. I favor Williams-Sonoma for long-term value creation despite its lower yield.
Comparative Score Analysis: The Strategic Profile
The radar chart reveals the fundamental DNA and trade-offs of Tractor Supply Company and Williams-Sonoma, Inc., highlighting their strategic financial strengths and weaknesses:
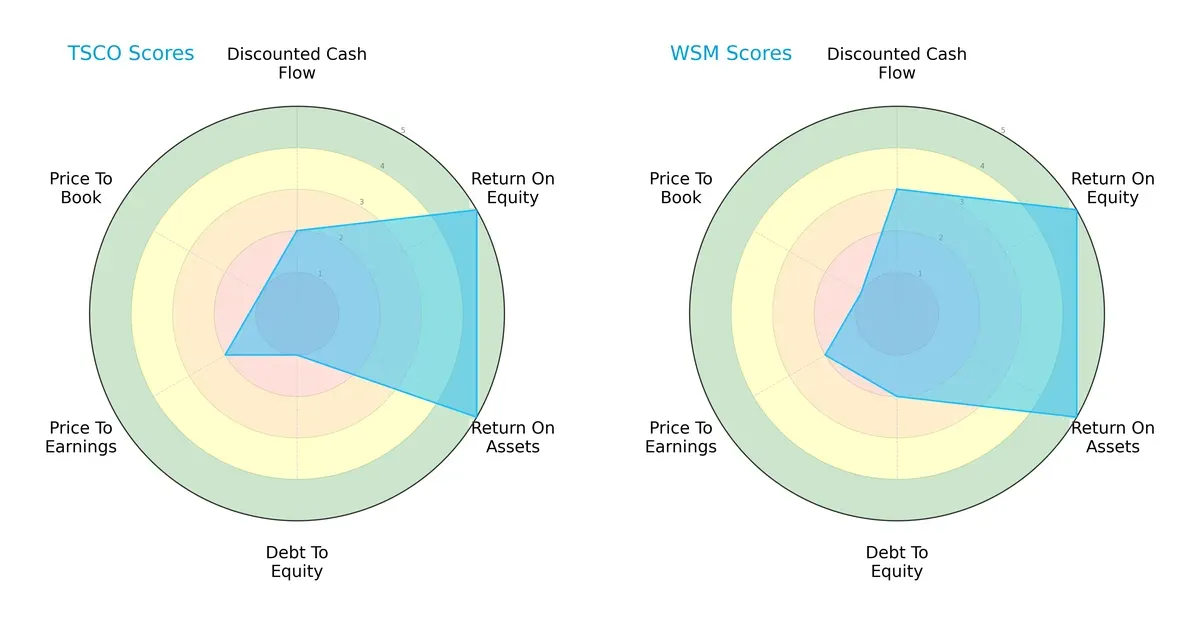
Williams-Sonoma shows a more balanced profile with moderate DCF (3) and debt-to-equity scores (2), while Tractor Supply leans heavily on strong profitability metrics (ROE and ROA at 5) but suffers from a weak balance sheet (debt-to-equity at 1). Both firms have moderate valuation scores, but Tractor Supply’s very unfavorable debt and price-to-book scores expose risk.
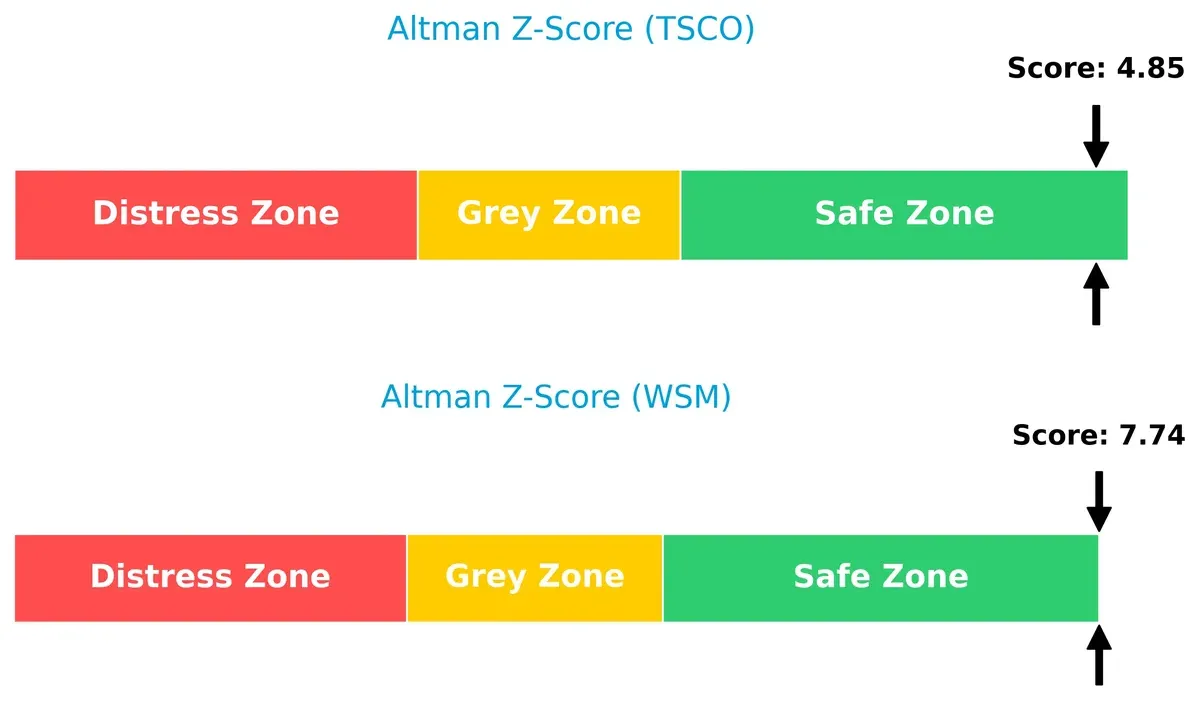
Bankruptcy Risk: Solvency Showdown
Williams-Sonoma’s Altman Z-Score of 7.74 far exceeds Tractor Supply’s 4.85, both safely above the distress threshold but indicating stronger solvency and lower bankruptcy risk for Williams-Sonoma in this cycle:
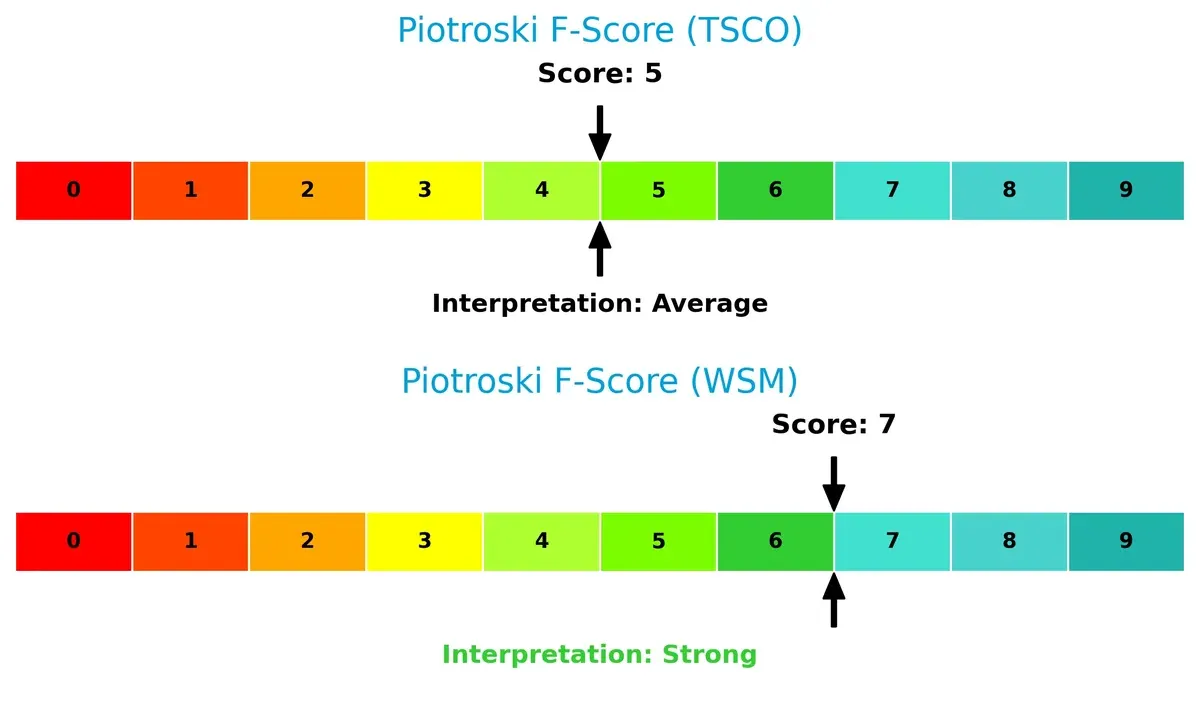
Financial Health: Quality of Operations
Williams-Sonoma’s Piotroski score of 7 signals strong financial health, outperforming Tractor Supply’s average score of 5. Tractor Supply’s lower score suggests potential red flags in operational efficiency or liquidity:
How are the two companies positioned?
This section dissects TSCO and WSM’s operational DNA by comparing revenue distribution and internal dynamics. The goal is to confront their economic moats and identify the more resilient, sustainable competitive advantage today.
Revenue Segmentation: The Strategic Mix
This visual comparison dissects how Tractor Supply Company and Williams-Sonoma diversify their income streams and reveals where their primary sector bets lie:
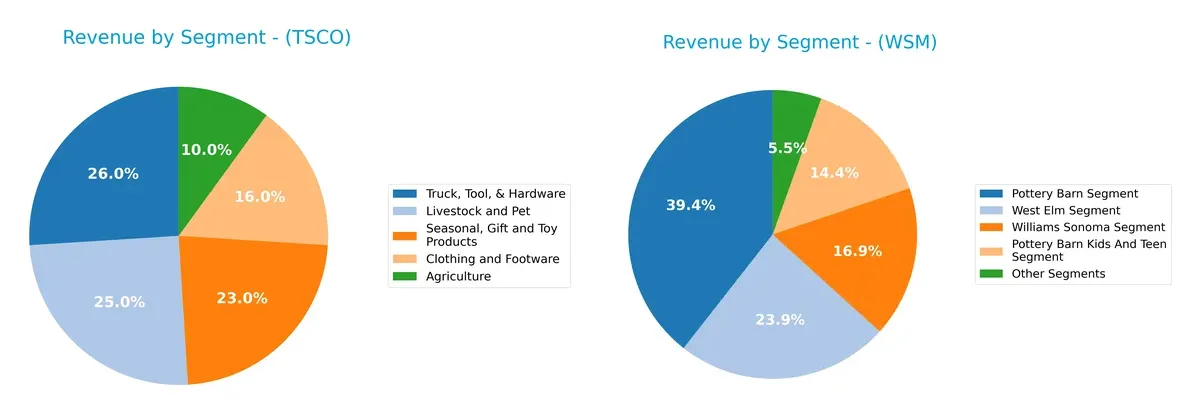
Tractor Supply Company anchors revenue in Truck, Tool, & Hardware at $3.87B, complemented by strong Livestock and Pet ($3.72B) and Clothing and Footwear ($2.38B). Williams-Sonoma leans heavily on Pottery Barn at $3.04B but balances with West Elm ($1.84B) and Williams Sonoma segment ($1.30B). TSCO’s broader diversification reduces concentration risk, while WSM’s focused lifestyle brands drive ecosystem lock-in through premium home furnishings.
Strengths and Weaknesses Comparison
This table compares the Strengths and Weaknesses of Tractor Supply Company and Williams-Sonoma, Inc.:
Tractor Supply Company Strengths
- Diverse product segments including Agriculture, Clothing, Hardware, Livestock, and Seasonal products
- Favorable ROE of 42.46% and ROIC of 13.11% above WACC
- Strong interest coverage at 21.22 and asset turnover of 1.42
Williams-Sonoma, Inc. Strengths
- Higher net margin at 14.59% and ROIC of 29.89% indicating superior profitability
- Favorable debt-to-assets ratio at 25.41% and infinite interest coverage
- Strong fixed asset turnover of 3.49 and diversified home furnishing segments
Tractor Supply Company Weaknesses
- High debt-to-assets ratio at 88.12%, indicating leverage risk
- Low quick ratio of 0.16 signals liquidity concerns
- Unfavorable debt-to-equity at 3.73 and high PB ratio at 10.27
Williams-Sonoma, Inc. Weaknesses
- Unfavorable high WACC at 11.18% increases capital costs
- Quick ratio of 0.74 below optimal liquidity levels
- Elevated PB ratio at 12.45 reflects high market valuation risk
Both companies maintain slightly favorable financial profiles but face different risks. Tractor Supply’s leverage and liquidity metrics warrant caution, while Williams-Sonoma’s higher profitability offsets its higher capital costs and valuation concerns. These factors shape each firm’s capital and operational strategies going forward.
The Moat Duel: Analyzing Competitive Defensibility
A structural moat protects long-term profits from the relentless pressure of competition. Here’s how two specialty retailers defend their turf:
Tractor Supply Company: Cost Leadership in Rural Retail
Tractor Supply leans on cost advantage and brand trust, reflected in a 6.9% ROIC above WACC but with declining profitability trends. Expansion in rural markets may deepen but also risks margin pressure in 2026.
Williams-Sonoma, Inc.: Premium Brand and Product Differentiation
Williams-Sonoma’s moat arises from intangible assets and premium branding, boasting an 18.7% ROIC well above WACC with a strong upward trend. Its omni-channel growth and luxury positioning fuel expanding margins and market reach.
Cost Efficiency vs. Brand Premium: Who Holds the Deeper Moat?
Williams-Sonoma’s wider and growing moat, driven by superior ROIC and margin expansion, outmatches Tractor Supply’s cost-focused but eroding advantage. Williams-Sonoma is better positioned to defend and grow market share in 2026.
Which stock offers better returns?
The stock price charts reveal distinct dynamics over the past 12 months, with Williams-Sonoma exhibiting a strong upward trajectory, while Tractor Supply shows moderate growth with some recent deceleration.
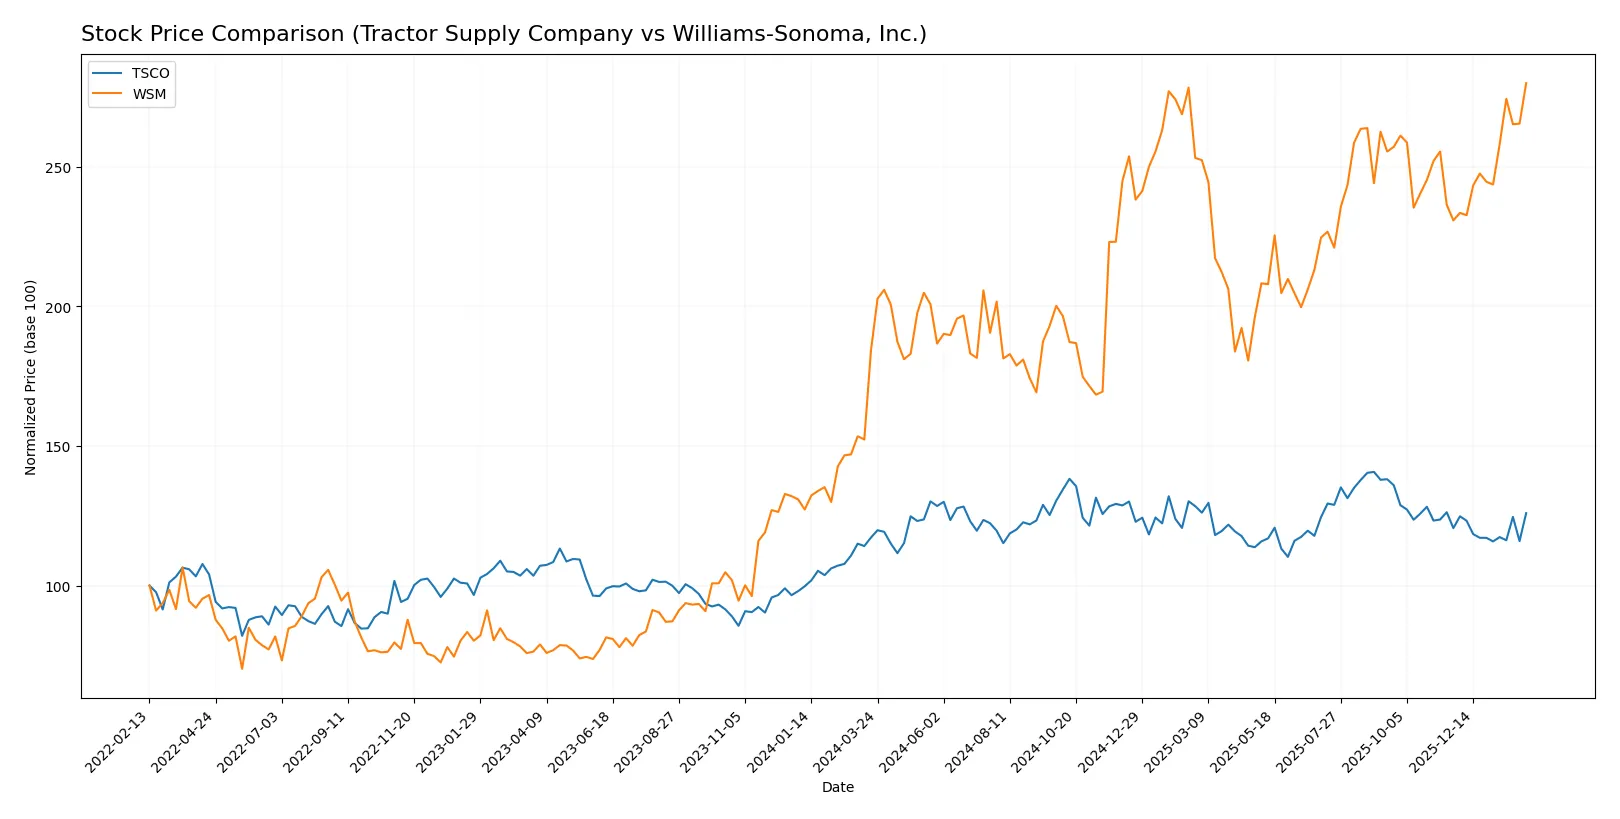
Trend Comparison
Tractor Supply Company’s stock rose 7.49% over the past year, indicating a bullish trend with decelerating momentum and a moderate volatility of 2.97. The highest price reached 61.76, the lowest was 48.4.
Williams-Sonoma’s stock surged 52.11% in the same period, reflecting a bullish trend with accelerating momentum and higher volatility at 24.55. Its price ranged from a low of 129.8 to a high of 215.83.
Williams-Sonoma outperformed Tractor Supply significantly, delivering the highest market return with an accelerating bullish trend and greater price appreciation.
Target Prices
Analysts present a constructive target price consensus for both Tractor Supply Company and Williams-Sonoma, Inc.
| Company | Target Low | Target High | Consensus |
|---|---|---|---|
| Tractor Supply Company | 50 | 67 | 59 |
| Williams-Sonoma, Inc. | 175 | 230 | 206.6 |
The consensus target for Tractor Supply sits modestly above its current price of 55.28, signaling moderate upside potential. Williams-Sonoma’s target consensus at 206.6 slightly exceeds its current price of 215.83, reflecting a cautious but generally positive market outlook.

Don’t Let Luck Decide Your Entry Point
Optimize your entry points with our advanced ProRealTime indicators. You’ll get efficient buy signals with precise price targets for maximum performance. Start outperforming now!
How do institutions grade them?
Institutional grades for Tractor Supply Company and Williams-Sonoma, Inc. are summarized as follows:
Tractor Supply Company Grades
The table below shows recent grades from major grading companies for Tractor Supply Company.
| Grading Company | Action | New Grade | Date |
|---|---|---|---|
| Argus Research | Maintain | Buy | 2026-02-02 |
| Goldman Sachs | Maintain | Buy | 2026-01-30 |
| DA Davidson | Maintain | Buy | 2026-01-30 |
| TD Cowen | Maintain | Hold | 2026-01-30 |
| JP Morgan | Maintain | Neutral | 2026-01-30 |
| Telsey Advisory Group | Maintain | Outperform | 2026-01-30 |
| Piper Sandler | Maintain | Overweight | 2026-01-30 |
| Jefferies | Maintain | Buy | 2026-01-30 |
| Mizuho | Maintain | Outperform | 2026-01-30 |
| Morgan Stanley | Maintain | Equal Weight | 2026-01-30 |
Williams-Sonoma, Inc. Grades
Below are recent grades from notable grading companies for Williams-Sonoma, Inc.
| Grading Company | Action | New Grade | Date |
|---|---|---|---|
| Evercore ISI Group | Maintain | In Line | 2026-02-03 |
| Zelman & Assoc | Upgrade | Neutral | 2026-01-29 |
| TD Cowen | Maintain | Buy | 2026-01-20 |
| Evercore ISI Group | Maintain | In Line | 2025-12-23 |
| RBC Capital | Maintain | Outperform | 2025-11-21 |
| TD Cowen | Maintain | Buy | 2025-11-20 |
| UBS | Maintain | Neutral | 2025-11-20 |
| Citigroup | Maintain | Neutral | 2025-11-20 |
| Telsey Advisory Group | Maintain | Outperform | 2025-11-20 |
| Telsey Advisory Group | Maintain | Outperform | 2025-11-19 |
Which company has the best grades?
Tractor Supply Company holds consistently bullish ratings, including multiple “Buy” and “Outperform” grades. Williams-Sonoma shows more mixed ratings with “Neutral,” “In Line,” and “Buy” grades. Tractor Supply’s stronger consensus may signal greater institutional confidence, potentially influencing investor sentiment positively.
Risks specific to each company
The following categories identify critical pressure points and systemic threats facing Tractor Supply Company and Williams-Sonoma in the 2026 market environment:
1. Market & Competition
Tractor Supply Company
- Faces intense competition in rural lifestyle retail with pressure from online and big-box players.
Williams-Sonoma, Inc.
- Competes in premium home goods with high customer expectations and digital innovation demands.
2. Capital Structure & Debt
Tractor Supply Company
- High debt-to-assets ratio at 88.1% signals leverage risk and potential financial strain.
Williams-Sonoma, Inc.
- Low debt-to-assets at 25.4% reflects a conservative capital structure and stronger balance sheet.
3. Stock Volatility
Tractor Supply Company
- Beta of 0.73 indicates lower volatility, suggesting defensive traits in cyclical markets.
Williams-Sonoma, Inc.
- Beta of 1.64 shows greater sensitivity to market swings, increasing risk in downturns.
4. Regulatory & Legal
Tractor Supply Company
- Exposure to agricultural product regulations and rural trade policies.
Williams-Sonoma, Inc.
- Faces complex international trade and consumer product regulations due to global footprint.
5. Supply Chain & Operations
Tractor Supply Company
- Supply chain vulnerabilities in rural distribution and seasonal inventory management.
Williams-Sonoma, Inc.
- Complex global supply chain with risks in sourcing premium materials and logistics delays.
6. ESG & Climate Transition
Tractor Supply Company
- Pressure to adopt sustainable farming and product sourcing practices amid increasing regulation.
Williams-Sonoma, Inc.
- Greater ESG focus required due to global operations and consumer demand for sustainability.
7. Geopolitical Exposure
Tractor Supply Company
- Primarily US-focused, limiting direct geopolitical risk but sensitive to domestic policy shifts.
Williams-Sonoma, Inc.
- Significant international presence exposes it to currency fluctuations and geopolitical tensions.
Which company shows a better risk-adjusted profile?
Williams-Sonoma’s moderate leverage and strong Altman Z-score indicate superior financial stability. Tractor Supply’s heavy debt and lower liquidity ratios elevate its financial risk. However, Williams-Sonoma’s high stock volatility and global supply chain complexity add layers of operational risk. Overall, Williams-Sonoma demonstrates a better risk-adjusted profile, supported by its safer capital structure and stronger financial health metrics, despite greater market sensitivity.
Final Verdict: Which stock to choose?
Tractor Supply Company’s superpower lies in its robust capital efficiency and impressive return on equity, signaling solid value creation. However, its heavy leverage is a point of vigilance, potentially increasing financial risk. This stock suits investors favoring aggressive growth with a tolerance for elevated debt.
Williams-Sonoma excels with a strong and growing moat driven by high return on invested capital and a conservative debt profile. Its stability and superior profitability position it as a safer choice compared to Tractor Supply. It fits well in portfolios focused on growth at a reasonable price (GARP).
If you prioritize capital efficiency and can manage leverage risk, Tractor Supply could be compelling due to its high ROE and value creation despite declining ROIC. However, if you seek durable competitive advantages with better financial stability and accelerating profit growth, Williams-Sonoma outshines as a more prudent, sustainable option.
Disclaimer: Investment carries a risk of loss of initial capital. The past performance is not a reliable indicator of future results. Be sure to understand risks before making an investment decision.
Go Further
I encourage you to read the complete analyses of Tractor Supply Company and Williams-Sonoma, Inc. to enhance your investment decisions: