In the fast-evolving semiconductor industry, Tower Semiconductor Ltd. and indie Semiconductor, Inc. stand out as innovators with distinct market approaches. Tower Semiconductor excels in analog mixed-signal foundry services, while indie Semiconductor focuses on advanced automotive chips and software solutions. Both operate in overlapping technological domains, making their comparison crucial for investors seeking growth and innovation. This article will help you decide which company offers the most compelling investment opportunity today.
Table of contents
Companies Overview
I will begin the comparison between Tower Semiconductor Ltd. and indie Semiconductor, Inc. by providing an overview of these two companies and their main differences.
Tower Semiconductor Ltd. Overview
Tower Semiconductor Ltd. is an independent semiconductor foundry specializing in analog intensive mixed-signal semiconductor devices. The company offers customizable process technologies and wafer fabrication services, serving diverse markets such as consumer electronics, automotive, industrial, aerospace, and medical devices. Headquartered in Israel, Tower has a market capitalization of approximately 13.9B USD and employs over 5,600 people.
indie Semiconductor, Inc. Overview
indie Semiconductor, Inc. focuses on automotive semiconductors and software solutions for advanced driver assistance, connected cars, and electrification. Its product portfolio includes ultrasound sensors, wireless charging, infotainment, and photonic components for optical sensing and communication. Based in California, indie Semiconductor has a market cap near 857M USD and around 920 employees, reflecting its niche specialization within the semiconductor industry.
Key similarities and differences
Both companies operate within the semiconductor sector but target distinct markets and applications. Tower Semiconductor serves a broad range of industries with diverse semiconductor fabrication services, while indie Semiconductor concentrates on automotive-related technologies and software. Tower is significantly larger in market cap and workforce, whereas indie shows higher stock price volatility, indicated by its beta of 2.54 compared to Tower’s 0.876.
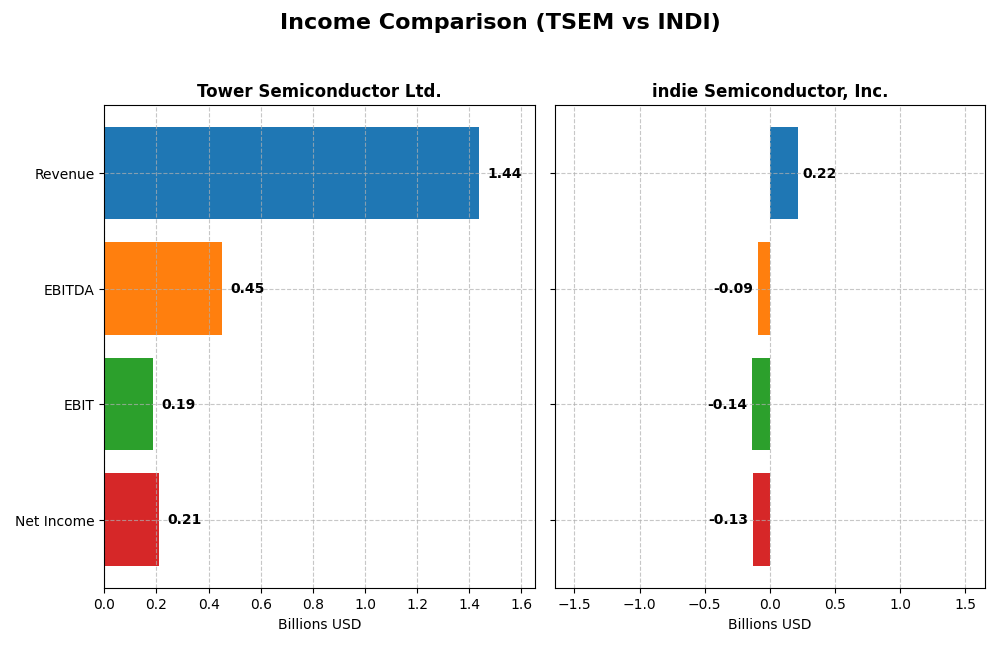
Income Statement Comparison
Below is a side-by-side comparison of the most recent fiscal year income statement metrics for Tower Semiconductor Ltd. and indie Semiconductor, Inc.
| Metric | Tower Semiconductor Ltd. | indie Semiconductor, Inc. |
|---|---|---|
| Market Cap | 13.86B | 857M |
| Revenue | 1.44B | 217M |
| EBITDA | 451M | -94M |
| EBIT | 185M | -137M |
| Net Income | 208M | -133M |
| EPS | 1.87 | -0.76 |
| Fiscal Year | 2024 | 2024 |
Income Statement Interpretations
Tower Semiconductor Ltd.
Tower Semiconductor’s revenue showed a moderate overall increase of 13.47% from 2020 to 2024, with net income growing strongly by 152.56% over the same period. Margins remained generally favorable, with a gross margin of 23.64% and net margin of 14.47% in 2024. However, revenue growth slowed to 0.94% in 2024, accompanied by declines in gross profit and EBIT margins, reflecting some margin compression last year.
indie Semiconductor, Inc.
indie Semiconductor experienced significant revenue growth of 858.35% from 2020 to 2024, but net income declined by 36.01% overall, reflecting ongoing losses. The 2024 gross margin improved markedly to 41.68%, yet EBIT and net margins remained deeply negative at -63.22% and -61.2%, respectively. Revenue decreased slightly by 2.91% in 2024, and EBIT further deteriorated, indicating continuing operating challenges.
Which one has the stronger fundamentals?
Tower Semiconductor demonstrates stronger fundamentals with sustained profitability, positive net margin, and consistent income growth despite recent margin pressures. indie Semiconductor shows robust revenue expansion but struggles with persistent losses and negative margins. Overall, Tower’s favorable income statement metrics outweigh indie’s growth in revenue but unfavorable profitability, signaling more stable earnings fundamentals.
Financial Ratios Comparison
The table below presents the most recent financial ratios for Tower Semiconductor Ltd. (TSEM) and indie Semiconductor, Inc. (INDI) for the fiscal year 2024, offering a side-by-side view of key performance and financial health metrics.
| Ratios | Tower Semiconductor Ltd. (TSEM) | indie Semiconductor, Inc. (INDI) |
|---|---|---|
| ROE | 7.83% | -31.73% |
| ROIC | 6.41% | -19.25% |
| P/E | 27.54 | -5.35 |
| P/B | 2.16 | 1.70 |
| Current Ratio | 6.18 | 4.82 |
| Quick Ratio | 5.23 | 4.23 |
| D/E | 0.068 | 0.954 |
| Debt-to-Assets | 5.87% | 42.34% |
| Interest Coverage | 32.64 | -18.37 |
| Asset Turnover | 0.47 | 0.23 |
| Fixed Asset Turnover | 1.11 | 4.30 |
| Payout ratio | 0 | 0 |
| Dividend yield | 0 | 0 |
Interpretation of the Ratios
Tower Semiconductor Ltd.
Tower Semiconductor presents a mixed ratio profile with favorable net margin (14.47%) and cost of capital (WACC 7.85%), but unfavorable return on equity (7.83%) and price-to-earnings ratio (27.54). Liquidity is uneven, with a very high current ratio (6.18, unfavorable) but a strong quick ratio (5.23). The company does not pay dividends, suggesting a reinvestment focus or growth priorities.
indie Semiconductor, Inc.
indie Semiconductor displays predominantly unfavorable ratios, including a negative net margin (-61.2%), return on equity (-31.73%), and interest coverage (-14.8), reflecting operational and profitability challenges. Asset efficiency is weak (asset turnover 0.23). The lack of dividends aligns with negative earnings and heavy R&D investment, typical for a growth-stage tech firm.
Which one has the best ratios?
Tower Semiconductor shows a slightly favorable overall ratio profile with better profitability, capital structure, and liquidity compared to indie Semiconductor, whose ratios are mostly unfavorable. While Tower’s valuation metrics and some liquidity ratios raise concerns, its financial stability and returns outperform indie’s ongoing losses and cash flow weaknesses.
Strategic Positioning
This section compares the strategic positioning of Tower Semiconductor Ltd. and indie Semiconductor, Inc., covering market position, key segments, and exposure to technological disruption:
Tower Semiconductor Ltd.
- Established independent foundry with global reach and moderate competitive pressure.
- Focused on analog intensive mixed-signal devices across diverse sectors including consumer, automotive, and aerospace.
- Provides customizable process technologies; limited direct mention of disruption exposure.
indie Semiconductor, Inc.
- Smaller market cap with higher volatility and competitive pressure in automotive semiconductors.
- Concentrated on automotive semiconductors and software for advanced driver assistance and connected car applications.
- Engages in advanced photonic and laser technologies, indicating exposure to evolving automotive tech disruption.
Tower Semiconductor Ltd. vs indie Semiconductor, Inc. Positioning
Tower offers diversified market exposure across multiple industries, providing broad revenue sources, while indie focuses on specialized automotive semiconductor and software solutions, which may limit its market scope but targets high-growth automotive technologies.
Which has the best competitive advantage?
Tower Semiconductor presents a slightly unfavorable moat with value destruction but improving profitability, while indie shows a very unfavorable moat with declining profitability, indicating Tower maintains a comparatively stronger competitive advantage.
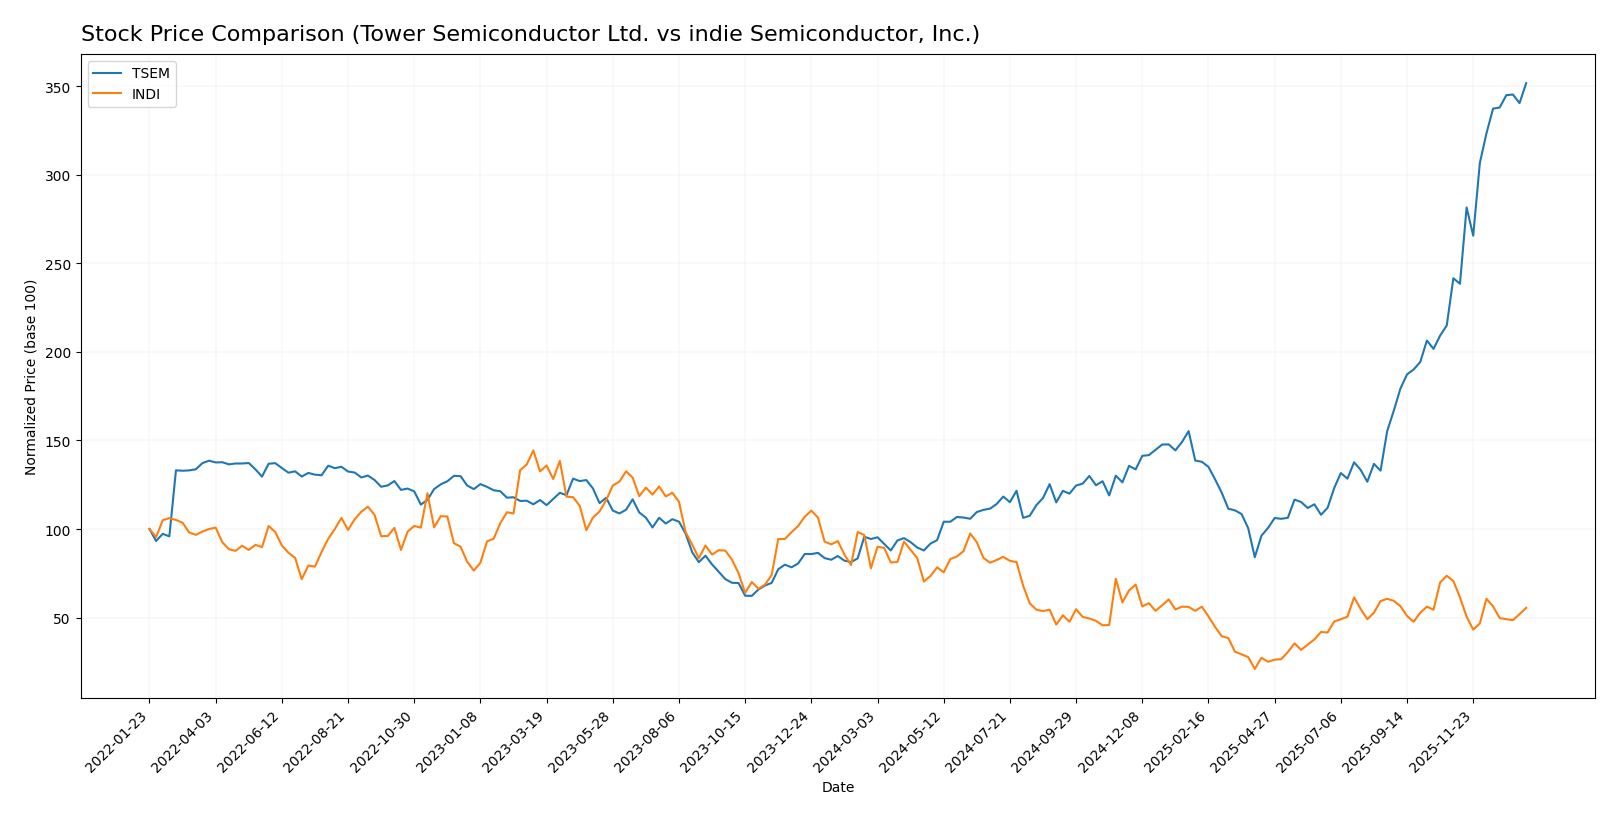
Stock Comparison
The stock price chart illustrates significant divergence in price movements and trading dynamics over the past 12 months, with Tower Semiconductor Ltd. showing strong upward momentum while indie Semiconductor, Inc. displays a declining trajectory.
Trend Analysis
Tower Semiconductor Ltd. experienced a bullish trend over the past year with a 272.71% price increase, accompanied by acceleration and notable volatility (std deviation 23.67). The stock reached a high of 124.0 and a low of 29.65.
indie Semiconductor, Inc. showed a bearish trend, with a 28.67% price decline over the same period. The trend decelerated, volatility remained low (std deviation 1.35), with prices ranging from 1.6 to 7.43.
Comparing both stocks, Tower Semiconductor Ltd. delivered the highest market performance, significantly outperforming indie Semiconductor, Inc. in price appreciation and trading momentum.
Target Prices
The current analyst consensus on target prices for these semiconductor companies reflects cautious optimism.
| Company | Target High | Target Low | Consensus |
|---|---|---|---|
| Tower Semiconductor Ltd. | 125 | 66 | 96 |
| indie Semiconductor, Inc. | 8 | 8 | 8 |
Tower Semiconductor’s target consensus at 96 USD is slightly below its current price of 124 USD, suggesting limited upside or potential overvaluation. Indie Semiconductor’s consensus target price of 8 USD significantly exceeds its current price of 4.23 USD, indicating strong expected growth from analysts.
Analyst Opinions Comparison
This section compares analysts’ ratings and grades for Tower Semiconductor Ltd. (TSEM) and indie Semiconductor, Inc. (INDI):
Rating Comparison
TSEM Rating
- Rating: B+, classified as Very Favorable by analysts.
- Discounted Cash Flow Score: Moderate score of 3, indicating a balanced valuation outlook.
- ROE Score: Moderate score of 3, showing average efficiency in generating profits from equity.
- ROA Score: Favorable score of 4, reflecting good asset utilization to generate earnings.
- Debt To Equity Score: Favorable score of 4, indicating a strong balance sheet with low risk.
- Overall Score: Moderate score of 3, representing a balanced financial standing.
INDI Rating
- Rating: C-, classified as Very Unfavorable by analysts.
- Discounted Cash Flow Score: Very Unfavorable score of 1, suggesting concerns about valuation.
- ROE Score: Very Unfavorable score of 1, indicating poor profitability efficiency.
- ROA Score: Very Unfavorable score of 1, showing weak asset effectiveness.
- Debt To Equity Score: Very Unfavorable score of 1, implying higher financial risk.
- Overall Score: Very Unfavorable score of 1, reflecting weak overall financial health.
Which one is the best rated?
Based strictly on the provided data, Tower Semiconductor Ltd. (TSEM) is clearly better rated than indie Semiconductor, Inc. (INDI). TSEM shows moderate to favorable scores across key financial metrics, while INDI’s scores are consistently very unfavorable.
Scores Comparison
The following table summarizes the Altman Z-Score and Piotroski Score for Tower Semiconductor and indie Semiconductor:
TSEM Scores
- Altman Z-Score: 21.06, indicating a safe zone with very low bankruptcy risk.
- Piotroski Score: 7, showing strong financial health and stability.
INDI Scores
- Altman Z-Score: 0.12, indicating a distress zone with high bankruptcy risk.
- Piotroski Score: 2, reflecting very weak financial strength and potential risks.
Which company has the best scores?
Based solely on the provided data, Tower Semiconductor outperforms indie Semiconductor with a significantly higher Altman Z-Score in the safe zone and a strong Piotroski Score, compared to indie’s distress zone and very weak Piotroski rating.
Grades Comparison
Here is a comparison of recent grades assigned to Tower Semiconductor Ltd. and indie Semiconductor, Inc.:
Tower Semiconductor Ltd. Grades
This table summarizes recent grades given by recognized grading companies for Tower Semiconductor Ltd.:
| Grading Company | Action | New Grade | Date |
|---|---|---|---|
| Benchmark | Maintain | Buy | 2026-01-09 |
| Wedbush | Downgrade | Neutral | 2025-12-31 |
| Benchmark | Maintain | Buy | 2025-11-11 |
| Susquehanna | Maintain | Positive | 2025-11-11 |
| Wedbush | Maintain | Outperform | 2025-11-11 |
| Barclays | Maintain | Equal Weight | 2025-11-11 |
| Benchmark | Maintain | Buy | 2025-09-08 |
| Susquehanna | Maintain | Positive | 2025-08-05 |
| Benchmark | Maintain | Buy | 2025-08-05 |
| Benchmark | Maintain | Buy | 2025-08-04 |
Overall, Tower Semiconductor Ltd. shows a generally positive trend with multiple “Buy” and “Positive” ratings, although one downgrade to “Neutral” was noted.
indie Semiconductor, Inc. Grades
The following table presents recent grades assigned to indie Semiconductor, Inc. by established grading firms:
| Grading Company | Action | New Grade | Date |
|---|---|---|---|
| UBS | Maintain | Neutral | 2025-11-10 |
| Benchmark | Maintain | Buy | 2025-06-25 |
| Benchmark | Maintain | Buy | 2025-06-11 |
| Benchmark | Maintain | Buy | 2025-05-21 |
| Benchmark | Maintain | Buy | 2025-05-13 |
| Craig-Hallum | Maintain | Buy | 2025-05-13 |
| Keybanc | Maintain | Overweight | 2025-05-13 |
| Benchmark | Maintain | Buy | 2025-04-09 |
| Benchmark | Maintain | Buy | 2025-02-21 |
| Keybanc | Maintain | Overweight | 2025-02-21 |
indie Semiconductor, Inc. maintains a predominantly “Buy” consensus with some “Overweight” ratings and one “Neutral.”
Which company has the best grades?
Both companies have a “Buy” consensus, but Tower Semiconductor Ltd. has more frequent “Buy” and positive outlooks, despite a recent downgrade by Wedbush. indie Semiconductor, Inc. shows a consistent “Buy” trend with some “Overweight” ratings and fewer downgrades. For investors, these grading patterns suggest moderately positive analyst sentiment for both, with slight differences in emphasis and consistency.
Strengths and Weaknesses
The table below compares Tower Semiconductor Ltd. (TSEM) and indie Semiconductor, Inc. (INDI) based on key financial and strategic criteria using the most recent data available.
| Criterion | Tower Semiconductor Ltd. (TSEM) | indie Semiconductor, Inc. (INDI) |
|---|---|---|
| Diversification | Moderate; focuses on semiconductor manufacturing | Limited; revenue mainly from products with smaller services segment |
| Profitability | Positive net margin (14.47%), ROIC slightly below WACC; growing profitability | Negative net margin (-61.2%), ROIC well below WACC; declining profitability |
| Innovation | Stable asset turnover with moderate investment efficiency | High fixed asset turnover indicates efficient asset use, but overall profitability weak |
| Global presence | Established with solid financial backing and low debt | Higher debt levels; less financial stability |
| Market Share | Moderate, stable market position with steady returns | Smaller market share with volatile earnings and losses |
Key takeaways: Tower Semiconductor shows a more stable financial profile with improving profitability despite a slightly unfavorable economic moat. Indie Semiconductor struggles with value destruction and declining profitability, presenting higher investment risk. Investors should weigh stability against growth potential carefully.
Risk Analysis
Below is a comparative risk table for Tower Semiconductor Ltd. (TSEM) and indie Semiconductor, Inc. (INDI) based on the most recent data from 2024.
| Metric | Tower Semiconductor Ltd. (TSEM) | indie Semiconductor, Inc. (INDI) |
|---|---|---|
| Market Risk | Moderate (Beta 0.876) | High (Beta 2.54) |
| Debt Level | Low (Debt-to-Equity 0.07, favorable) | Moderate to High (Debt-to-Equity 0.95, neutral) |
| Regulatory Risk | Moderate (Global operations with potential compliance challenges) | Moderate (US-focused automotive sector with evolving regulations) |
| Operational Risk | Low (Strong operational metrics, Piotroski score 7) | High (Weak operational metrics, Piotroski score 2) |
| Environmental Risk | Moderate (Semiconductor manufacturing impact) | Moderate (Automotive semiconductor manufacturing impact) |
| Geopolitical Risk | Moderate (Israel-based, exposure to regional tensions) | Low to Moderate (US-based, but with global supply chain dependencies) |
The most impactful and likely risks are market volatility for indie Semiconductor due to its high beta and financial distress signals, including a low Altman Z-score and weak profitability. Tower Semiconductor shows better financial stability but faces moderate geopolitical risks due to its Israel headquarters. Investors should weigh indie Semiconductor’s higher operational and financial risks against Tower Semiconductor’s more stable profile.
Which Stock to Choose?
Tower Semiconductor Ltd. (TSEM) shows a generally favorable income evolution with a 13.47% revenue growth over 2020-2024, supported by solid margins and moderate profitability. Financial ratios are slightly favorable, reflecting low debt and strong liquidity, though some valuation metrics appear less attractive. Its rating is very favorable with a B+ score, and scores indicate strong financial health with a safe Altman Z-Score.
indie Semiconductor, Inc. (INDI) presents a mixed income profile with high gross margins but negative net margins and declining profitability. Financial ratios are mostly unfavorable due to negative returns and weak coverage, despite moderate valuation ratios. Its rating is very unfavorable with a C- score, and it shows distress signals with a low Altman Z-Score and weak Piotroski score.
For investors prioritizing financial stability and consistent profitability, Tower Semiconductor might appear more favorable given its positive rating and income statement strength. Conversely, those with a higher risk tolerance or focused on rapid revenue growth might consider indie Semiconductor’s potential, despite its current financial challenges and unfavorable ratio profile.
Disclaimer: Investment carries a risk of loss of initial capital. The past performance is not a reliable indicator of future results. Be sure to understand risks before making an investment decision.
Go Further
I encourage you to read the complete analyses of Tower Semiconductor Ltd. and indie Semiconductor, Inc. to enhance your investment decisions: