In the dynamic world of entertainment, Warner Bros. Discovery, Inc. (WBD) and TKO Group Holdings, Inc. (TKO) stand out as influential players shaping content consumption globally. Both companies operate within the entertainment industry, yet they differ in scale, innovation strategies, and market focus—WBD with its diversified media portfolio and TKO’s emphasis on sports and live events. This article will guide you through their key strengths to identify the most compelling investment opportunity.
Table of contents
Companies Overview
I will begin the comparison between Warner Bros. Discovery and TKO Group Holdings by providing an overview of these two companies and their main differences.
Warner Bros. Discovery Overview
Warner Bros. Discovery, Inc. is a global media and entertainment company operating through Studios, Network, and Direct-to-Consumer (DTC) segments. It produces films and TV programs, operates domestic and international networks, and offers streaming services. The company manages a diverse portfolio of content and franchises, including HBO, DC, and Warner Bros. Games, positioning itself as a major player in entertainment distribution and streaming worldwide.
TKO Group Holdings Overview
TKO Group Holdings, Inc. is a sports and entertainment company with operations in Media and Content, Live Events, Sponsorships, and Consumer Products Licensing. It produces live sports events and video content across multiple platforms and manages merchandising, advertising, and corporate sponsorships. As a subsidiary of Endeavor Group Holdings, TKO focuses on sports entertainment with a strong presence in digital, social media, and global markets.
Key similarities and differences
Both Warner Bros. Discovery and TKO operate in the entertainment industry with diversified content offerings and global reach. Warner Bros. Discovery emphasizes film, television, and streaming services, while TKO specializes in live sports events, sponsorships, and consumer products. Additionally, Warner Bros. Discovery is much larger with 35K employees and a 70B market cap, compared to TKO’s 890 employees and 16B market cap, reflecting different scale and business models.
Income Statement Comparison
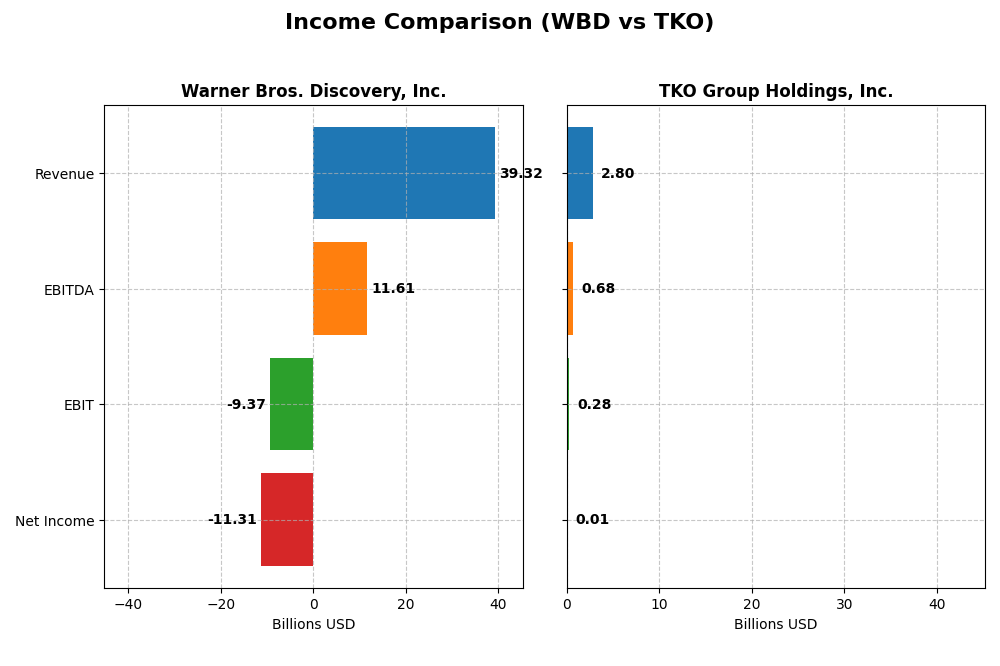
This table presents a side-by-side comparison of key income statement metrics for Warner Bros. Discovery, Inc. and TKO Group Holdings, Inc. for their most recent fiscal year.
| Metric | Warner Bros. Discovery, Inc. (WBD) | TKO Group Holdings, Inc. (TKO) |
|---|---|---|
| Market Cap | 70.4B | 16.2B |
| Revenue | 39.3B | 2.8B |
| EBITDA | 11.6B | 676M |
| EBIT | -9.4B | 283M |
| Net Income | -11.3B | 9.4M |
| EPS | -4.62 | 0.12 |
| Fiscal Year | 2024 | 2024 |
Income Statement Interpretations
Warner Bros. Discovery, Inc.
Warner Bros. Discovery showed a significant revenue increase of 268% from 2020 to 2024, but net income declined sharply, with a loss of $11.3B in 2024. Gross margin remained favorable at 41.58%, yet EBIT and net margins were negative and worsening. The latest year saw a 4.8% revenue drop and deteriorating profitability with net margin at -28.77%.
TKO Group Holdings, Inc.
TKO Group Holdings experienced strong revenue growth of 188% over 2020-2024, reaching $2.8B in 2024, with a modest net income of $9.4M. Gross and EBIT margins were favorable at 53.9% and 10.11%, respectively, while net margin was neutral at 0.34%. The latest year showed robust revenue and gross profit growth, though EBIT declined 36.5%, reflecting cost pressure.
Which one has the stronger fundamentals?
TKO demonstrates stronger fundamentals with consistent revenue growth, positive EBIT margin, and a favorable overall income statement evaluation. Warner Bros. Discovery’s revenue growth contrasts with significant net losses and negative margins, resulting in an unfavorable income statement profile. TKO’s more balanced profitability and margin stability provide comparatively stronger income fundamentals.
Financial Ratios Comparison
The table below presents a side-by-side comparison of key financial ratios for Warner Bros. Discovery, Inc. (WBD) and TKO Group Holdings, Inc. (TKO) for the fiscal year 2024.
| Ratios | Warner Bros. Discovery, Inc. (WBD) | TKO Group Holdings, Inc. (TKO) |
|---|---|---|
| ROE | -33.2% | 0.23% |
| ROIC | -11.0% | 1.28% |
| P/E | -2.29 | 1228.66 |
| P/B | 0.76 | 2.83 |
| Current Ratio | 0.89 | 1.30 |
| Quick Ratio | 0.89 | 1.30 |
| D/E | 1.26 | 0.74 |
| Debt-to-Assets | 41.1% | 23.9% |
| Interest Coverage | -4.97 | 3.11 |
| Asset Turnover | 0.38 | 0.22 |
| Fixed Asset Turnover | 6.46 | 3.48 |
| Payout ratio | 0% | 7.15% |
| Dividend yield | 0% | 0.58% |
Interpretation of the Ratios
Warner Bros. Discovery, Inc.
Warner Bros. Discovery shows mostly unfavorable financial ratios, including negative net margin (-28.77%) and return on equity (-33.23%), indicating profitability and efficiency challenges. The company’s current ratio is below 1, reflecting potential liquidity concerns. It does not pay dividends, likely due to negative earnings and a focus on restructuring or reinvestment. No share buybacks are noted.
TKO Group Holdings, Inc.
TKO presents a mixed picture with slightly unfavorable overall ratios; it has a positive but very low net margin (0.34%) and return on equity (0.23%), suggesting limited profitability. The company pays dividends with a low yield (0.58%), and its payout appears cautious given modest earnings. TKO’s debt levels are favorable, and liquidity ratios are neutral to positive, but interest coverage remains weak.
Which one has the best ratios?
Between the two, TKO holds a slightly more favorable ratio profile with better liquidity, lower debt burden, and some dividend payments despite low profitability. Warner Bros. Discovery faces more pronounced profitability and liquidity issues, reflected in a majority of unfavorable ratios. Overall, TKO’s ratios suggest marginally better financial stability.
Strategic Positioning
This section compares the strategic positioning of Warner Bros. Discovery, Inc. (WBD) and TKO Group Holdings, Inc. (TKO), focusing on Market position, Key segments, and exposure to technological disruption:
Warner Bros. Discovery, Inc.
- Large market cap (~70B USD) with diversified entertainment segments; faces competitive pressure in media
- Key segments include studios, network TV, and direct-to-consumer streaming services
- Operates multiple streaming and network platforms; exposure to digital distribution and gaming
TKO Group Holdings, Inc.
- Smaller market cap (~16B USD), focused on sports and entertainment; competes in live events and media
- Operates through media, live events, sponsorships, and consumer products licensing
- Produces live events and digital content; exposure through digital and social media platforms
Warner Bros. Discovery, Inc. vs TKO Group Holdings, Inc. Positioning
WBD pursues a diversified strategy with multiple entertainment segments including streaming and gaming, offering broad revenue streams but higher complexity. TKO concentrates on sports and live events with focused media and licensing operations, potentially limiting diversification but simplifying management.
Which has the best competitive advantage?
Both companies show very unfavorable MOAT evaluations with declining ROIC below WACC, indicating value destruction and weak competitive advantage, with WBD showing a larger negative gap and steeper ROIC decline compared to TKO.
Stock Comparison
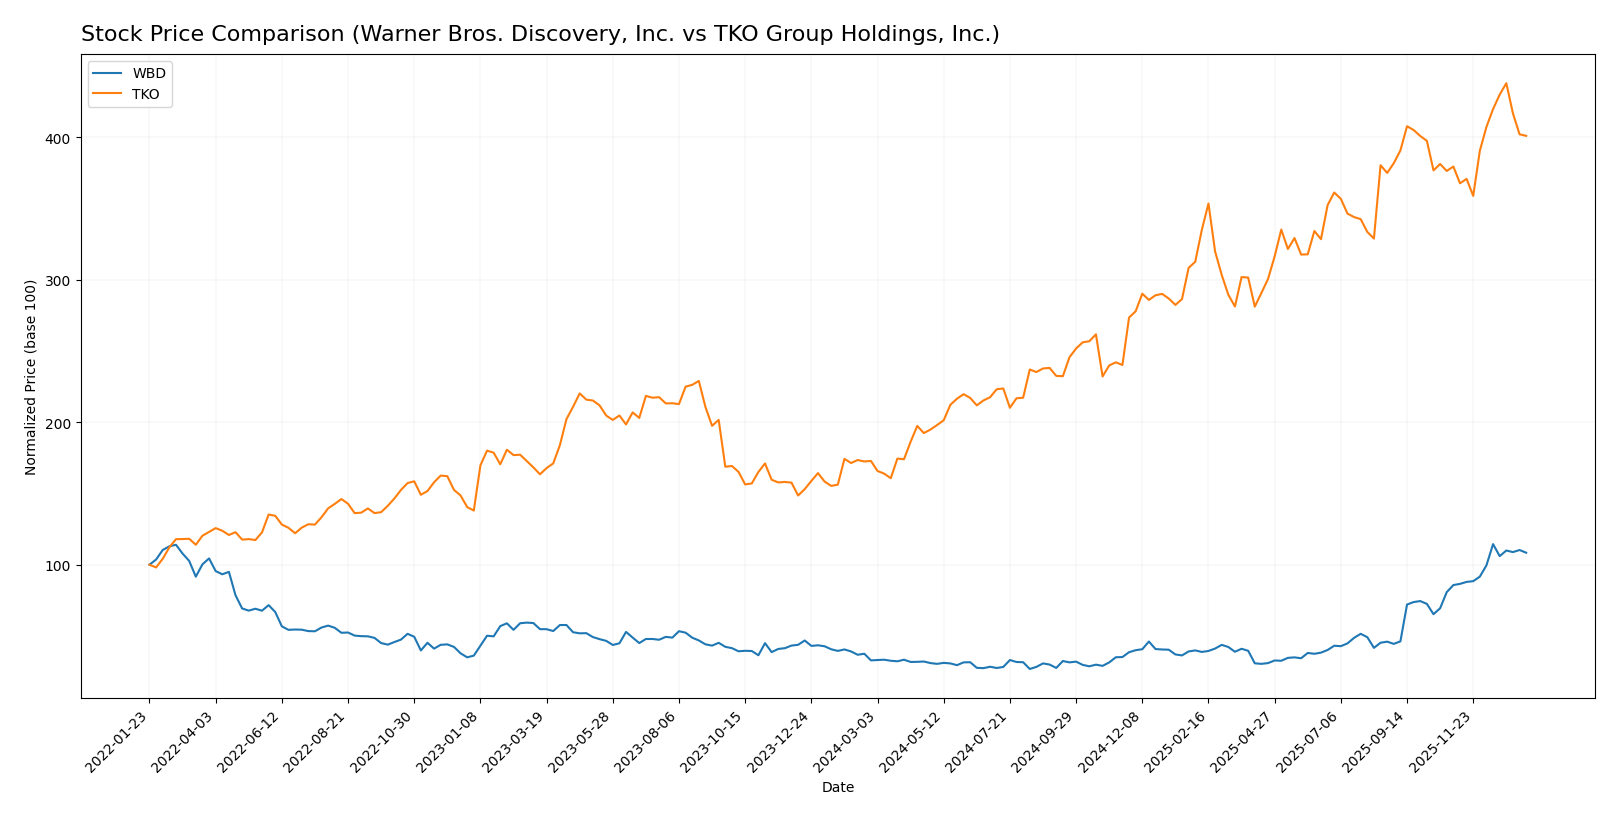
The stock price chart highlights significant bullish momentum for both Warner Bros. Discovery, Inc. and TKO Group Holdings, Inc. over the past year, with Warner Bros. Discovery showing stronger acceleration and higher price appreciation.
Trend Analysis
Warner Bros. Discovery, Inc. experienced a 229.85% price increase over the past 12 months, indicating a strong bullish trend with accelerating gains and a standard deviation of 6.02. The stock reached a high of 29.98 and a low of 7.03.
TKO Group Holdings, Inc. recorded a 132.01% price increase over the same period, also reflecting a bullish and accelerating trend but with higher volatility, shown by a 36.57 standard deviation. Its price ranged from 79.79 to 217.44.
Comparing the two, Warner Bros. Discovery delivered the highest market performance over the past year, outperforming TKO Group Holdings in overall price appreciation and exhibiting steadier volatility.
Target Prices
Analysts present a clear consensus on target prices for Warner Bros. Discovery, Inc. and TKO Group Holdings, Inc.
| Company | Target High | Target Low | Consensus |
|---|---|---|---|
| Warner Bros. Discovery, Inc. | 29.5 | 16 | 23.68 |
| TKO Group Holdings, Inc. | 250 | 210 | 228.1 |
The consensus target prices for both companies suggest potential upside for Warner Bros. Discovery, currently trading near 28.4, and a significant expected increase for TKO, trading below its consensus at 199.09.
Analyst Opinions Comparison
This section compares analysts’ ratings and grades for Warner Bros. Discovery, Inc. (WBD) and TKO Group Holdings, Inc. (TKO):
Rating Comparison
WBD Rating
- Rating: B- with a very favorable status.
- Discounted Cash Flow Score: 3, moderate valuation.
- ROE Score: 2, moderate efficiency in equity use.
- ROA Score: 2, moderate asset utilization.
- Debt To Equity Score: 4, favorable lower financial risk.
- Overall Score: 3, moderate overall financial standing.
TKO Rating
- Rating: B- with a very favorable status.
- Discounted Cash Flow Score: 4, favorable valuation.
- ROE Score: 3, moderate efficiency in equity use.
- ROA Score: 3, moderate asset utilization.
- Debt To Equity Score: 2, moderate financial risk.
- Overall Score: 2, moderate overall financial standing.
Which one is the best rated?
Both WBD and TKO have a B- rating with very favorable status. WBD scores higher on overall and debt-to-equity metrics, indicating stronger financial stability, while TKO leads in discounted cash flow, ROE, and ROA scores.
Scores Comparison
The scores comparison for Warner Bros. Discovery, Inc. and TKO Group Holdings, Inc. is as follows:
WBD Scores
- Altman Z-Score: 0.88, distress zone indicating high bankruptcy risk.
- Piotroski Score: 8, very strong financial health rating.
TKO Scores
- Altman Z-Score: 2.17, grey zone indicating moderate bankruptcy risk.
- Piotroski Score: 6, average financial health rating.
Which company has the best scores?
Based on the provided data, WBD has a stronger Piotroski Score indicating better financial health, while TKO has a safer Altman Z-Score suggesting lower bankruptcy risk. Neither company outperforms the other across both scores.
Grades Comparison
Here is a comparison of recent grades assigned to Warner Bros. Discovery, Inc. and TKO Group Holdings, Inc.:
Warner Bros. Discovery, Inc. Grades
The following table summarizes recent grades from established grading companies for Warner Bros. Discovery, Inc.:
| Grading Company | Action | New Grade | Date |
|---|---|---|---|
| Seaport Global | Downgrade | Neutral | 2025-12-09 |
| Benchmark | Maintain | Buy | 2025-12-08 |
| Barrington Research | Downgrade | Market Perform | 2025-12-05 |
| Barrington Research | Maintain | Outperform | 2025-11-14 |
| Wells Fargo | Maintain | Equal Weight | 2025-11-07 |
| Rothschild & Co | Upgrade | Buy | 2025-10-30 |
| Argus Research | Upgrade | Buy | 2025-10-28 |
| Barrington Research | Maintain | Outperform | 2025-10-28 |
| Benchmark | Maintain | Buy | 2025-10-22 |
| Wells Fargo | Maintain | Equal Weight | 2025-10-16 |
The overall trend for Warner Bros. Discovery shows a mixed rating pattern with several downgrades balanced by upgrades and consistent hold or outperform views.
TKO Group Holdings, Inc. Grades
Below is a table compiling recent grades from reputable grading firms for TKO Group Holdings, Inc.:
| Grading Company | Action | New Grade | Date |
|---|---|---|---|
| BTIG | Maintain | Buy | 2025-12-31 |
| Susquehanna | Maintain | Positive | 2025-12-10 |
| TD Cowen | Maintain | Buy | 2025-12-08 |
| JP Morgan | Maintain | Overweight | 2025-12-02 |
| BTIG | Maintain | Buy | 2025-11-18 |
| Seaport Global | Upgrade | Buy | 2025-10-15 |
| BTIG | Maintain | Buy | 2025-10-10 |
| Bernstein | Maintain | Outperform | 2025-10-06 |
| Guggenheim | Maintain | Buy | 2025-10-03 |
| Morgan Stanley | Maintain | Equal Weight | 2025-09-25 |
TKO Group Holdings’ grades consistently indicate positive sentiment, with numerous buy and outperform ratings and no downgrades.
Which company has the best grades?
TKO Group Holdings holds notably stronger and more consistent buy and outperform ratings compared to Warner Bros. Discovery’s mixed and sometimes downgraded grades. This suggests TKO is viewed more favorably by analysts, potentially impacting investor confidence and perceived growth prospects.
Strengths and Weaknesses
Below is a comparison table summarizing the recent strengths and weaknesses of Warner Bros. Discovery, Inc. (WBD) and TKO Group Holdings, Inc. (TKO) based on diversification, profitability, innovation, global presence, and market share.
| Criterion | Warner Bros. Discovery, Inc. (WBD) | TKO Group Holdings, Inc. (TKO) |
|---|---|---|
| Diversification | High – multiple revenue streams including advertising (8.1B), distribution (19.7B), content licensing (10.3B), and services | Limited – primarily focused on gaming and esports with less product variety |
| Profitability | Weak – negative net margin (-28.77%) and ROIC (-11%), value destroying | Weak – very slim positive net margin (0.34%) and low ROIC (1.28%), also value destroying |
| Innovation | Moderate – strong content pipeline but declining ROIC suggests challenges | Moderate – innovative in esports but profitability concerns limit growth potential |
| Global presence | Strong – global networks and distribution channels | Moderate – growing international presence but less extensive than WBD |
| Market Share | Large – established in entertainment and media industries | Small to moderate – niche market in esports and gaming |
Key takeaways: Both companies face profitability challenges with declining ROIC and value destruction. WBD benefits from greater diversification and global reach, while TKO’s niche focus offers growth opportunities but also risks due to limited scale and profitability. Caution is advised for investors given the unfavorable financial metrics.
Risk Analysis
Below is a table summarizing key risks for Warner Bros. Discovery, Inc. (WBD) and TKO Group Holdings, Inc. (TKO) based on the most recent financial and market data from 2024.
| Metric | Warner Bros. Discovery, Inc. (WBD) | TKO Group Holdings, Inc. (TKO) |
|---|---|---|
| Market Risk | High beta (1.57) indicates higher volatility and sensitivity to market swings. | Low beta (0.23) suggests lower market volatility exposure. |
| Debt level | Elevated debt-to-equity ratio (1.26) and interest coverage negative (-4.65) reflect high leverage and difficulty covering interest. | Moderate debt-to-equity (0.74) with weak interest coverage (1.14) indicates manageable but cautious debt levels. |
| Regulatory Risk | Medium, typical for US media companies with evolving content and distribution regulations. | Medium, similar regulatory environment in entertainment and live events sectors. |
| Operational Risk | Negative net margin (-28.77%) and ROE (-33.23%) highlight operational inefficiencies and profitability challenges. | Low net margin (0.34%) and ROE (0.23%) show limited profitability but less severe operational strain. |
| Environmental Risk | Moderate, with growing industry focus on sustainability but no major environmental liabilities reported. | Low to moderate, less exposure due to business model focused on events and licensing. |
| Geopolitical Risk | Moderate, exposure through international content distribution but US-centric operations. | Moderate, global event production in 170 countries increases geopolitical exposure. |
The most impactful risks for WBD are its high leverage with negative interest coverage and operational losses, which raise bankruptcy concerns (Altman Z-Score in distress zone). TKO shows better financial stability (Altman Z-Score in grey zone) but faces profitability challenges with very high P/E ratios, signaling market uncertainty or growth expectations. Investors should weigh WBD’s financial distress risk against TKO’s valuation risk carefully.
Which Stock to Choose?
Warner Bros. Discovery, Inc. (WBD) shows a declining income trend with unfavorable profitability ratios, including a negative net margin of -28.77% and ROE of -33.23%. The company carries significant debt and a low current ratio, with a very unfavorable overall financial ratios evaluation and a B- rating.
TKO Group Holdings, Inc. (TKO) exhibits favorable income growth and a positive gross margin of 53.9%, but profitability ratios remain weak with a net margin around 0.34%. Its debt levels are moderate with a neutral to favorable financial ratio profile, and it holds a B- rating as well.
For investors, WBD might appear more attractive for those willing to tolerate higher risk given its unfavorable income and ratio trends but very favorable rating. Conversely, TKO could be seen as more suitable for those seeking some income growth with a slightly better moat outlook despite only moderate ratings. The choice might depend on whether the investor prioritizes growth potential or financial stability.
Disclaimer: Investment carries a risk of loss of initial capital. The past performance is not a reliable indicator of future results. Be sure to understand risks before making an investment decision.
Go Further
I encourage you to read the complete analyses of Warner Bros. Discovery, Inc. and TKO Group Holdings, Inc. to enhance your investment decisions: