Home > Comparison > Healthcare > TMO vs WAT
The strategic rivalry between Thermo Fisher Scientific Inc. and Waters Corporation shapes the future of the healthcare diagnostics and research sector. Thermo Fisher operates as a broad, capital-intensive life sciences solutions provider with global scale. In contrast, Waters focuses on high-precision analytical instruments and software with a specialty measurement niche. This analysis will clarify which company’s business model delivers a superior risk-adjusted return for a diversified portfolio amid evolving sector dynamics.
Table of contents
Companies Overview
Thermo Fisher Scientific and Waters Corporation stand as pivotal players in medical diagnostics and research instrumentation.
Thermo Fisher Scientific Inc.: Global Life Sciences Powerhouse
Thermo Fisher Scientific dominates the life sciences sector with a comprehensive portfolio across diagnostics, instruments, and biopharma services. Its core revenue derives from reagents, instruments, and consumables targeting drug discovery, vaccines, and clinical diagnostics. In 2026, it sharpens its focus on expanding its global footprint and integrating advanced biopharma solutions to sustain growth.
Waters Corporation: Specialty Analytical Innovator
Waters Corporation specializes in high-performance liquid chromatography and mass spectrometry systems. Its revenue engine centers on selling and servicing analytical instruments that support drug development, environmental testing, and quality assurance. Waters prioritizes innovation in instrument technology and software integration to enhance analytical workflows across global markets.
Strategic Collision: Similarities & Divergences
Both companies serve the medical diagnostics and research markets but with distinct approaches. Thermo Fisher leverages a broad, integrated ecosystem spanning instruments and biopharma services. Waters focuses narrowly on specialty measurement technology and software. Their primary battleground is the pharmaceutical and life science research sector, where instrument precision and service quality drive market share. Thermo Fisher offers scale and diversification, while Waters provides specialized technological depth.
Income Statement Comparison
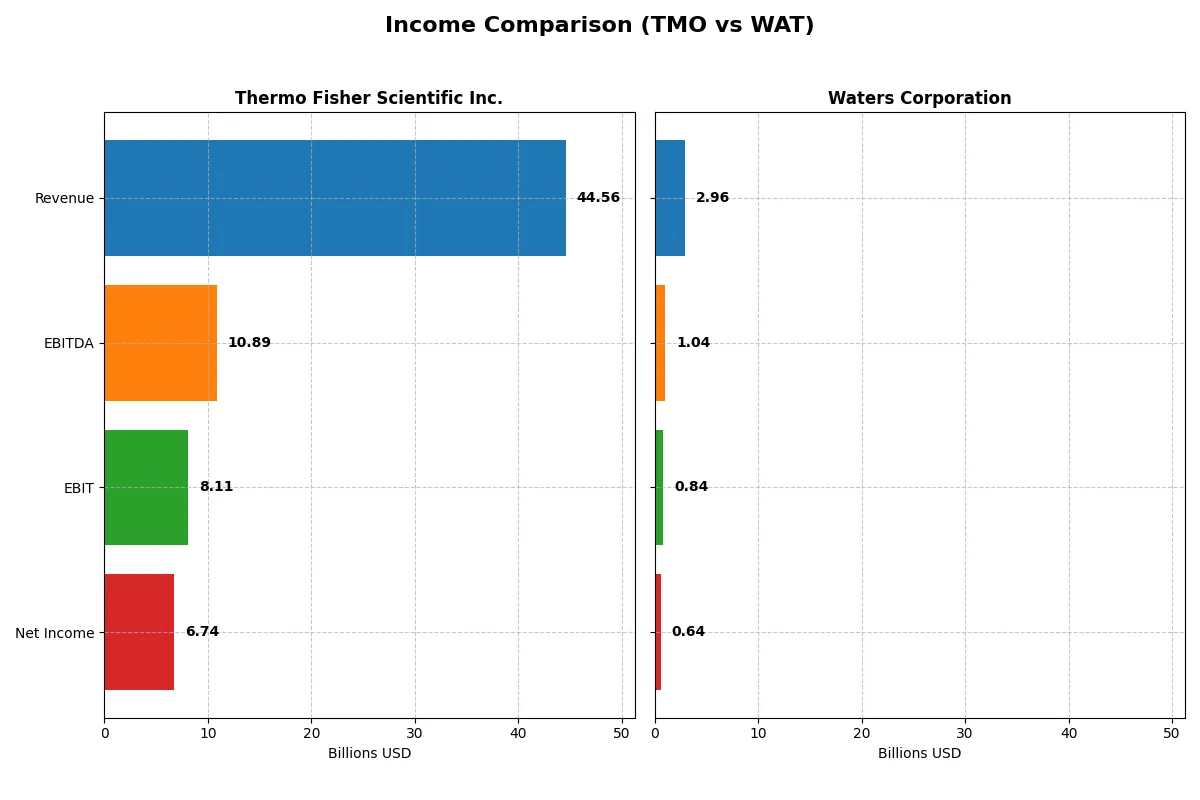
This data dissects the core profitability and scalability of both corporate engines to reveal who dominates the bottom line:
| Metric | Thermo Fisher Scientific Inc. (TMO) | Waters Corporation (WAT) |
|---|---|---|
| Revenue | 44.6B | 2.96B |
| Cost of Revenue | 27.8B | 1.20B |
| Operating Expenses | 8.67B | 932M |
| Gross Profit | 16.8B | 1.76B |
| EBITDA | 10.9B | 1.04B |
| EBIT | 8.11B | 845M |
| Interest Expense | 1.42B | 90M |
| Net Income | 6.74B | 638M |
| EPS | 17.77 | 10.75 |
| Fiscal Year | 2025 | 2024 |
Income Statement Analysis: The Bottom-Line Duel
This income statement comparison reveals which company runs a more efficient and profitable corporate engine based on recent financial performance.
Thermo Fisher Scientific Inc. Analysis
Thermo Fisher’s revenue grew modestly to $44.6B in 2025, while net income slid to $6.73B, reflecting margin pressure. Gross margin contracted to 37.7%, and net margin held at a solid 15.1%. Despite a slight decline in operating profit, the company maintains strong scale and consistent profitability with improving EPS momentum.
Waters Corporation Analysis
Waters posted nearly flat revenue at $2.96B in 2024, with net income dipping slightly to $638M. The firm boasts robust margins, with a 59.4% gross margin and a 21.6% net margin, indicating superior cost control. However, growth stagnated, and recent EPS trends show a mild downturn, signaling challenges sustaining momentum.
Margin Strength vs. Revenue Scale
Thermo Fisher leverages larger revenue scale but faces margin erosion, while Waters excels in profitability metrics despite revenue stagnation. Thermo Fisher’s sheer size drives absolute profits higher, but Waters’ margin profile offers greater efficiency. Investors seeking growth may prefer Thermo Fisher’s scale, while margin-focused profiles favor Waters’ disciplined cost structure.
Financial Ratios Comparison
These vital ratios act as a diagnostic tool to expose the underlying fiscal health, valuation premiums, and capital efficiency of the companies compared below:
| Ratios | Thermo Fisher Scientific Inc. (TMO) | Waters Corporation (WAT) |
|---|---|---|
| ROE | 12.6% | 34.9% |
| ROIC | 7.6% | 18.4% |
| P/E | 32.3 | 34.5 |
| P/B | 4.08 | 12.04 |
| Current Ratio | 1.89 | 2.11 |
| Quick Ratio | 1.53 | 1.51 |
| D/E (Debt-to-Equity) | 0.74 | 0.93 |
| Debt-to-Assets | 35.7% | 37.4% |
| Interest Coverage | 5.71 | 9.21 |
| Asset Turnover | 0.40 | 0.65 |
| Fixed Asset Turnover | 4.22 | 4.08 |
| Payout Ratio | 9.4% | 0% |
| Dividend Yield | 0.29% | 0% |
| Fiscal Year | 2025 | 2024 |
Efficiency & Valuation Duel: The Vital Signs
Financial ratios act as the company’s DNA, exposing hidden risks and operational prowess that shape investor confidence and valuation.
Thermo Fisher Scientific Inc.
Thermo Fisher exhibits a solid net margin of 15.12% and an ROE of 12.61%, signaling moderate profitability. Its P/E of 32.34 and P/B of 4.08 suggest the stock is somewhat stretched versus typical sector benchmarks. The company maintains a modest 0.29% dividend yield, indicating limited shareholder returns but potential reinvestment in R&D to fuel growth.
Waters Corporation
Waters Corporation delivers stronger profitability with a 21.56% net margin and a robust 34.88% ROE. Despite a higher P/E of 34.51 and a steep P/B of 12.04, the valuation reflects premium pricing. Waters pays no dividends, opting instead to reinvest heavily in R&D, supporting its aggressive growth and operational efficiency.
Premium Valuation vs. Operational Safety
Waters commands higher profitability and operational efficiency but trades at a more stretched valuation than Thermo Fisher. Thermo Fisher offers steadier returns with a cautious capital structure. Investors seeking growth might favor Waters, while those prioritizing stability could lean toward Thermo Fisher.
Which one offers the Superior Shareholder Reward?
I observe Thermo Fisher Scientific (TMO) pays a modest 0.29% dividend yield with a conservative 9.4% payout ratio, well-covered by free cash flow (FCF). TMO complements dividends with steady buybacks, balancing yield and capital return sustainably. Waters Corporation (WAT) pays no dividends, reinvesting all FCF into growth and acquisitions, fueling a higher asset turnover and margin profile. However, WAT’s buyback program is less consistent, and its higher financial leverage raises risk. I find TMO’s disciplined dividend-plus-buyback strategy offers a more attractive, sustainable total return in 2026 compared to WAT’s aggressive reinvestment without shareholder distributions.
Comparative Score Analysis: The Strategic Profile
The radar chart reveals the fundamental DNA and trade-offs of Thermo Fisher Scientific Inc. and Waters Corporation, highlighting their financial strengths and vulnerabilities:
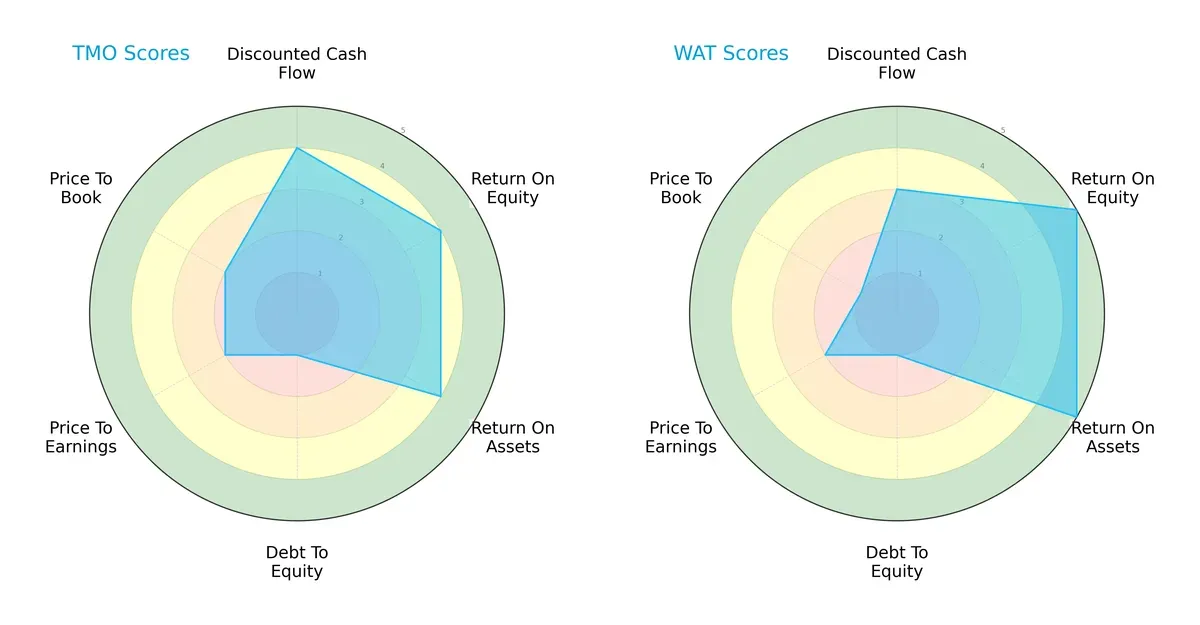
Thermo Fisher shows strength in discounted cash flow (4), ROE (4), and ROA (4), but a weak debt-to-equity score (1) signals higher leverage risk. Waters boasts superior ROE (5) and ROA (5), indicating efficient asset utilization, yet it shares the same poor debt profile (1) and scores lower on price-to-book (1). Overall, Waters leans on operational efficiency, while Thermo Fisher balances valuation and profitability metrics more evenly.
Bankruptcy Risk: Solvency Showdown
The Altman Z-Score gap between Thermo Fisher (3.09) and Waters (9.54) highlights contrasting solvency:
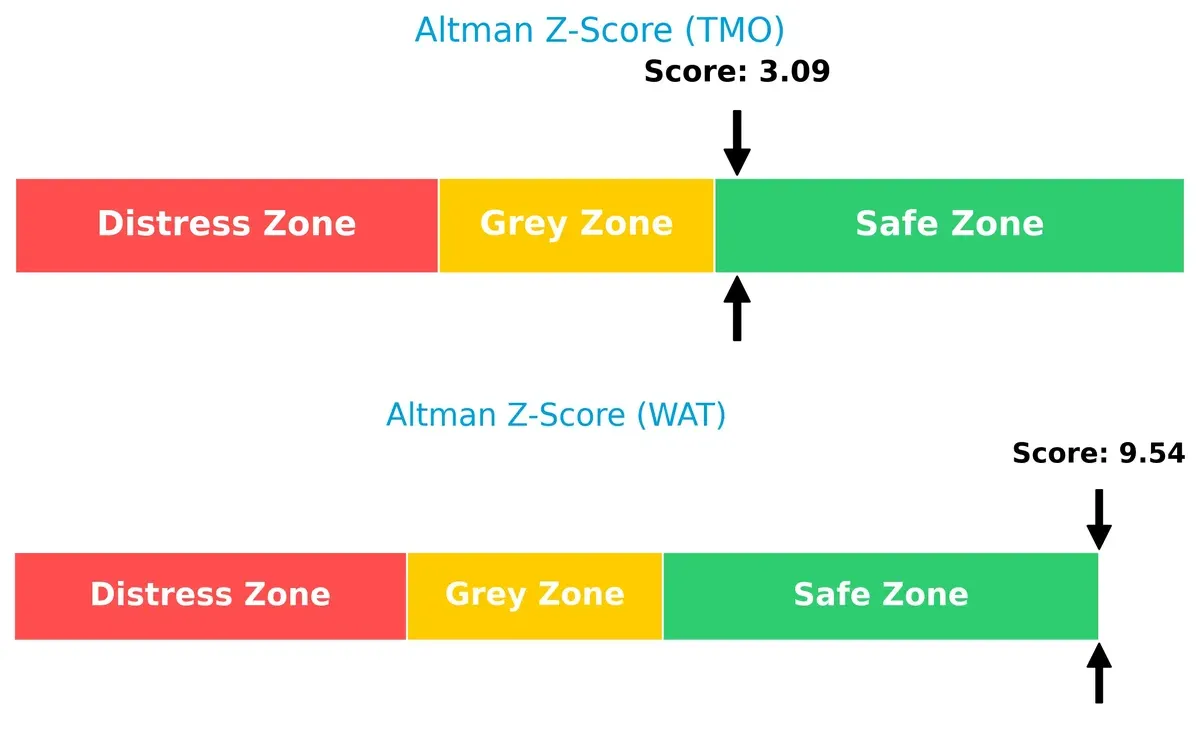
Both firms sit safely above distress thresholds. However, Waters’ exceptionally high score signals robust financial resilience, while Thermo Fisher’s moderate safe-zone score suggests more caution warranted in turbulent cycles.
Financial Health: Quality of Operations
Both companies share identical Piotroski F-Scores of 6, reflecting average financial health:
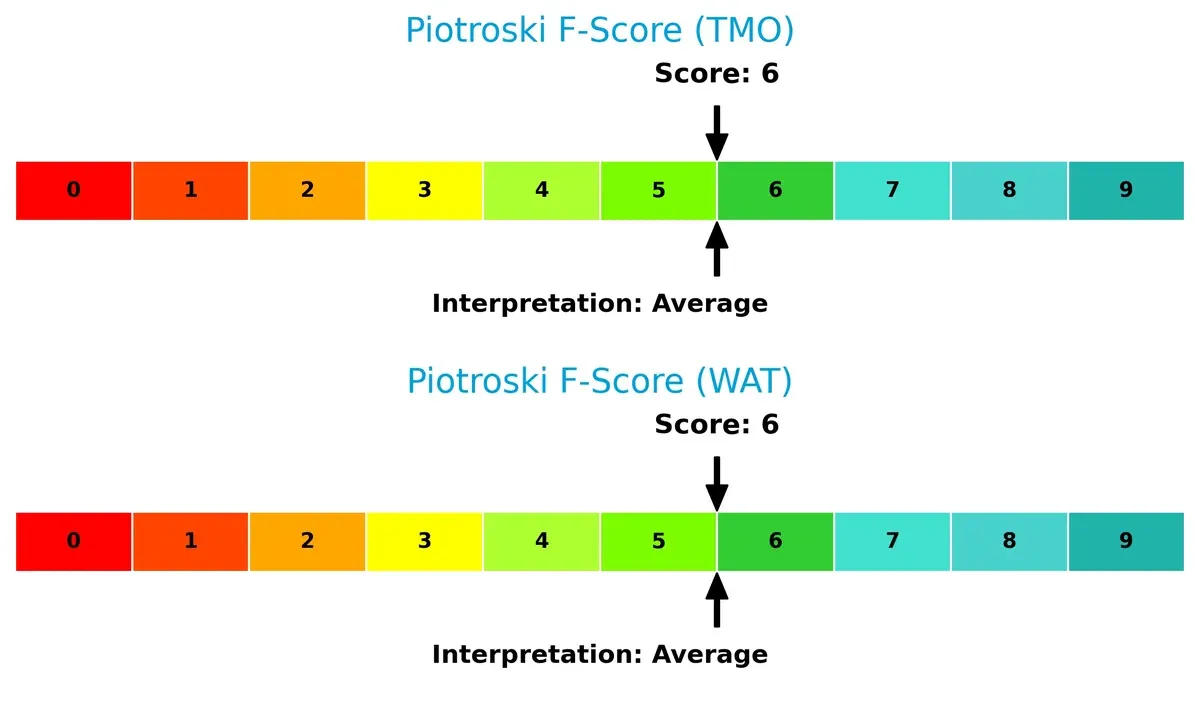
Neither firm shows immediate red flags, but both could improve internal efficiency and profitability metrics to reach a “strong” status. Investors should watch for signs of operational strain or capital allocation missteps.
How are the two companies positioned?
This section dissects the operational DNA of Thermo Fisher Scientific and Waters by comparing their revenue distribution and internal dynamics. The goal is to confront their economic moats and identify which model offers the most resilient competitive advantage today.
Revenue Segmentation: The Strategic Mix
This visual comparison dissects how Thermo Fisher Scientific and Waters Corporation diversify their income streams and reveals where their primary sector bets lie:
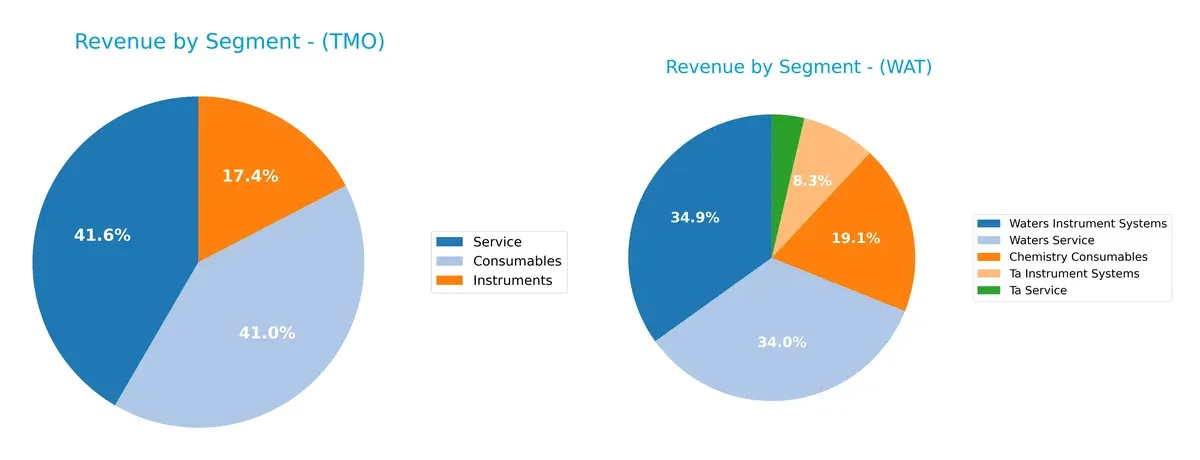
Thermo Fisher dominates with a balanced revenue mix: $17.6B in Consumables, $7.4B in Instruments, and $17.8B in Service. Waters relies heavily on Waters Instrument Systems at $1.0B, anchoring its portfolio, with smaller contributions from Chemistry Consumables ($565M) and Ta segments. Thermo Fisher’s diversification reduces concentration risk, while Waters’ focus on instruments and related services suggests dependence on niche market cycles and infrastructure dominance.
Strengths and Weaknesses Comparison
This table compares the Strengths and Weaknesses of Thermo Fisher Scientific Inc. (TMO) and Waters Corporation (WAT):
TMO Strengths
- Diversified revenue streams across Consumables, Instruments, and Services
- Strong global presence with significant US and European markets
- Favorable current and quick ratios indicating liquidity
- Interest coverage ratio signals solid ability to service debt
- Neutral ROIC close to WACC suggests efficient capital use
WAT Strengths
- Higher net margin and ROE indicating strong profitability
- Favorable ROIC well above WACC indicates value creation
- Good liquidity metrics with favorable current and quick ratios
- Strong interest coverage ratio reflects debt service capacity
- Balanced geographic sales across Americas, Asia Pacific, Europe
TMO Weaknesses
- Unfavorable P/E and P/B ratios may reflect overvaluation concerns
- Asset turnover lower than peers suggests less efficient asset use
- Dividend yield considered low, reducing income appeal
- Neutral debt-to-equity and debt-to-assets ratios show moderate leverage
WAT Weaknesses
- Unfavorable P/E and P/B ratios raise valuation questions
- Zero dividend yield may deter income-focused investors
- Neutral debt metrics indicate moderate financial risk
- Asset turnover neutral but not a standout efficiency metric
Overall, TMO’s broad diversification and global scale provide stability but face valuation and efficiency challenges. WAT excels in profitability and capital returns but must address high valuation and lack of dividend yield. Both companies maintain slightly favorable financial health, shaping distinct strategic focuses.
The Moat Duel: Analyzing Competitive Defensibility
A structural moat is the only thing protecting long-term profits from the erosion of competition. Let’s examine how these two firms defend their turf:
Thermo Fisher Scientific Inc.: Scale and Integration Moat
Thermo Fisher’s advantage lies in its vast product ecosystem and scale, driving stable margins near 37.7% gross and 15.1% net. However, declining ROIC warns of margin pressure by 2026.
Waters Corporation: High-Margin Specialty Niche
Waters leverages a cost and technology moat via specialized chromatography and mass spectrometry products, sustaining 59.4% gross and 21.6% net margins. Despite a strong moat, declining ROIC signals emerging competitive pressures.
Verdict: Scale Integration vs. Specialty Technology
Waters commands a wider moat with higher margins and value creation, though both firms face margin compression. I believe Waters is better positioned to defend market share due to its focused technology edge and superior capital efficiency.
Which stock offers better returns?
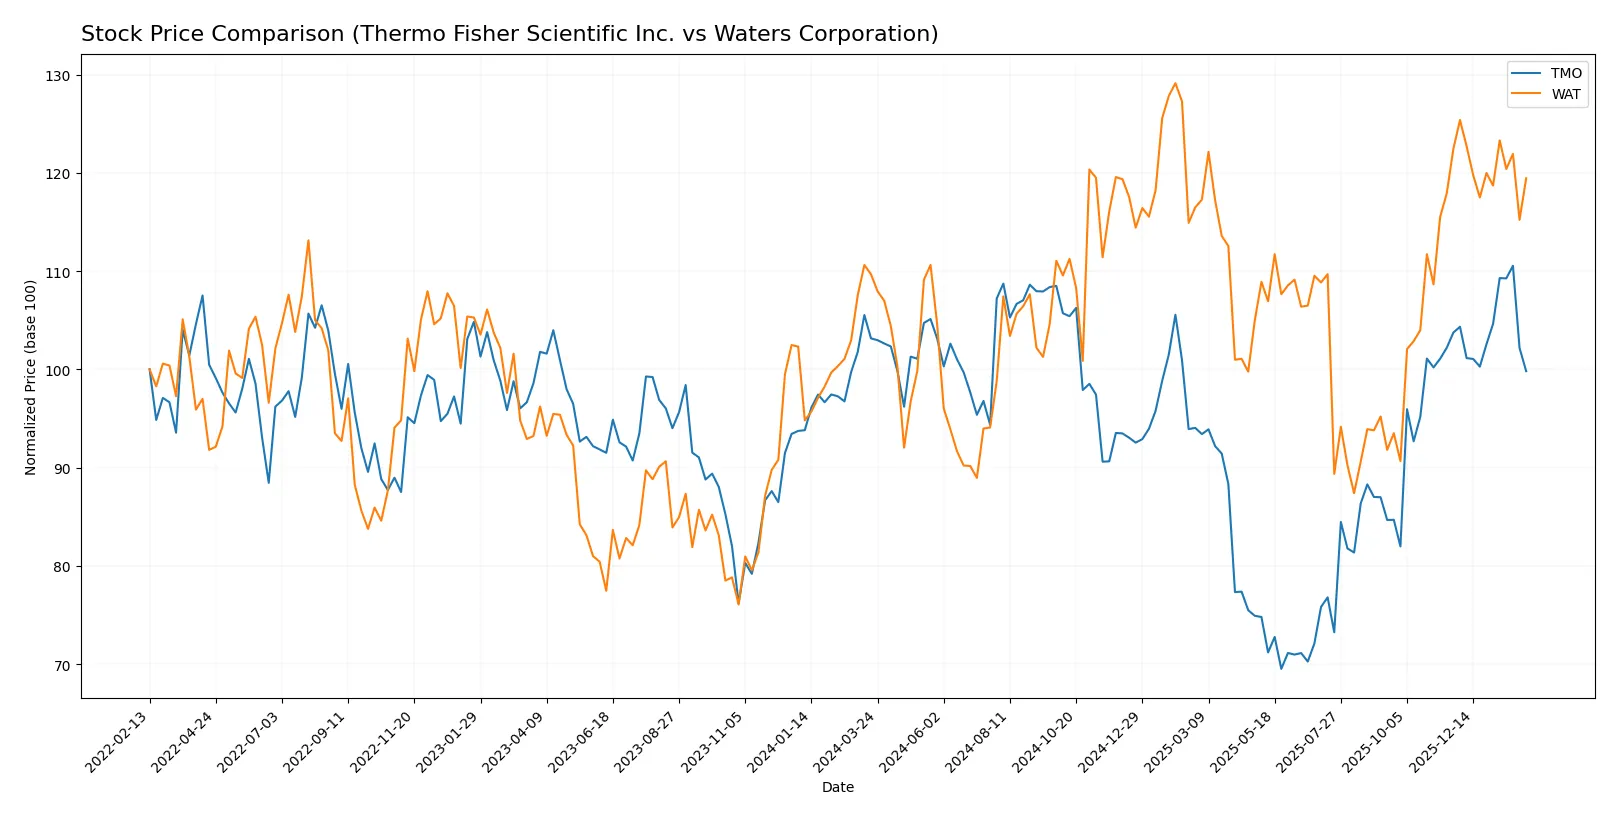
The past year shows contrasting moves: Thermo Fisher Scientific’s shares fell steadily, while Waters Corporation gained ground before recent mild weakness.
Trend Comparison
Thermo Fisher Scientific’s stock declined 3.24% over the past year, signaling a bearish trend with accelerating downward momentum. Its price ranged widely between 394 and 626.
Waters Corporation’s stock rose 8.91% over the same period, reflecting a bullish trend despite recent deceleration and a slight pullback of 2.45% in the last quarter.
Waters Corporation outperformed Thermo Fisher Scientific with the highest market return, despite recent minor weakness and decelerating gains.
Target Prices
Analysts present a cautiously optimistic consensus on target prices for Thermo Fisher Scientific Inc. and Waters Corporation.
| Company | Target Low | Target High | Consensus |
|---|---|---|---|
| Thermo Fisher Scientific Inc. | 561 | 750 | 643.69 |
| Waters Corporation | 315 | 480 | 410.5 |
Thermo Fisher’s consensus target of 644 exceeds its current price of 565, signaling upside potential. Waters’ target consensus of 411 also suggests room to appreciate from its 384 price.

Don’t Let Luck Decide Your Entry Point
Optimize your entry points with our advanced ProRealTime indicators. You’ll get efficient buy signals with precise price targets for maximum performance. Start outperforming now!
How do institutions grade them?
Thermo Fisher Scientific Inc. Grades
Here are the recent grades from reputable financial institutions for Thermo Fisher Scientific Inc.:
| Grading Company | Action | New Grade | Date |
|---|---|---|---|
| TD Cowen | Maintain | Buy | 2026-01-30 |
| Barclays | Maintain | Overweight | 2026-01-30 |
| Citigroup | Maintain | Buy | 2026-01-30 |
| Stifel | Maintain | Buy | 2026-01-09 |
| TD Cowen | Maintain | Buy | 2026-01-07 |
| Wells Fargo | Maintain | Overweight | 2025-12-15 |
| Citigroup | Upgrade | Buy | 2025-12-11 |
| Keybanc | Upgrade | Overweight | 2025-12-08 |
| Morgan Stanley | Maintain | Overweight | 2025-12-02 |
| HSBC | Upgrade | Buy | 2025-12-01 |
Waters Corporation Grades
Below are the recent grades from established institutions for Waters Corporation:
| Grading Company | Action | New Grade | Date |
|---|---|---|---|
| Wells Fargo | Maintain | Equal Weight | 2025-12-15 |
| Wolfe Research | Upgrade | Outperform | 2025-12-10 |
| Wells Fargo | Maintain | Equal Weight | 2025-11-05 |
| TD Cowen | Maintain | Hold | 2025-11-05 |
| JP Morgan | Maintain | Neutral | 2025-10-09 |
| Wells Fargo | Maintain | Equal Weight | 2025-08-05 |
| Deutsche Bank | Maintain | Hold | 2025-08-05 |
| Jefferies | Maintain | Buy | 2025-08-04 |
| Baird | Maintain | Outperform | 2025-07-16 |
| Wells Fargo | Downgrade | Equal Weight | 2025-07-15 |
Which company has the best grades?
Thermo Fisher Scientific consistently earns “Buy” and “Overweight” grades from top-tier firms, signaling strong analyst confidence. Waters Corporation shows more mixed ratings, with several “Equal Weight” and “Hold” grades, although it has some “Outperform” and “Buy” endorsements. Investors may view Thermo Fisher as having a stronger institutional endorsement, potentially translating to greater market confidence.
Risks specific to each company
The following categories identify the critical pressure points and systemic threats facing both firms in the 2026 market environment:
1. Market & Competition
Thermo Fisher Scientific Inc.
- Dominates with broad life sciences portfolio but faces pricing pressures and innovation risks.
Waters Corporation
- Niche focus on chromatography and mass spectrometry, exposed to competitive tech advances and market concentration.
2. Capital Structure & Debt
Thermo Fisher Scientific Inc.
- Moderate leverage with 0.74 debt-to-equity; interest coverage of 5.71 supports debt service.
Waters Corporation
- Slightly higher leverage at 0.93 debt-to-equity but stronger interest coverage at 9.42 provides cushion.
3. Stock Volatility
Thermo Fisher Scientific Inc.
- Beta near 0.95 indicates relative stability in healthcare sector volatility.
Waters Corporation
- Higher beta of 1.18 signals greater sensitivity to market swings and higher stock volatility risk.
4. Regulatory & Legal
Thermo Fisher Scientific Inc.
- Broad regulatory exposure globally; compliance complexity may increase costs.
Waters Corporation
- Regulatory risk concentrated in specialized analytical instruments but less diversified regulatory footprint.
5. Supply Chain & Operations
Thermo Fisher Scientific Inc.
- Large global supply chain vulnerable to geopolitical disruptions and raw material costs.
Waters Corporation
- Smaller scale supply chain but reliant on precision manufacturing with limited supplier options.
6. ESG & Climate Transition
Thermo Fisher Scientific Inc.
- Increasing ESG focus with sustainability initiatives; transition risks moderate but growing.
Waters Corporation
- ESG efforts developing; smaller footprint but faces pressure from institutional investors for transparency.
7. Geopolitical Exposure
Thermo Fisher Scientific Inc.
- Significant international sales expose it to trade tensions and currency fluctuations.
Waters Corporation
- Global footprint smaller, but still exposed to Asia-Pacific market uncertainties.
Which company shows a better risk-adjusted profile?
Thermo Fisher’s largest risk lies in its complex global supply chain and regulatory demands, which can impact margins and operations. Waters faces its biggest threat from stock volatility and concentrated market niche risks. Despite slightly higher leverage, Waters shows stronger profitability and interest coverage, but its elevated beta and narrower market focus add risk. Thermo Fisher’s diversified portfolio and stable beta offer a more balanced risk-adjusted profile. The recent rise in Waters’ stock volatility (beta 1.18) justifies caution, while Thermo Fisher’s robust interest coverage (5.71) supports debt resilience. Overall, Thermo Fisher presents a more prudent risk-return tradeoff in 2026’s volatile healthcare market.
Final Verdict: Which stock to choose?
Thermo Fisher Scientific’s superpower lies in its robust operational cash flow and efficient asset utilization, making it a reliable cash machine. However, its declining profitability and slightly unfavorable moat warrant caution. It fits portfolios aiming for steady, large-cap exposure with moderate growth ambitions.
Waters Corporation commands a strategic moat through its high return on equity and invested capital, driven by recurring revenue and strong margin profiles. Compared to Thermo Fisher, it offers better growth potential but with elevated valuation risks. It suits investors seeking GARP – growth at a reasonable price.
If you prioritize operational resilience and a solid cash flow foundation, Thermo Fisher outshines as the compelling choice due to its scale and stable financial footing. However, if you seek higher growth backed by superior capital efficiency, Waters offers better upside despite its premium and margin pressures. Both present analytical scenarios tailored to distinct investor profiles.
Disclaimer: Investment carries a risk of loss of initial capital. The past performance is not a reliable indicator of future results. Be sure to understand risks before making an investment decision.
Go Further
I encourage you to read the complete analyses of Thermo Fisher Scientific Inc. and Waters Corporation to enhance your investment decisions: