Home > Comparison > Financial Services > TRV vs WRB
The strategic rivalry between The Travelers Companies, Inc. (TRV) and W. R. Berkley Corporation (WRB) defines the trajectory of the property and casualty insurance sector. TRV operates as a diversified insurance giant with extensive commercial and personal lines. WRB focuses on specialized commercial insurance and reinsurance with a leaner operational footprint. This analysis examines which model delivers superior risk-adjusted returns amid evolving market dynamics and regulatory pressures, guiding portfolio allocation decisions.

Table of contents
Companies Overview
The Travelers Companies, Inc. and W. R. Berkley Corporation stand as major players in the U.S. property and casualty insurance market.
The Travelers Companies, Inc.: Comprehensive Commercial and Personal Insurer
The Travelers Companies, Inc. commands a broad market position with a $65.9B market cap. It generates revenue primarily through commercial and personal property and casualty insurance, serving businesses, government units, and individuals. Its 2026 strategy emphasizes diversified segments: Business Insurance, Bond & Specialty Insurance, and Personal Insurance, leveraging a large broker network to optimize distribution.
W. R. Berkley Corporation: Specialized Commercial Lines Writer
W. R. Berkley Corporation holds a $26.7B market cap, focusing on specialized commercial insurance lines. It operates Insurance and Reinsurance segments, underwriting complex risks like cyber, environmental, and professional liability. The company targets niche markets and alternative risk solutions, underscoring a tailored approach to underwriting and reinsurance services in 2026.
Strategic Collision: Similarities & Divergences
Both firms excel in property and casualty insurance but diverge in scope and strategy. Travelers pursues a diversified, multi-segment business model while Berkley adopts a more focused, specialty risk underwriting approach. Their primary battleground lies in commercial insurance, where scale meets specialization. Investors must note Travelers’ broader exposure versus Berkley’s concentrated niche expertise.
Income Statement Comparison
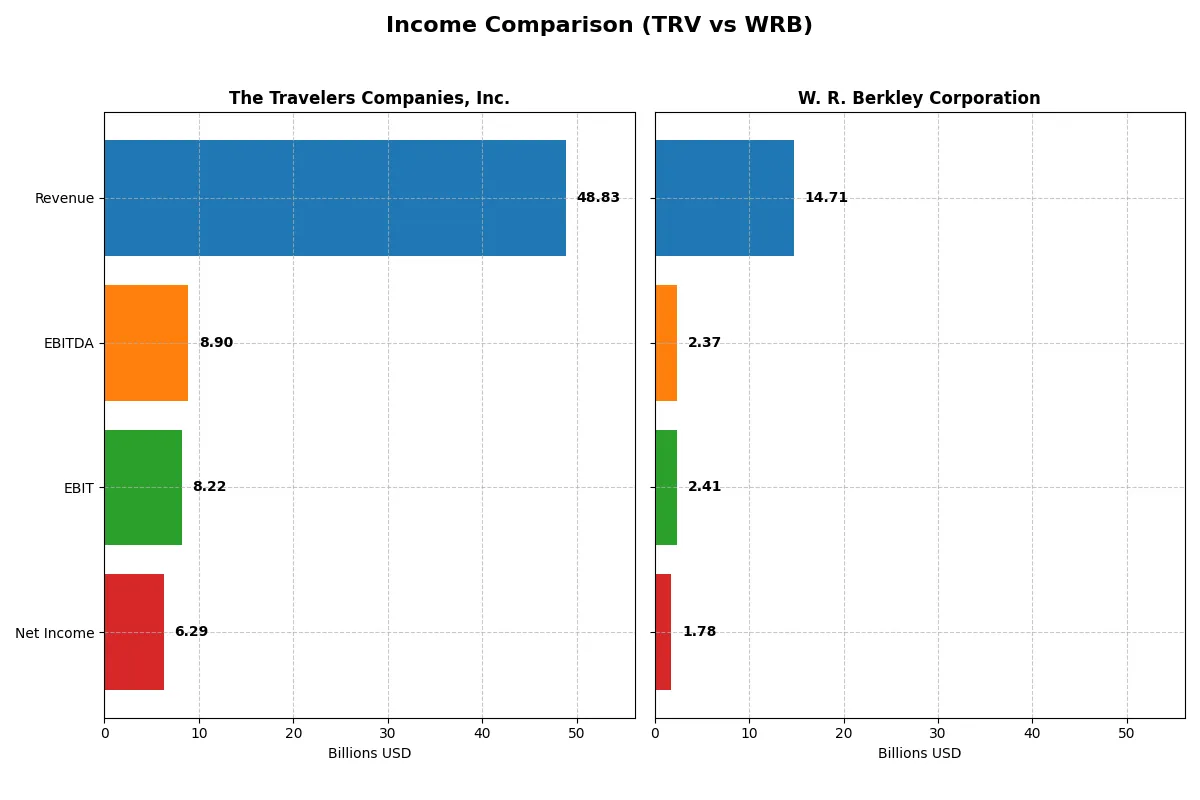
This data dissects the core profitability and scalability of both corporate engines to reveal who dominates the bottom line:
| Metric | The Travelers Companies, Inc. (TRV) | W. R. Berkley Corporation (WRB) |
|---|---|---|
| Revenue | 48.8B | 14.7B |
| Cost of Revenue | 27.2B | 11.8B |
| Operating Expenses | 13.8B | 579M |
| Gross Profit | 21.6B | 2.9B |
| EBITDA | 8.9B | 2.4B |
| EBIT | 8.2B | 2.4B |
| Interest Expense | 425M | 127M |
| Net Income | 6.3B | 1.8B |
| EPS | 27.84 | 4.48 |
| Fiscal Year | 2025 | 2025 |
Income Statement Analysis: The Bottom-Line Duel
This income statement comparison reveals which company’s financial engine delivers stronger efficiency and growth momentum.
The Travelers Companies, Inc. Analysis
Travelers steadily grows revenue from 34.8B in 2021 to 48.8B in 2025, with net income surging from 3.7B to 6.3B. Its gross margin expands sharply, hitting 44.3% in 2025. Net margin climbs to 12.9%, reflecting robust operational leverage and improved expense control, signaling strong momentum in profitability.
W. R. Berkley Corporation Analysis
Berkley’s revenue rises from 9.5B in 2021 to 14.7B in 2025, with net income growing from 1.0B to 1.8B. Gross margin hovers near 20%, lower than Travelers, but EBIT margin at 16.4% remains favorable. Recent net margin dipped slightly, indicating challenges in cost management despite solid revenue growth.
Margin Strength vs. Revenue Expansion
Travelers leads with superior gross margin and faster net income growth, showcasing efficient cost structure and scaling benefits. Berkley posts higher revenue growth overall but with weaker margin expansion and recent profitability softness. For investors prioritizing margin quality and earnings momentum, Travelers’ profile appears more compelling.
Financial Ratios Comparison
These vital ratios act as a diagnostic tool to expose the underlying fiscal health, valuation premiums, and capital efficiency of the companies compared below:
| Ratios | The Travelers Companies, Inc. (TRV) | W. R. Berkley Corporation (WRB) |
|---|---|---|
| ROE | 19.1% | N/A |
| ROIC | 12.1% | N/A |
| P/E | 10.3 | 15.6 |
| P/B | 2.0 | N/A |
| Current Ratio | 0.23 | 0 |
| Quick Ratio | 0.23 | 0 |
| D/E | 0.28 | 0 |
| Debt-to-Assets | 6.4% | 0 |
| Interest Coverage | 18.3 | 18.4 |
| Asset Turnover | 0.34 | 0 |
| Fixed Asset Turnover | 0 | 0 |
| Payout ratio | 15.6% | 41.2% |
| Dividend yield | 1.51% | 2.64% |
| Fiscal Year | 2025 | 2025 |
Efficiency & Valuation Duel: The Vital Signs
Ratios act as a company’s DNA, exposing hidden risks and revealing operational excellence behind the numbers.
The Travelers Companies, Inc.
The Travelers Companies boasts a solid 19.12% ROE and a favorable 12.88% net margin, signaling strong profitability. Its P/E ratio of 10.34 suggests the stock is attractively valued, not stretched. Shareholders benefit from a 1.51% dividend yield, reflecting balanced capital returns alongside steady reinvestment for growth.
W. R. Berkley Corporation
W. R. Berkley’s net margin of 12.1% is favorable, but a 0% ROE and ROIC raise questions about profitability efficiency. The P/E ratio of 15.63 is neutral, indicating moderate valuation pressure. It offers a higher 2.64% dividend yield, emphasizing income return, despite missing some key profitability metrics.
Balanced Profitability vs. Dividend Income Focus
Travelers delivers a better blend of profitability and valuation, with strong returns on equity and capital. Berkley’s higher dividend yield caters to income-focused investors but shows weaker operational metrics. Investors prioritizing growth and efficiency may lean toward Travelers, while income seekers might prefer Berkley’s payout profile.
Which one offers the Superior Shareholder Reward?
I compare The Travelers Companies, Inc. (TRV) and W. R. Berkley Corporation (WRB) on their shareholder reward strategies. TRV pays a modest dividend yield of 1.5% with a conservative payout ratio near 16%, supported by strong free cash flow coverage. Its steady buyback program enhances total returns sustainably. WRB offers a higher dividend yield of 2.6% but a payout ratio above 41%, signaling riskier sustainability. WRB’s buybacks are less consistent, and its leverage is higher, raising caution. I believe TRV’s balanced dividend and disciplined buybacks provide a more durable and attractive total return profile for 2026 investors.
Comparative Score Analysis: The Strategic Profile
The radar chart reveals the fundamental DNA and trade-offs of both firms, highlighting their distinct financial strengths and vulnerabilities:
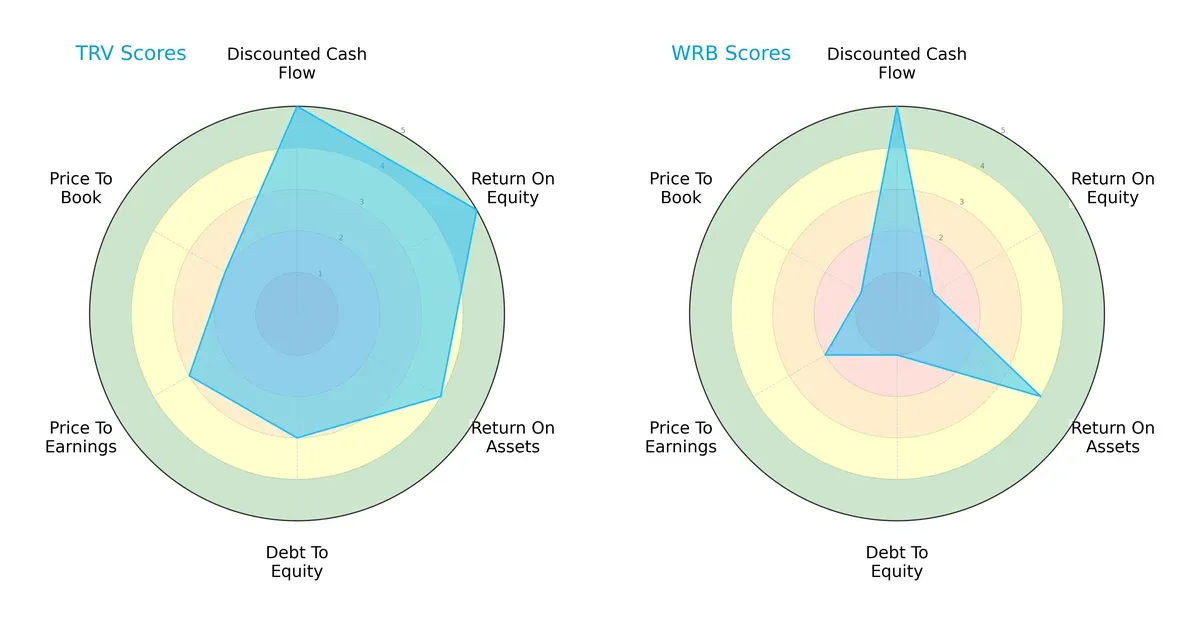
The Travelers Companies, Inc. (TRV) exhibits a balanced profile with very favorable DCF and ROE scores, reflecting strong profitability and cash flow generation. Its moderate debt-to-equity and valuation metrics suggest prudent risk management but some valuation pressure. In contrast, W. R. Berkley Corporation (WRB) relies heavily on a strong DCF score but suffers from very unfavorable ROE and debt-to-equity scores, indicating weaker profitability and higher financial risk. TRV clearly presents a more stable and diversified financial profile than WRB.
Bankruptcy Risk: Solvency Showdown
The Altman Z-Score comparison reveals a stark solvency gap:

TRV’s score of 0.82 places it firmly in the distress zone, signaling a high bankruptcy risk despite its other strengths. WRB’s Altman Z-Score is unavailable, limiting direct comparison, but caution is warranted given TRV’s precarious position in this cycle.
Financial Health: Quality of Operations
Piotroski F-Scores indicate operational quality and internal financial health:
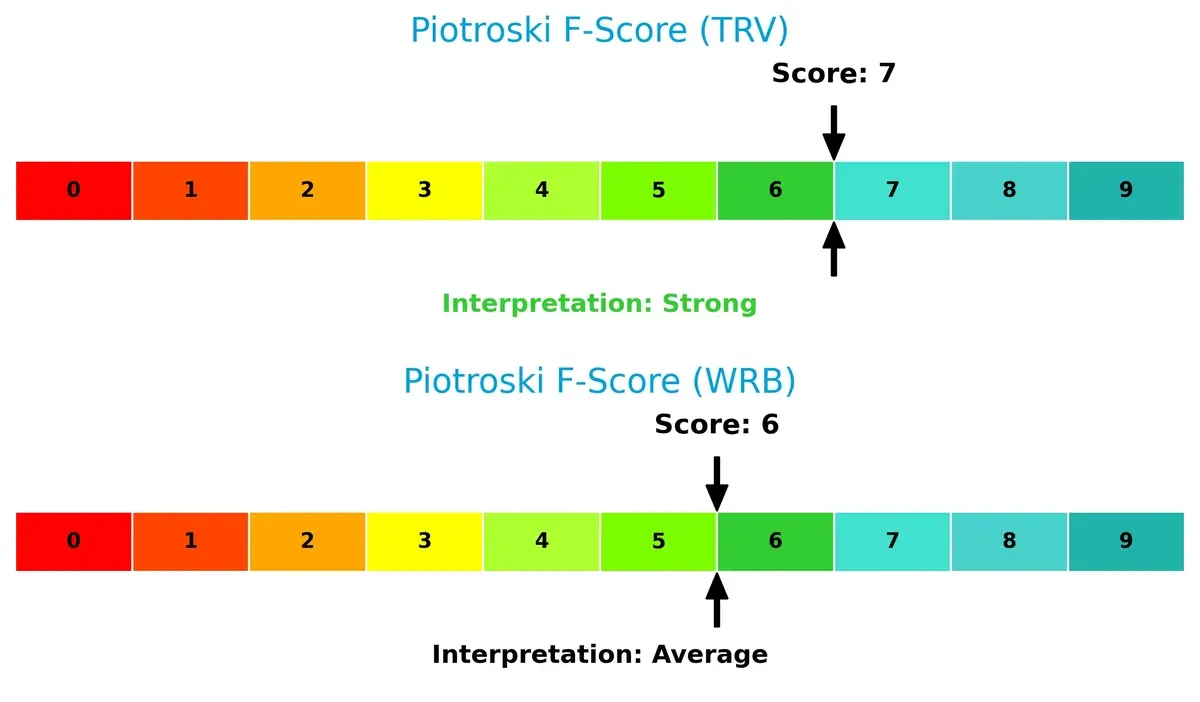
TRV scores a strong 7, suggesting robust internal metrics and sound financial health. WRB’s score of 6 is average, implying some internal weaknesses but generally stable operations. TRV’s slightly superior score underscores better profitability, liquidity, and efficiency compared to WRB.
How are the two companies positioned?
This section dissects the operational DNA of TRV and WRB by analyzing revenue distribution by segment alongside their internal strengths and weaknesses. The goal is to confront their economic moats and identify which model offers the most resilient, sustainable competitive advantage today.
Revenue Segmentation: The Strategic Mix
This visual comparison dissects how The Travelers Companies, Inc. and W. R. Berkley Corporation diversify their income streams and where their primary sector bets lie:
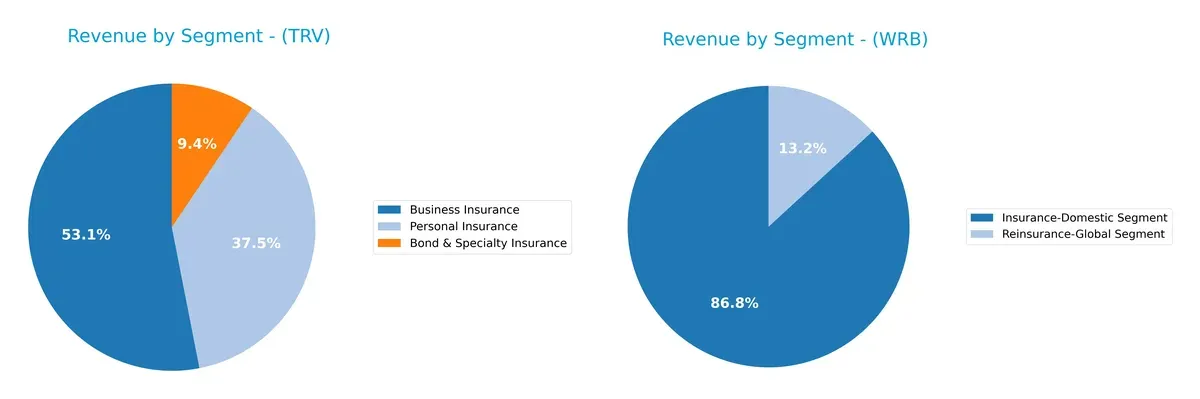
The Travelers Companies, Inc. anchors its revenue in Business Insurance at $24.7B, complemented by Personal Insurance ($17.4B) and Bond & Specialty Insurance ($4.4B). This diversified portfolio reduces concentration risk and leverages broad market exposure. In contrast, W. R. Berkley Corporation pivots heavily on its Insurance-Domestic Segment at $11.2B, with a smaller Reinsurance-Global Segment at $1.7B, signaling reliance on core domestic insurance and potential vulnerability to domestic market shifts.
Strengths and Weaknesses Comparison
This table compares the Strengths and Weaknesses of TRV and WRB based on diversification, profitability, financials, innovation, global presence, and market share:
TRV Strengths
- Diversified revenue across Bond & Specialty, Business, and Personal Insurance
- Strong profitability with 12.88% net margin and 19.12% ROE
- Favorable capital structure with low debt-to-assets at 6.45%
- Solid interest coverage at 19.34
- Established large U.S. market presence with growing international revenue
WRB Strengths
- Favorable net margin at 12.1%
- Low leverage with favorable debt-to-assets
- Strong interest coverage at 18.95
- Higher dividend yield at 2.64%
- Favorable price-to-book metric indicating market confidence
TRV Weaknesses
- Very low current and quick ratios at 0.23, indicating liquidity risk
- Unfavorable asset and fixed asset turnover ratios suggest inefficient asset use
- Neutral dividend yield at 1.51%
- Moderate price-to-book at 1.98 may limit valuation upside
WRB Weaknesses
- Zero ROE and ROIC raise concerns about profitability and capital efficiency
- Unavailable WACC complicates cost of capital assessment
- Zero current and quick ratios highlight liquidity weaknesses
- Unfavorable asset turnovers suggest inefficiency
- Neutral P/E at 15.63 may limit valuation appeal
TRV demonstrates stronger profitability and capital efficiency, supported by a diversified business and healthy leverage. WRB shows some financial strengths but faces notable profitability and liquidity concerns. These factors shape each company’s strategic priorities around operational efficiency and capital management.
The Moat Duel: Analyzing Competitive Defensibility
A structural moat is the only reliable shield protecting long-term profits from relentless competition erosion. Let’s dissect how each company builds its defense:
The Travelers Companies, Inc.: Diversified Risk & Scale Moat
I identify Travelers’ moat in its diversified insurance portfolio and scale. This mix sustains high ROIC above WACC by spreading risk and maintaining stable margins. Expansion in specialty lines deepens its competitive edge in 2026.
W. R. Berkley Corporation: Focused Niche Expertise
Berkley’s moat contrasts Travelers’ scale with focused underwriting expertise in specialty commercial lines. Its financials show stable margins but lack clear ROIC advantage data. Growth hinges on penetrating niche markets and leveraging tailored products.
Moat Strength: Scale Diversification vs. Niche Specialization
Travelers commands a wider, data-backed moat through scale and consistent value creation (ROIC +6.1% vs. WACC), while Berkley’s moat remains less quantifiable. Travelers stands better poised to defend market share amid evolving risks.
Which stock offers better returns?
The past year shows The Travelers Companies, Inc. gained 33.63%, slowing its upward momentum, while W. R. Berkley Corporation rose 23.12%, also with decelerating gains.
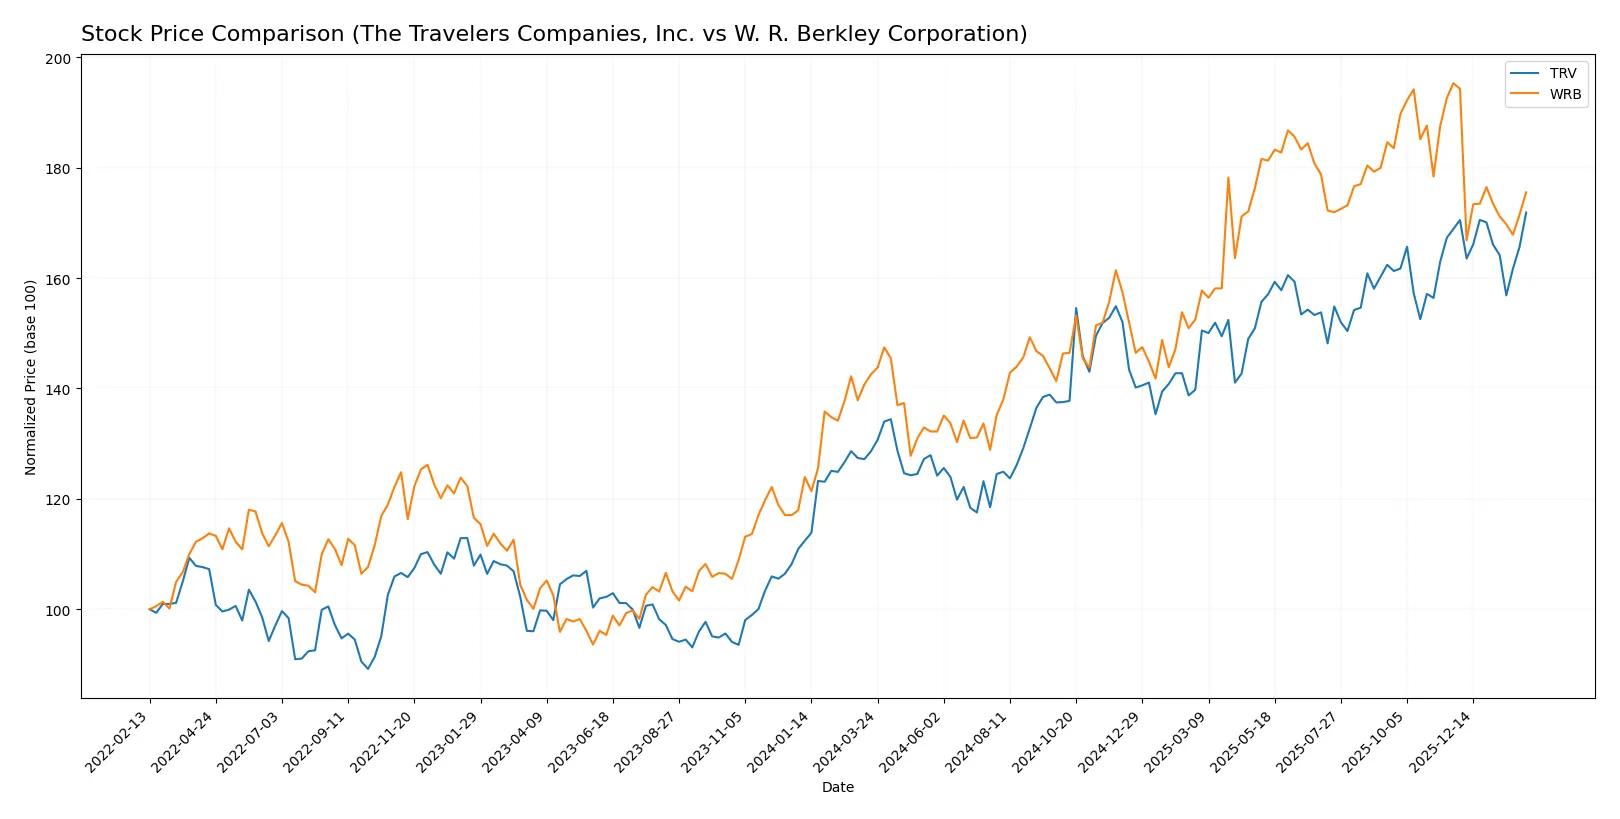
Trend Comparison
The Travelers Companies, Inc. posted a 33.63% price increase over 12 months with a decelerating bullish trend. It reached a high of 295.22 and a low of 201.87.
W. R. Berkley Corporation’s stock climbed 23.12% over the same period, showing a decelerating bullish trend. Its prices ranged from 51.1 to 78.1.
Comparing both, Travelers outperformed Berkley in market gains, despite recent volatility and slowing price acceleration.
Target Prices
Analysts present a bullish consensus for The Travelers Companies, Inc. and W. R. Berkley Corporation.
| Company | Target Low | Target High | Consensus |
|---|---|---|---|
| The Travelers Companies, Inc. | 304 | 317 | 312.75 |
| W. R. Berkley Corporation | 64 | 80 | 71 |
The Travelers trades below its consensus target of 313, implying 6% upside potential. W. R. Berkley trades near its 71 target, indicating limited near-term price appreciation.

Don’t Let Luck Decide Your Entry Point
Optimize your entry points with our advanced ProRealTime indicators. You’ll get efficient buy signals with precise price targets for maximum performance. Start outperforming now!
How do institutions grade them?
Here is a summary of recent institutional grades for The Travelers Companies, Inc. and W. R. Berkley Corporation:
The Travelers Companies, Inc. Grades
The following table shows recent grades from reputable financial institutions for The Travelers Companies, Inc.:
| Grading Company | Action | New Grade | Date |
|---|---|---|---|
| Cantor Fitzgerald | maintain | Overweight | 2026-02-02 |
| Citigroup | maintain | Sell | 2026-01-27 |
| Keefe, Bruyette & Woods | maintain | Outperform | 2026-01-23 |
| Roth Capital | maintain | Buy | 2026-01-23 |
| Mizuho | maintain | Neutral | 2026-01-22 |
| Wells Fargo | maintain | Equal Weight | 2026-01-22 |
| Cantor Fitzgerald | maintain | Overweight | 2026-01-14 |
| Wells Fargo | maintain | Equal Weight | 2026-01-13 |
| Barclays | maintain | Equal Weight | 2026-01-08 |
| Evercore ISI Group | maintain | Outperform | 2026-01-07 |
W. R. Berkley Corporation Grades
Below is a table of recent grades from established grading companies for W. R. Berkley Corporation:
| Grading Company | Action | New Grade | Date |
|---|---|---|---|
| Cantor Fitzgerald | maintain | Overweight | 2026-02-02 |
| Argus Research | maintain | Buy | 2026-02-02 |
| Truist Securities | maintain | Buy | 2026-01-28 |
| B of A Securities | maintain | Neutral | 2026-01-27 |
| Mizuho | maintain | Neutral | 2026-01-27 |
| Wells Fargo | maintain | Equal Weight | 2026-01-27 |
| Jefferies | maintain | Hold | 2026-01-27 |
| TD Cowen | downgrade | Sell | 2026-01-20 |
| Cantor Fitzgerald | maintain | Overweight | 2026-01-14 |
| Wells Fargo | maintain | Equal Weight | 2026-01-13 |
Which company has the best grades?
Both companies receive a mix of positive and neutral grades, but The Travelers Companies, Inc. has more consistent “Overweight” and “Outperform” ratings. W. R. Berkley Corporation presents slightly more variation, including a recent downgrade to “Sell.” This discrepancy may influence investor sentiment and portfolio positioning.
Risks specific to each company
The following categories identify the critical pressure points and systemic threats facing both firms in the 2026 market environment:
1. Market & Competition
The Travelers Companies, Inc.
- Strong market presence with diversified insurance segments; faces intense competition in commercial and personal lines.
W. R. Berkley Corporation
- Focuses on commercial lines with niche specialty products; competes with larger insurers but benefits from targeted expertise.
2. Capital Structure & Debt
The Travelers Companies, Inc.
- Maintains a low debt-to-equity ratio (0.28) and favorable interest coverage (19.34), indicating strong financial stability.
W. R. Berkley Corporation
- Debt metrics unavailable but rated favorably; lack of disclosed ratios adds uncertainty to leverage assessment.
3. Stock Volatility
The Travelers Companies, Inc.
- Beta of 0.52 suggests moderate market sensitivity and relative stability versus the S&P 500.
W. R. Berkley Corporation
- Lower beta of 0.36 indicates lower volatility, appealing to risk-averse investors.
4. Regulatory & Legal
The Travelers Companies, Inc.
- Subject to broad regulatory frameworks across multiple states and international markets, increasing compliance complexity.
W. R. Berkley Corporation
- Also faces stringent regulation but its smaller scale and specialized lines may reduce exposure to broad regulatory shifts.
5. Supply Chain & Operations
The Travelers Companies, Inc.
- Large operational scale with 34K employees could strain operational efficiency, reflected in low asset turnover ratios.
W. R. Berkley Corporation
- Smaller workforce (8.6K) may allow more agile operations but limits scale advantages.
6. ESG & Climate Transition
The Travelers Companies, Inc.
- Increasing pressure to adapt underwriting to climate risks; ESG initiatives critical for long-term sustainability.
W. R. Berkley Corporation
- Faces similar ESG pressures, though less publicly visible; may lag in transparency compared to larger peers.
7. Geopolitical Exposure
The Travelers Companies, Inc.
- International operations expose it to geopolitical risks, including regulatory and market instability abroad.
W. R. Berkley Corporation
- Primarily US-focused with some international presence, limiting but not eliminating geopolitical risk.
Which company shows a better risk-adjusted profile?
The Travelers Companies’ critical risk lies in operational inefficiency, indicated by its unfavorable liquidity and turnover ratios. W. R. Berkley’s biggest risk is its weak profitability metrics and incomplete financial transparency. Overall, Travelers shows a stronger risk-adjusted profile, supported by superior returns on equity and capital, despite operational constraints. Its Altman Z-Score in the distress zone is concerning, yet its robust ROE and consistent dividend yield justify cautious optimism. Meanwhile, Berkley’s lack of ROE and ROIC data signals higher financial uncertainty.
Final Verdict: Which stock to choose?
The Travelers Companies, Inc. (TRV) shines with a robust economic moat built on a consistently growing ROIC well above its WACC. Its superpower lies in efficient capital allocation and value creation, driving strong profitability. A point of vigilance remains its low liquidity ratios, which could pressure in tight credit cycles. TRV suits portfolios targeting steady growth with a value tilt.
W. R. Berkley Corporation (WRB) boasts a strategic moat anchored in disciplined underwriting and recurring premium income. Its lower leverage and attractive dividend yield offer a safer profile compared to TRV. However, the absence of clear ROIC data and mixed profitability signals require caution. WRB fits well within portfolios seeking moderate growth combined with income stability.
If you prioritize long-term value creation and visible economic moats, TRV is the compelling choice due to superior capital efficiency and profitability. However, if you seek income and lower leverage with a more conservative risk profile, WRB offers better stability despite less transparent returns. Both present distinct analytical scenarios for different investor avatars.
Disclaimer: Investment carries a risk of loss of initial capital. The past performance is not a reliable indicator of future results. Be sure to understand risks before making an investment decision.
Go Further
I encourage you to read the complete analyses of The Travelers Companies, Inc. and W. R. Berkley Corporation to enhance your investment decisions: