Investors seeking stability and growth often turn to the regulated electric utility sector, where The Southern Company (SO) and Xcel Energy Inc. (XEL) stand out as prominent players. Both companies operate across diverse energy sources and prioritize innovation in renewable projects, serving millions of customers in overlapping U.S. regions. This comparison will help you understand which company offers the most compelling investment opportunity in today’s evolving energy landscape.
Table of contents
Companies Overview
I will begin the comparison between The Southern Company and Xcel Energy Inc. by providing an overview of these two companies and their main differences.
The Southern Company Overview
The Southern Company operates in the regulated electric industry, focusing on electricity generation, transmission, and distribution. It also manages natural gas distribution and pipeline investments, serving approximately 8.7M electric and gas utility customers across several states. The company’s portfolio includes diverse power generation assets such as hydroelectric, fossil fuel, nuclear, solar, wind, and battery storage facilities, positioning it as a major utility player headquartered in Atlanta.
Xcel Energy Inc. Overview
Xcel Energy Inc. is a regulated electric utility company that generates, purchases, transmits, and distributes electricity and natural gas. It serves approximately 3.7M electricity and 2.1M natural gas customers in multiple states, including Colorado and Minnesota. Its energy sources are varied, encompassing coal, nuclear, natural gas, hydroelectric, solar, biomass, oil, and wind. Xcel Energy also invests in renewable infrastructure and natural gas pipeline development from its Minneapolis headquarters.
Key similarities and differences
Both companies operate in the regulated electric sector with integrated electricity and natural gas services, serving residential, commercial, and industrial customers across multiple states. They maintain diversified energy generation portfolios including renewables and traditional sources. Southern Company is significantly larger in market cap and customer base, while Xcel Energy emphasizes investments in renewable facilities and natural gas infrastructure. Their geographic footprints and scale differ, reflecting distinct regional focuses within the US utility market.
Income Statement Comparison
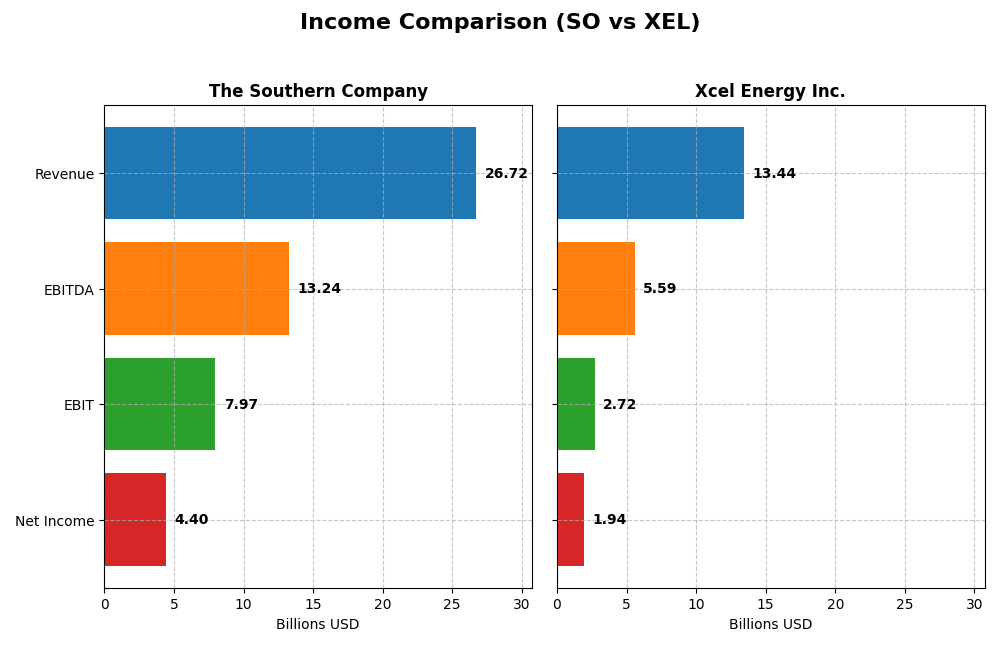
The table below presents a side-by-side comparison of key income statement metrics for The Southern Company and Xcel Energy Inc. for the fiscal year 2024.
| Metric | The Southern Company (SO) | Xcel Energy Inc. (XEL) |
|---|---|---|
| Market Cap | 95.7B | 43.9B |
| Revenue | 26.7B | 13.4B |
| EBITDA | 13.2B | 5.6B |
| EBIT | 7.97B | 2.72B |
| Net Income | 4.40B | 1.94B |
| EPS | 4.02 | 3.44 |
| Fiscal Year | 2024 | 2024 |
Income Statement Interpretations
The Southern Company
The Southern Company’s revenue increased steadily from 20.4B in 2020 to 26.7B in 2024, with net income rising from 3.1B to 4.4B over the same period. Margins showed improvement, with a favorable gross margin near 50% and EBIT margin close to 30%. In 2024, growth moderated slightly but profitability and EPS growth remained favorable, signaling solid operational efficiency.
Xcel Energy Inc.
Xcel Energy’s revenue grew from 11.5B in 2020 to 13.4B in 2024, though it experienced a 5.4% decline in the latest year. Net income increased overall from 1.47B to 1.94B, with net margin improving to 14.4%. Despite recent revenue softness, EBIT margin and EPS growth were positive, reflecting resilience in profitability and cost management across the period.
Which one has the stronger fundamentals?
Both companies demonstrate favorable income statement fundamentals with growing revenues and net incomes over five years. Southern Company maintains higher margins and stronger revenue growth, although its interest expense is less favorable. Xcel Energy shows solid margin expansion and net income growth despite recent revenue decline. Overall, Southern Company’s stronger margins and larger scale suggest more robust fundamental metrics.
Financial Ratios Comparison
The table below presents a side-by-side comparison of key financial ratios for The Southern Company (SO) and Xcel Energy Inc. (XEL) based on their most recent fiscal year 2024 data.
| Ratios | The Southern Company (SO) | Xcel Energy Inc. (XEL) |
|---|---|---|
| ROE | 13.25% | 9.92% |
| ROIC | 4.25% | 4.59% |
| P/E | 20.5 | 19.64 |
| P/B | 2.72 | 1.95 |
| Current Ratio | 0.67 | 0.67 |
| Quick Ratio | 0.46 | 0.57 |
| D/E (Debt to Equity) | 2.00 | 1.55 |
| Debt-to-Assets | 45.7% | 43.1% |
| Interest Coverage | 2.58 | 2.02 |
| Asset Turnover | 0.18 | 0.19 |
| Fixed Asset Turnover | 0.25 | 0.23 |
| Payout Ratio | 67.1% | 60.7% |
| Dividend Yield | 3.27% | 3.09% |
Interpretation of the Ratios
The Southern Company
The Southern Company shows a mixed ratio profile with favorable net margin (16.47%) and dividend yield (3.27%), but unfavorable returns on invested capital (4.25%) and liquidity ratios, including a current ratio of 0.67. Its debt-to-equity ratio of 2.0 suggests relatively high leverage. The company pays dividends with a stable yield, supported by free cash flow coverage, though some leverage and liquidity concerns remain.
Xcel Energy Inc.
Xcel Energy displays favorable net margin (14.4%) and dividend yield (3.09%), alongside less favorable return on equity (9.92%) and returns on invested capital (4.59%). Liquidity ratios are weak, with a current ratio of 0.67 and quick ratio of 0.57. The debt-to-equity ratio of 1.55 indicates moderate leverage. The firm pays dividends regularly, backed by dividend yield, but liquidity and leverage metrics warrant attention.
Which one has the best ratios?
Both companies exhibit slightly unfavorable overall ratio profiles, with 21.43% favorable and a majority unfavorable ratios. The Southern Company has a higher return on equity and dividend yield but greater leverage. Xcel Energy reports a lower return on equity and similar dividend yield with somewhat lower leverage. Neither stands out decisively; each presents strengths and weaknesses in key financial ratios.
Strategic Positioning
This section compares the strategic positioning of The Southern Company and Xcel Energy Inc., focusing on market position, key segments, and exposure to technological disruption:
The Southern Company
- Large market cap of 95.7B in regulated electric sector with moderate competitive pressure.
- Diversified segments across gas distribution, gas marketing, pipelines, and electricity generation.
- Operates multiple generation types including fossil, nuclear, hydro, solar, and wind, plus fiber optics services.
Xcel Energy Inc.
- Mid-sized market cap of 43.9B, operating in regulated electric utilities with similar competitive dynamics.
- Concentrated on regulated electric and natural gas utilities serving multiple states with a focus on renewables.
- Uses diverse energy sources including coal, nuclear, solar, wind, and biomass, investing in renewable facilities.
The Southern Company vs Xcel Energy Inc. Positioning
The Southern Company shows a diversified business model spanning electricity, natural gas, and digital services, whereas Xcel Energy focuses on regulated electric and gas utilities with renewable investments. Diversification offers broader revenue streams, while concentration may enable operational focus.
Which has the best competitive advantage?
Both companies are slightly unfavorable in MOAT evaluation, shedding value but showing growing ROIC trends. Neither currently demonstrates a strong competitive advantage based on efficient capital use or value creation.
Stock Comparison
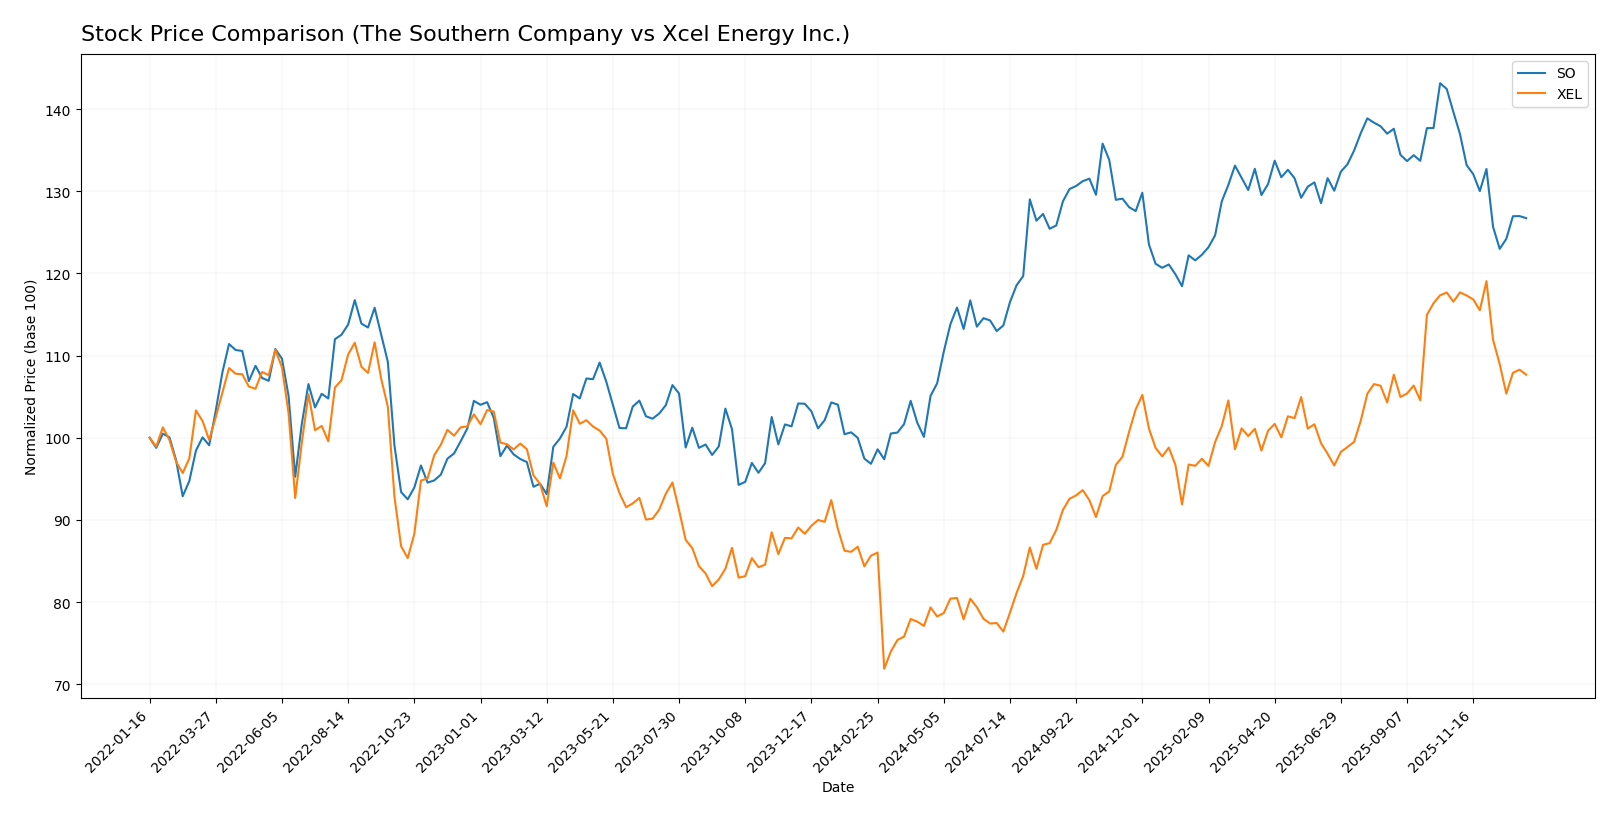
The stock price movements of The Southern Company (SO) and Xcel Energy Inc. (XEL) over the past 12 months reveal notable bullish trends with recent deceleration and a shift toward seller dominance in trading volumes.
Trend Analysis
The Southern Company (SO) exhibited a bullish trend over the past 12 months with a 30.88% price increase, though this growth has decelerated. The stock reached a high of 98.29 and low of 66.48, with a recent negative trend of -9.25% since late 2025.
Xcel Energy Inc. (XEL) also showed a bullish trend over the past year, gaining 25.72%, accompanied by decelerating momentum. Its price fluctuated between 49.57 and 82.11, with recent losses of 7.63% from October 2025 to January 2026.
Comparing both stocks, The Southern Company delivered the highest market performance with a larger overall gain of 30.88% versus Xcel Energy’s 25.72%, despite both facing short-term declines in late 2025.
Target Prices
The consensus target prices for The Southern Company and Xcel Energy Inc. indicate moderate upside potential.
| Company | Target High | Target Low | Consensus |
|---|---|---|---|
| The Southern Company | 103 | 76 | 93.1 |
| Xcel Energy Inc. | 96 | 81 | 87 |
Analysts expect The Southern Company’s stock to rise modestly from $87.01 to around $93.1 on average, while Xcel Energy’s consensus target of $87 suggests a significant upside from its current price of $74.26.
Analyst Opinions Comparison
This section compares analysts’ ratings and grades for The Southern Company and Xcel Energy Inc.:
Rating Comparison
The Southern Company Rating
- Rating: B- with a very favorable status overall.
- Discounted Cash Flow Score: Moderate at 3 out of 5.
- ROE Score: Favorable at 4, indicating strong profit generation.
- ROA Score: Moderate at 3, reflecting asset utilization.
- Debt To Equity Score: Very unfavorable at 1, high financial risk.
- Overall Score: Moderate at 3, reflecting balanced performance.
Xcel Energy Inc. Rating
- Rating: C+ with a very favorable status overall.
- Discounted Cash Flow Score: Favorable at 4 out of 5.
- ROE Score: Moderate at 3, showing decent profit efficiency.
- ROA Score: Moderate at 2, indicating lower asset efficiency.
- Debt To Equity Score: Very unfavorable at 1, high financial risk.
- Overall Score: Moderate at 2, slightly weaker overall rating.
Which one is the best rated?
Based on the provided data, The Southern Company holds a better overall rating (B-) and higher scores in ROE and overall score compared to Xcel Energy’s C+. Despite both having poor debt-to-equity scores, Southern Company is rated more favorably overall.
Scores Comparison
Here is a comparison of the Altman Z-Score and Piotroski Score for the two companies:
SO Scores
- Altman Z-Score: 0.98, placing SO in distress zone, indicating high bankruptcy risk.
- Piotroski Score: 6, indicating average financial strength and investment potential.
XEL Scores
- Altman Z-Score: 0.89, placing XEL in distress zone, indicating high bankruptcy risk.
- Piotroski Score: 5, indicating average financial strength and investment potential.
Which company has the best scores?
SO has a slightly higher Altman Z-Score and Piotroski Score compared to XEL, suggesting marginally better financial stability and strength based on these metrics. Both remain in the distress zone with average Piotroski scores.
Grades Comparison
Here is a comparison of recent grades and ratings assigned to The Southern Company and Xcel Energy Inc.:
The Southern Company Grades
The table below shows recent grades from reputable financial institutions for The Southern Company:
| Grading Company | Action | New Grade | Date |
|---|---|---|---|
| UBS | Maintain | Neutral | 2025-12-17 |
| JP Morgan | Maintain | Neutral | 2025-12-15 |
| Jefferies | Maintain | Neutral | 2025-12-15 |
| RBC Capital | Maintain | Sector Perform | 2025-12-12 |
| Keybanc | Maintain | Underweight | 2025-12-12 |
| Mizuho | Maintain | Neutral | 2025-12-11 |
| Barclays | Maintain | Equal Weight | 2025-11-20 |
| Jefferies | Downgrade | Neutral | 2025-11-05 |
| Ladenburg Thalmann | Downgrade | Neutral | 2025-10-17 |
| Keybanc | Maintain | Underweight | 2025-10-15 |
The Southern Company’s grades mostly show a neutral or hold stance, with some underweight and sector perform ratings, indicating cautious sentiment.
Xcel Energy Inc. Grades
The table below lists recent grades from recognized analysts for Xcel Energy Inc.:
| Grading Company | Action | New Grade | Date |
|---|---|---|---|
| UBS | Maintain | Neutral | 2025-12-17 |
| Keybanc | Maintain | Overweight | 2025-12-12 |
| JP Morgan | Maintain | Overweight | 2025-12-11 |
| Barclays | Maintain | Overweight | 2025-11-05 |
| Citigroup | Maintain | Buy | 2025-11-03 |
| UBS | Maintain | Neutral | 2025-10-31 |
| Mizuho | Maintain | Outperform | 2025-10-27 |
| Jefferies | Maintain | Buy | 2025-10-16 |
| Keybanc | Maintain | Overweight | 2025-10-15 |
| BMO Capital | Maintain | Outperform | 2025-10-15 |
Xcel Energy’s grades predominantly reflect a buy or overweight consensus, indicating positive analyst sentiment.
Which company has the best grades?
Xcel Energy Inc. has received consistently stronger grades than The Southern Company, with more buy and outperform recommendations. This could suggest a more favorable analyst outlook, potentially influencing investor confidence and portfolio decisions.
Strengths and Weaknesses
The following table summarizes key strengths and weaknesses of The Southern Company (SO) and Xcel Energy Inc. (XEL) based on recent financial and operational data.
| Criterion | The Southern Company (SO) | Xcel Energy Inc. (XEL) |
|---|---|---|
| Diversification | Moderate diversification with strong gas and electric utilities segments; Southern Company Gas accounts for $4.46B revenue | Primarily focused on regulated electric ($22.3B) and natural gas ($4.48B) segments, showing focused diversification |
| Profitability | Net margin 16.47% (favorable); ROIC 4.25% (unfavorable, below WACC 4.96%) | Net margin 14.4% (favorable); ROIC 4.59% (unfavorable vs WACC 5.1%) |
| Innovation | Limited data on innovation; traditional utilities with stable but slow growth | Similar profile; innovation efforts not prominently reflected in financials |
| Global presence | Primarily US-focused utility company with regional dominance | Also US-focused, with strong regulatory relationships but limited international presence |
| Market Share | Strong presence in southeastern US with diverse gas and electric operations | Leading regulated utility in multiple states with significant scale in electric and gas markets |
Key takeaways: Both companies operate in regulated utility sectors with strong regional market positions and stable profitability. However, both show ROIC below their cost of capital, indicating current value destruction despite improving trends. Diversification is balanced but limited to core utility services. Investors should monitor their ability to convert improving profitability into sustained value creation.
Risk Analysis
Below is a comparative table highlighting key risks for The Southern Company (SO) and Xcel Energy Inc. (XEL) based on the most recent 2024 data.
| Metric | The Southern Company (SO) | Xcel Energy Inc. (XEL) |
|---|---|---|
| Market Risk | Beta 0.447 (low volatility) | Beta 0.469 (low volatility) |
| Debt level | High debt-to-equity: 2.0 (unfavorable) | High debt-to-equity: 1.55 (unfavorable) |
| Regulatory Risk | Moderate (utility sector regulated) | Moderate (utility sector regulated) |
| Operational Risk | Aging fossil and nuclear assets | Diverse energy mix but aging coal assets |
| Environmental Risk | Exposure to fossil fuel transition | Transitioning from coal to renewables |
| Geopolitical Risk | Low (US focused operations) | Low (US focused operations) |
The most impactful risks for both SO and XEL are their high debt levels, which pose financial strain despite stable market volatility. Environmental risk is rising as the energy sector transitions away from fossil fuels, making operational shifts critical. Both companies face moderate regulatory oversight typical of utilities, but geopolitical exposure remains low due to their domestic US focus. Investors should watch debt management and environmental strategy closely.
Which Stock to Choose?
The Southern Company (SO) shows a favorable income evolution with strong gross and EBIT margins, supported by a 31% revenue growth over five years. Its financial ratios reveal a slightly unfavorable profile due to weak liquidity and high debt, despite a solid dividend yield. The rating is very favorable with a B- grade, though Altman Z-Score indicates distress risk.
Xcel Energy Inc. (XEL) displays a favorable but less consistent income trend, including a recent revenue decline. Its financial ratios are slightly more unfavorable than SO’s, with lower profitability metrics and a similar debt burden. The rating is also very favorable at C+ but with comparable distress risk per Altman Z-Score and average Piotroski score.
For investors prioritizing income statement strength and dividend stability, SO might appear more favorable given its higher margins and growth. Conversely, those focusing on valuation or moderate risk exposure could see XEL as a potential choice despite recent revenue challenges. Both companies show signs of value destruction but improving profitability, implying caution and monitoring are advisable.
Disclaimer: Investment carries a risk of loss of initial capital. The past performance is not a reliable indicator of future results. Be sure to understand risks before making an investment decision.
Go Further
I encourage you to read the complete analyses of The Southern Company and Xcel Energy Inc. to enhance your investment decisions: