The Southern Company (SO) and WEC Energy Group, Inc. (WEC) are two prominent players in the regulated electric utility sector, each delivering essential energy services across different U.S. regions. Both companies emphasize innovation through renewable energy and infrastructure modernization, striving to balance reliability with sustainability. This comparative analysis will guide you through their market positions and strategies to reveal which company presents a more compelling investment opportunity in 2026.
Table of contents
Companies Overview
I will begin the comparison between The Southern Company and WEC Energy Group, Inc. by providing an overview of these two companies and their main differences.
The Southern Company Overview
The Southern Company operates in the regulated electric industry, focusing on generation, transmission, and distribution of electricity. It also manages extensive natural gas operations and renewable energy projects, serving approximately 8.7 million customers. Headquartered in Atlanta, Georgia, it maintains a diversified portfolio including hydroelectric, fossil fuel, nuclear, solar, and wind facilities, supported by a large network of natural gas pipelines.
WEC Energy Group, Inc. Overview
WEC Energy Group, Inc. provides regulated natural gas and electricity services with a focus on renewable and nonregulated energy. The company operates through multiple segments across several states, managing extensive electric and natural gas distribution infrastructure. Based in Milwaukee, Wisconsin, WEC emphasizes a diverse energy mix including coal, natural gas, oil, hydroelectric, wind, solar, and biomass sources, serving a large customer base primarily in the Midwest.
Key similarities and differences
Both companies operate within the regulated electric utility sector and deliver natural gas and electricity services, with significant investments in renewable energy. The Southern Company has a broader geographic footprint and a larger scale, with more extensive generation assets and pipeline infrastructure. In contrast, WEC Energy Group has a more regionally focused operation, emphasizing electric transmission and diverse energy resources across a smaller workforce and market capitalization.
Income Statement Comparison
The table below compares key income statement metrics for The Southern Company and WEC Energy Group, Inc. based on their most recent fiscal year data.
| Metric | The Southern Company | WEC Energy Group, Inc. |
|---|---|---|
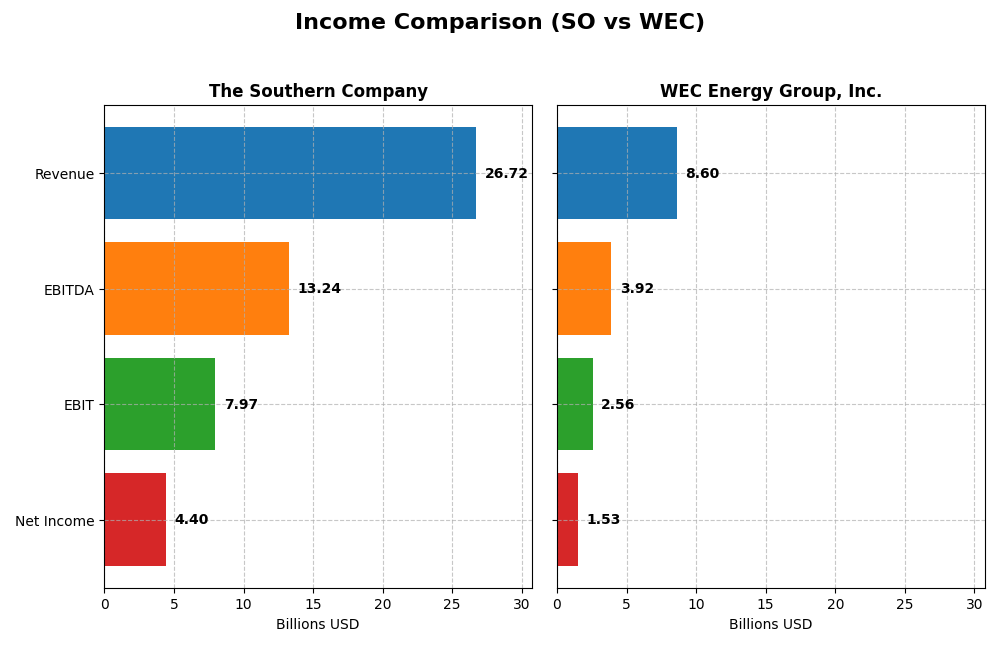
| Market Cap | 95.7B | 33.5B |
| Revenue | 26.7B | 8.6B |
| EBITDA | 13.2B | 3.9B |
| EBIT | 7.97B | 2.56B |
| Net Income | 4.40B | 1.53B |
| EPS | 4.02 | 4.81 |
| Fiscal Year | 2024 | 2024 |
Income Statement Interpretations
The Southern Company
The Southern Company showed a steady revenue increase of 31.16% from 2020 to 2024, with net income rising 40.43% over the same period. Gross and EBIT margins remained favorable at 49.93% and 29.83%, respectively. In 2024, revenue grew modestly by 5.83%, while net income and EPS advanced by 4.6% and 10.22%, signaling solid profitability despite slightly higher operating expenses.
WEC Energy Group, Inc.
WEC Energy Group experienced an overall revenue growth of 18.76% and net income growth of 27.25% from 2020 to 2024. Its gross margin was favorable at 44.02%, and EBIT margin closely matched at 29.79%. Despite a 3.3% revenue decline in 2024, net margin improved by 18.58% and EPS rose 14.45%, reflecting efficient cost management and margin expansion in the most recent year.
Which one has the stronger fundamentals?
Both companies have favorable income statements with strong margin profiles and growth in net income and EPS over five years. The Southern Company shows higher revenue growth and gross margin, but with somewhat higher interest expenses. WEC Energy Group’s recent revenue dip contrasts with improved margins and better expense control. Overall, both exhibit solid fundamentals with distinct strengths.
Financial Ratios Comparison
The table below presents a side-by-side comparison of key financial ratios for The Southern Company (SO) and WEC Energy Group, Inc. (WEC) based on the most recent fiscal year data from 2024.
| Ratios | The Southern Company (SO) | WEC Energy Group, Inc. (WEC) |
|---|---|---|
| ROE | 13.3% | 12.3% |
| ROIC | 4.3% | 4.1% |
| P/E | 20.5 | 19.5 |
| P/B | 2.72 | 2.39 |
| Current Ratio | 0.67 | 0.60 |
| Quick Ratio | 0.46 | 0.43 |
| D/E | 2.0 | 1.64 |
| Debt-to-Assets | 45.7% | 42.9% |
| Interest Coverage | 2.58 | 2.64 |
| Asset Turnover | 0.18 | 0.18 |
| Fixed Asset Turnover | 0.25 | 0.25 |
| Payout Ratio | 67.1% | 69.1% |
| Dividend Yield | 3.27% | 3.55% |
Interpretation of the Ratios
The Southern Company
The Southern Company presents a mixed ratio profile with strong net margin (16.47%, favorable) and dividend yield (3.27%, favorable), but weak liquidity (current ratio 0.67, quick ratio 0.46) and leverage (debt-to-equity 2.0, unfavorable). Asset turnover is low at 0.18, indicating limited efficiency. Dividend payments are supported, yet free cash flow coverage is weak, signaling caution.
WEC Energy Group, Inc.
WEC Energy Group shows solid net margin (17.77%, favorable) and dividend yield (3.55%, favorable), with neutral ROE (12.3%) and debt-to-assets (42.92%). Liquidity ratios remain below 1 (current ratio 0.6, quick ratio 0.43), and debt-to-equity is elevated at 1.64. Asset turnover is low (0.18), reflecting operational constraints. Dividends appear sustainable under current metrics.
Which one has the best ratios?
Both companies share similar favorable ratios in profitability and dividend yield, but face challenges in liquidity and asset efficiency. The Southern Company has higher leverage and weaker liquidity than WEC, which slightly improves WEC’s risk profile. Overall, neither company demonstrates clearly superior ratios, with both assessed as slightly unfavorable globally.
Strategic Positioning
This section compares the strategic positioning of The Southern Company and WEC Energy Group, Inc. in terms of Market position, Key segments, and Exposure to technological disruption:
The Southern Company
- Larger market cap of 95.7B with lower beta, indicating less volatility and established market presence.
- Diverse segments including gas distribution, pipeline investments, wholesale gas services, and renewable power generation.
- Exposure includes hydroelectric, fossil fuel, nuclear, solar, wind, fuel cell, and battery storage facilities.
WEC Energy Group, Inc.
- Smaller market cap of 33.5B with moderate beta, showing moderate volatility and regional focus.
- Operates through regional segments plus non-utility energy infrastructure and electric transmission.
- Generates electricity from coal, natural gas, oil, hydro, wind, solar, biomass, with electric transmission services.
The Southern Company vs WEC Energy Group, Inc. Positioning
The Southern Company pursues a diversified energy portfolio across multiple states and technologies with a large customer base, while WEC Energy Group focuses on regional operations and a narrower segment approach. Southern’s breadth offers scale, WEC’s focus may allow operational specialization.
Which has the best competitive advantage?
Both companies are shedding value with ROIC below WACC, but both show growing profitability trends. Southern Company’s larger scale and diversified assets contrast with WEC’s regional concentration; neither demonstrates a clearly superior moat based on current data.
Stock Comparison
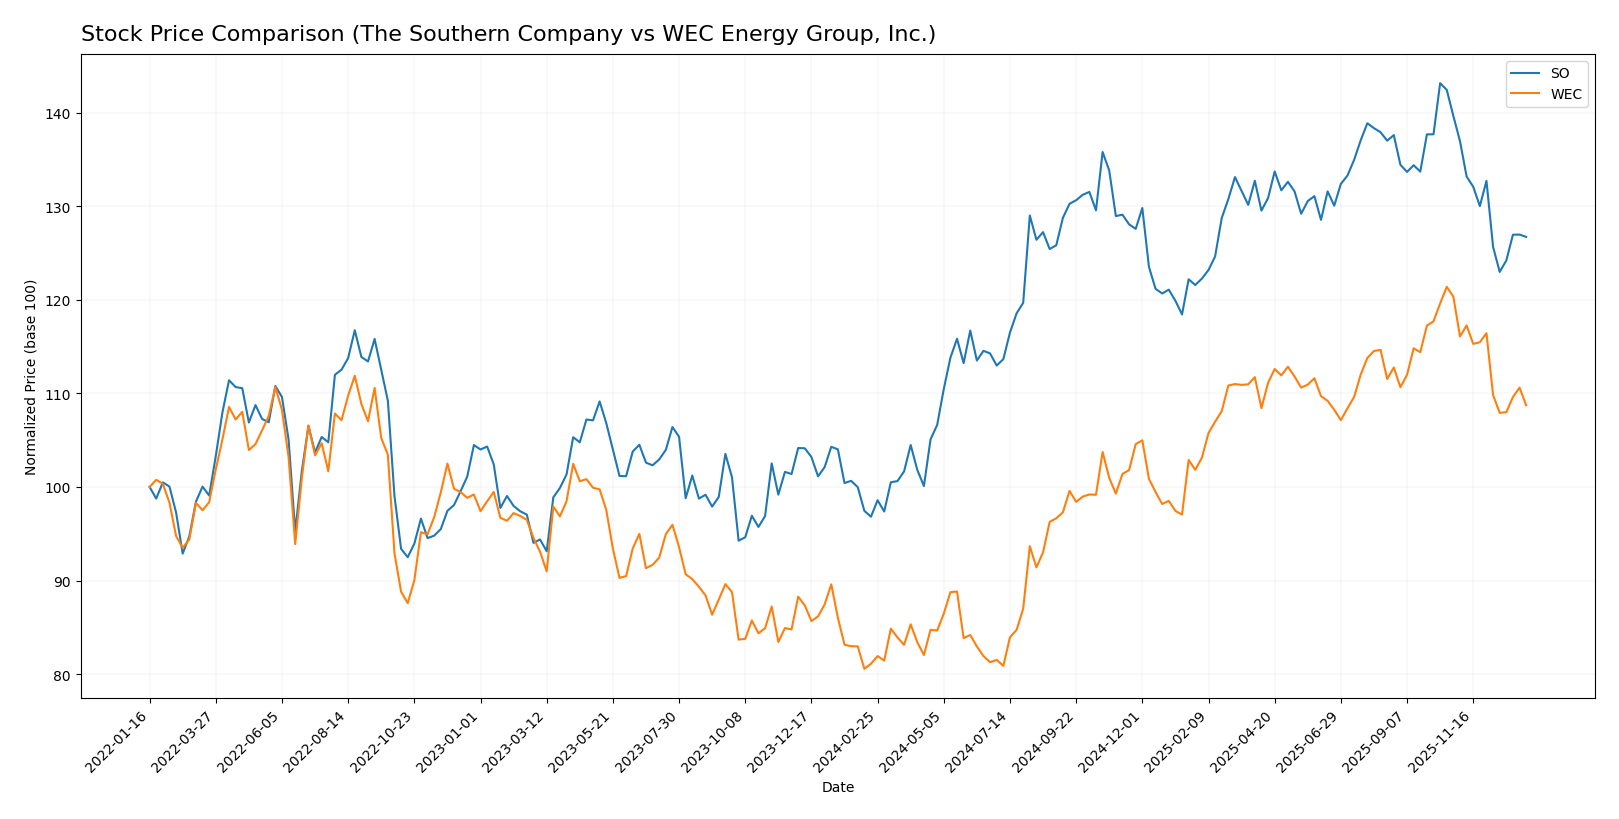
The stock prices of The Southern Company (SO) and WEC Energy Group, Inc. (WEC) have shown notable bullish trends over the past 12 months, with both experiencing deceleration in price gains and recent downward pressure in the final quarter.
Trend Analysis
The Southern Company’s stock increased by 30.88% over the past year with a decelerating bullish trend and a price range between 66.48 and 98.29. Recent months show a -9.25% decline with mild volatility.
WEC Energy Group’s stock rose 34.05% over the past year, also with decelerating momentum and a wider price range from 77.85 to 116.84. The recent trend reveals a -9.65% drop and slightly higher volatility.
Comparing both, WEC delivered the highest market performance with a 34.05% gain versus SO’s 30.88%, despite similar recent declines and decelerating bullish trends.
Target Prices
The current analyst consensus on target prices for these utilities reflects moderate upside potential.
| Company | Target High | Target Low | Consensus |
|---|---|---|---|
| The Southern Company | 103 | 76 | 93.1 |
| WEC Energy Group, Inc. | 136 | 105 | 122.67 |
Analysts expect The Southern Company’s stock to trade moderately above its current price of $87.01, while WEC Energy Group shows a stronger upside potential compared to its $104.65 market price.
Analyst Opinions Comparison
This section compares analysts’ ratings and financial scores for The Southern Company and WEC Energy Group, Inc.:
Rating Comparison
SO Rating
- Rating: B-; considered very favorable by analysts.
- Discounted Cash Flow Score: Moderate at 3.
- ROE Score: Favorable at 4, indicating efficient profit generation.
- ROA Score: Moderate at 3, showing average asset utilization.
- Debt To Equity Score: Very unfavorable at 1, indicating higher financial risk.
- Overall Score: Moderate at 3.
WEC Rating
- Rating: B-; also considered very favorable by analysts.
- Discounted Cash Flow Score: Very unfavorable at 1.
- ROE Score: Favorable at 4, indicating efficient profit generation.
- ROA Score: Favorable at 4, showing strong asset utilization.
- Debt To Equity Score: Moderate at 2, indicating moderate financial risk.
- Overall Score: Moderate at 3.
Which one is the best rated?
Both companies share the same B- rating and overall moderate score. However, SO has a better discounted cash flow score, while WEC scores higher on ROA and debt-to-equity, reflecting differing financial strengths.
Scores Comparison
Here is a comparison of the financial health scores for The Southern Company and WEC Energy Group, Inc.:
SO Scores
- Altman Z-Score: 0.98, in distress zone, high bankruptcy risk.
- Piotroski Score: 6, average financial strength.
WEC Scores
- Altman Z-Score: 1.14, in distress zone, high bankruptcy risk.
- Piotroski Score: 6, average financial strength.
Which company has the best scores?
Both companies have Altman Z-Scores placing them in the distress zone, indicating high bankruptcy risk. Their Piotroski Scores are identical at 6, reflecting average financial strength. Neither company demonstrates a clear advantage in scores.
Grades Comparison
Here is a comparison of the latest available grades from recognized grading companies for the two companies:
The Southern Company Grades
The table below summarizes recent grades for The Southern Company from major financial institutions:
| Grading Company | Action | New Grade | Date |
|---|---|---|---|
| UBS | Maintain | Neutral | 2025-12-17 |
| JP Morgan | Maintain | Neutral | 2025-12-15 |
| Jefferies | Maintain | Neutral | 2025-12-15 |
| RBC Capital | Maintain | Sector Perform | 2025-12-12 |
| Keybanc | Maintain | Underweight | 2025-12-12 |
| Mizuho | Maintain | Neutral | 2025-12-11 |
| Barclays | Maintain | Equal Weight | 2025-11-20 |
| Jefferies | Downgrade | Neutral | 2025-11-05 |
| Ladenburg Thalmann | Downgrade | Neutral | 2025-10-17 |
| Keybanc | Maintain | Underweight | 2025-10-15 |
Overall, grades for The Southern Company predominantly indicate a neutral or hold stance, with some underweight ratings and recent downgrades from buy to neutral.
WEC Energy Group, Inc. Grades
Below are recent grades for WEC Energy Group, Inc. from reputable grading firms:
| Grading Company | Action | New Grade | Date |
|---|---|---|---|
| B of A Securities | Maintain | Neutral | 2025-12-31 |
| UBS | Maintain | Neutral | 2025-12-17 |
| Barclays | Maintain | Underweight | 2025-12-16 |
| Keybanc | Maintain | Overweight | 2025-12-12 |
| JP Morgan | Maintain | Neutral | 2025-12-11 |
| Scotiabank | Maintain | Sector Outperform | 2025-10-31 |
| BMO Capital | Maintain | Market Perform | 2025-10-21 |
| Barclays | Maintain | Equal Weight | 2025-10-21 |
| Keybanc | Maintain | Overweight | 2025-10-15 |
| UBS | Maintain | Neutral | 2025-10-10 |
WEC Energy Group’s grades show a mix of neutral and overweight ratings, with some positive sector outperform and market perform designations, suggesting a generally stable to favorable outlook.
Which company has the best grades?
Comparing the two, WEC Energy Group has received comparatively better grades, including overweight and sector outperform ratings, whereas The Southern Company mostly holds neutral and underweight grades. This difference may influence investor perceptions of potential upside and risk profiles.
Strengths and Weaknesses
Below is a comparison of key strengths and weaknesses for The Southern Company (SO) and WEC Energy Group, Inc. (WEC) based on the most recent data and financial indicators.
| Criterion | The Southern Company (SO) | WEC Energy Group, Inc. (WEC) |
|---|---|---|
| Diversification | Moderate: Strong gas and electric utilities, with notable gas marketing and pipeline investments | Moderate: Primarily utility operations in Wisconsin and Illinois with non-utility infrastructure |
| Profitability | Net margin 16.47% (favorable), ROIC 4.25% (unfavorable), growing ROIC but still shedding value | Net margin 17.77% (favorable), ROIC 4.14% (unfavorable), growing ROIC but shedding value |
| Innovation | Moderate: Focus on traditional and renewable energy segments, but limited rapid innovation | Moderate: Investments in energy infrastructure, steady but slow innovation pace |
| Global presence | Limited: Primarily regional US markets, no significant global footprint | Limited: Regional US focus, particularly Midwest states |
| Market Share | Strong regional presence in Southeast US utilities | Strong regional presence in Midwest utilities |
Key takeaways: Both companies show solid profitability with favorable net margins and improving ROIC trends, though currently both are slightly value-destroying due to ROIC below WACC. Their diversification and innovation are moderate, focused mainly on regional utility markets. Investors should weigh the improving profitability against the moderate risk from value destruction.
Risk Analysis
Below is a comparative table summarizing key risks for The Southern Company (SO) and WEC Energy Group, Inc. (WEC) based on 2024 financial and operational data:
| Metric | The Southern Company (SO) | WEC Energy Group, Inc. (WEC) |
|---|---|---|
| Market Risk | Low beta (0.45) suggests lower volatility; moderate P/E (20.5) | Slightly higher beta (0.57); moderate P/E (19.46) |
| Debt Level | High debt-to-equity (2.0) and debt-to-assets (45.65%); interest coverage moderate (2.91) | Lower debt-to-equity (1.64) and debt-to-assets (42.92%); interest coverage slightly better (3.14) |
| Regulatory Risk | Significant exposure due to regulated electric utility operations across multiple states | Similar regulatory exposure as a regulated utility with multi-state operations |
| Operational Risk | Large asset base with diverse generation methods; some inefficiencies (low asset turnover 0.18) | Also diversified generation and distribution; similar operational efficiency challenges |
| Environmental Risk | Exposure from fossil fuel and nuclear stations; ongoing renewables expansion mitigates risk | Mix of coal, gas, renewables; active transition to cleaner energy reduces environmental liabilities |
| Geopolitical Risk | Mainly US-focused; limited direct geopolitical risk | US-focused with stable regional presence; geopolitical risk minimal |
The most impactful risks for both companies are their high debt levels and operational inefficiencies, which could strain financial flexibility. Regulatory changes remain a key uncertainty in the evolving energy sector. Both firms are in financial distress zones per Altman Z-scores, indicating caution. Environmental transition efforts offer some risk mitigation but require capital investment.
Which Stock to Choose?
The Southern Company (SO) shows favorable income growth with a 31.16% revenue increase over five years and a solid 16.47% net margin in 2024. Its financial ratios are slightly unfavorable overall, marked by high debt and weak liquidity, despite a favorable dividend yield. The company has a slightly unfavorable moat rating, indicating value destruction but improving profitability. SO’s rating is very favorable with moderate overall scores, though its Altman Z-Score signals financial distress.
WEC Energy Group, Inc. (WEC) presents favorable income metrics, including a 17.77% net margin and consistent earnings growth, despite a slight revenue decline last year. Its financial ratios mirror SO’s slightly unfavorable profile, influenced by debt levels and liquidity constraints, yet it maintains a favorable dividend yield. WEC also holds a slightly unfavorable moat status, with growing ROIC but value destruction. The rating matches SO’s very favorable status, with somewhat better debt-to-equity scores but a distress zone Altman Z-Score.
Investors focused on income growth might see potential in SO due to its stronger revenue and earnings expansion, while those prioritizing stability could interpret WEC’s steadier margins and moderate debt profile as advantageous. Both stocks share slightly unfavorable financial ratios and moat evaluations, suggesting caution; their similar ratings imply neither clearly outperforms the other, making the choice contingent on individual risk tolerance and investment strategy.
Disclaimer: Investment carries a risk of loss of initial capital. The past performance is not a reliable indicator of future results. Be sure to understand risks before making an investment decision.
Go Further
I encourage you to read the complete analyses of The Southern Company and WEC Energy Group, Inc. to enhance your investment decisions: