Home > Comparison > Financial Services > PGR vs WRB
The strategic rivalry between The Progressive Corporation and W. R. Berkley Corporation shapes the property and casualty insurance sector’s future. Progressive operates as a diversified insurer with broad personal and commercial lines, leveraging scale and digital distribution. Berkley focuses on specialized commercial insurance and reinsurance, emphasizing niche risk management. This analysis will assess which business model offers superior risk-adjusted returns, guiding investors seeking balanced exposure in financial services.

Table of contents
Companies Overview
Two leading players in the US property and casualty insurance market, The Progressive Corporation and W. R. Berkley Corporation shape sector dynamics with distinct approaches.
The Progressive Corporation: Innovator in Personal and Commercial Auto Insurance
The Progressive Corporation dominates the personal and commercial auto insurance market with its diverse product mix spanning personal autos, recreational vehicles, and commercial vehicles. Its core revenue derives from underwriting policies through Personal Lines, Commercial Lines, and Property segments. In 2026, Progressive sharpens its focus on expanding digital direct-to-consumer sales and enhancing claims services to drive growth and customer retention.
W. R. Berkley Corporation: Specialist in Commercial Insurance and Reinsurance
W. R. Berkley Corporation excels as a commercial lines underwriter with a broad portfolio including liability, workers’ compensation, and specialty insurance. Its revenue engine relies on underwriting commercial risks and providing reinsurance solutions globally. In 2026, Berkley prioritizes deepening its specialty insurance offerings and expanding international reinsurance capabilities to strengthen its competitive moat.
Strategic Collision: Similarities & Divergences
Both firms operate in property and casualty insurance, yet Progressive pursues a volume-driven, customer-facing model, while Berkley targets niche commercial and reinsurance segments with tailored underwriting expertise. Their primary battleground lies in capturing commercial insurance market share. Investors face distinct profiles: Progressive offers scale and digital innovation, whereas Berkley delivers specialized underwriting and global diversification.
Income Statement Comparison
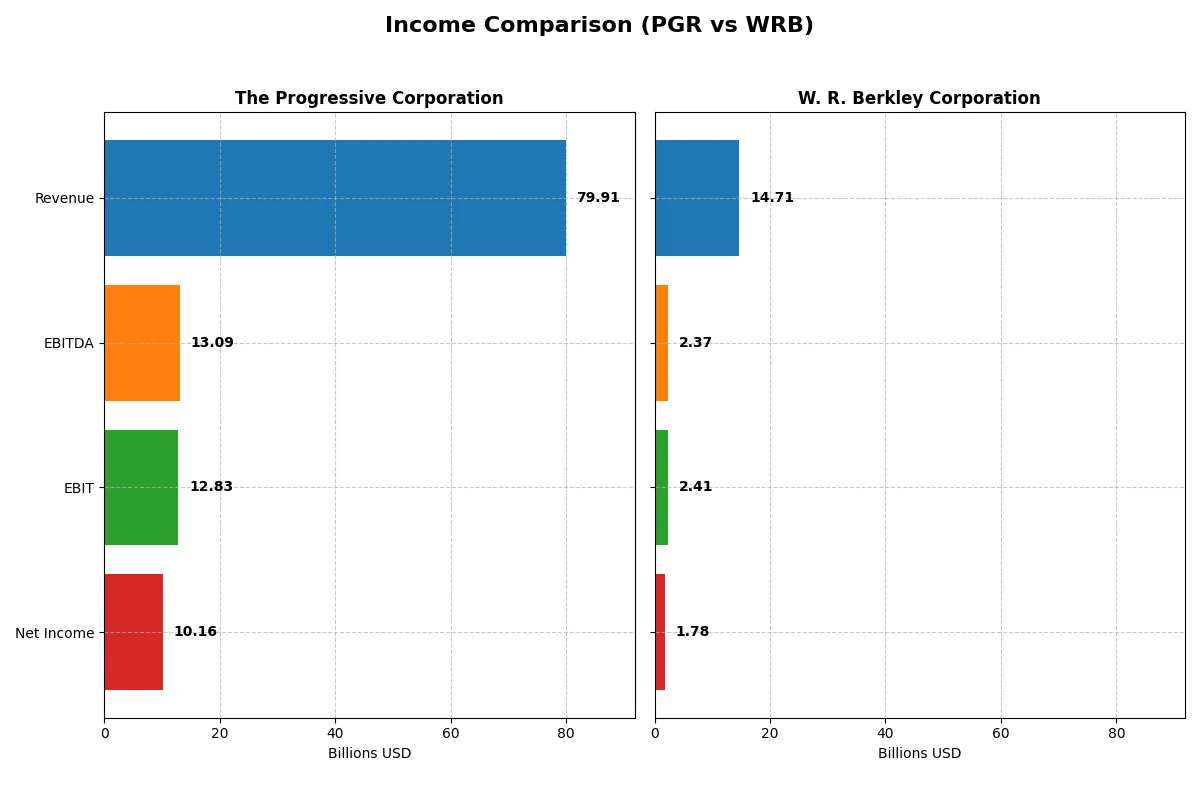
This data dissects the core profitability and scalability of both corporate engines to reveal who dominates the bottom line:
| Metric | The Progressive Corporation (PGR) | W. R. Berkley Corporation (WRB) |
|---|---|---|
| Revenue | 79.9B | 14.7B |
| Cost of Revenue | 55.3B | 11.8B |
| Operating Expenses | 11.8B | 579M |
| Gross Profit | 24.6B | 2.9B |
| EBITDA | 13.1B | 2.4B |
| EBIT | 12.8B | 2.4B |
| Interest Expense | 255M | 127M |
| Net Income | 10.2B | 1.3B |
| EPS | 17.27 | 4.48 |
| Fiscal Year | 2025 | 2025 |
Income Statement Analysis: The Bottom-Line Duel
This income statement comparison reveals the core efficiency and profitability dynamics driving each company’s financial engine in 2025.
The Progressive Corporation Analysis
Progressive’s revenue surged to $79.9B in 2025, up 6% year-over-year, while net income soared 20% to $10.2B. The company commands robust gross and net margins, at 30.8% and 12.7% respectively, reflecting strong cost control and pricing power. Efficiency improved as EBIT margin expanded to 16.1%, signaling sustained momentum in profitability.
W. R. Berkley Corporation Analysis
Berkley grew revenue by 7.8% to $14.7B in 2025, with net income rising modestly to $1.8B. Gross margin softened to 19.8%, indicating pressure on cost management, though EBIT margin remained healthy at 16.4%. Net margin contracted slightly to 12.1%, suggesting mixed operational efficiency despite solid top-line growth.
Verdict: Margin Power vs. Revenue Scale
Progressive outpaces Berkley with superior margin expansion and sharper net income growth, underscoring a more efficient profit engine. Berkley’s revenue growth is steady, but margin compression limits bottom-line gains. For investors prioritizing profitability and operational leverage, Progressive’s profile offers a stronger fundamental appeal.
Financial Ratios Comparison
These vital ratios act as a diagnostic tool to expose the underlying fiscal health, valuation premiums, and capital efficiency of the companies compared below:
| Ratios | The Progressive Corporation (PGR) | W. R. Berkley Corporation (WRB) |
|---|---|---|
| ROE | 2.23% (2025) | 0% (2025) |
| ROIC | 9.30% (2025) | 0% (2025) |
| P/E | 13.19 (2025) | 15.63 (2025) |
| P/B | 29.35 (2025) | N/A |
| Current Ratio | 0 (2025) | 0 (2025) |
| Quick Ratio | 0 (2025) | 0 (2025) |
| D/E | 0 (2025) | 0 (2025) |
| Debt-to-Assets | 0 (2025) | 0 (2025) |
| Interest Coverage | 50.33 (2025) | 18.40 (2025) |
| Asset Turnover | 0.88 (2025) | 0 (2025) |
| Fixed Asset Turnover | 0 (2025) | 0 (2025) |
| Payout ratio | 28.37% (2025) | 41.24% (2025) |
| Dividend yield | 2.15% (2025) | 2.64% (2025) |
| Fiscal Year | 2025 | 2025 |
Efficiency & Valuation Duel: The Vital Signs
Ratios act as the company’s DNA, revealing hidden risks and operational excellence that shape investor confidence and long-term value creation.
The Progressive Corporation
The Progressive Corporation demonstrates strong profitability with a robust 222.54% ROE and a solid 12.72% net margin. Its P/E ratio of 13.19 signals a reasonably priced stock, though a high P/B ratio of 29.35 raises valuation concerns. Progressive rewards shareholders with a 2.15% dividend yield, reflecting consistent income distribution alongside growth.
W. R. Berkley Corporation
W. R. Berkley posts a respectable 12.1% net margin but lacks reported ROE and ROIC, casting uncertainty on capital efficiency. Its P/E at 15.63 appears fair but less attractive than Progressive’s. Berkley offers a slightly higher dividend yield of 2.64%, balancing modest returns against incomplete profitability data and a neutral valuation stance.
Valuation Discipline vs. Profitability Clarity
Progressive excels in operational profitability and maintains a favorable valuation profile despite some balance sheet weaknesses. Berkley provides steady dividends but suffers from missing profitability metrics and a less decisive valuation. Investors prioritizing clear returns and valuation discipline may lean toward Progressive, while those favoring dividend income with some ambiguity might consider Berkley.
Which one offers the Superior Shareholder Reward?
I compare The Progressive Corporation (PGR) and W. R. Berkley Corporation (WRB) on dividends, payout ratios, and buybacks to judge shareholder reward in 2026. PGR pays a 2.15% dividend yield with a moderate 28% payout ratio, signaling sustainable income. WRB offers a slightly higher 2.64% yield but with a 41% payout ratio, which may pressure future growth. Both firms actively repurchase shares; however, PGR’s lower payout ratio and robust free cash flow coverage suggest stronger buyback sustainability. WRB’s higher leverage and payout elevate risk. I conclude PGR offers a superior total return profile due to balanced income and prudent capital allocation.
Comparative Score Analysis: The Strategic Profile
The radar chart reveals the fundamental DNA and trade-offs of The Progressive Corporation and W. R. Berkley Corporation by highlighting their financial strengths and weaknesses:
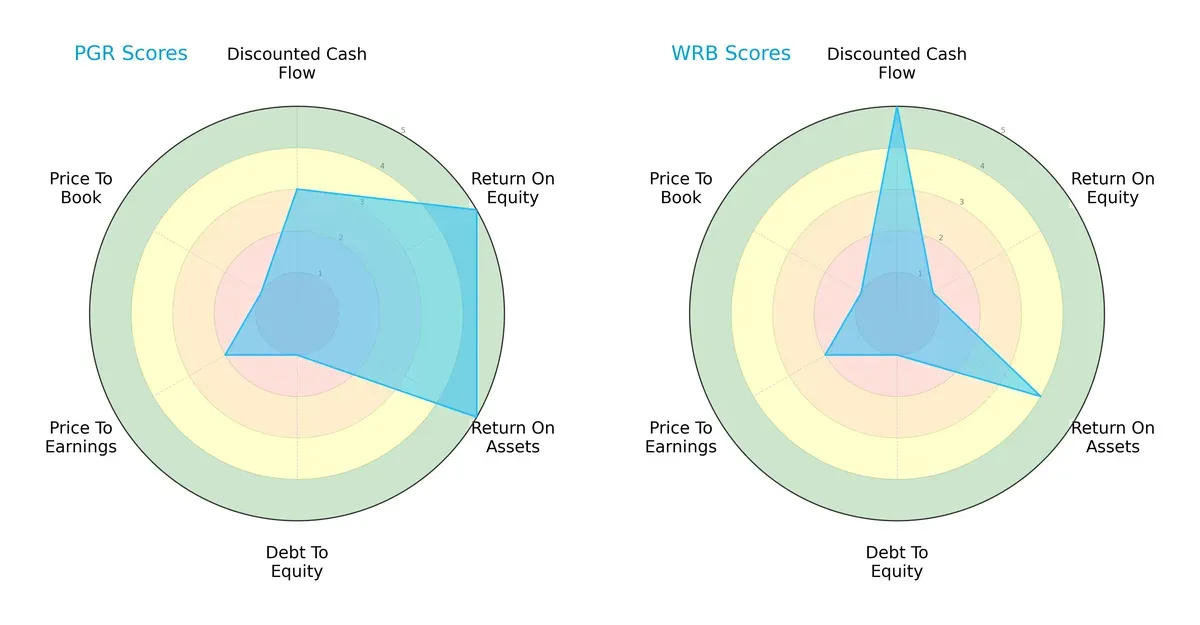
The Progressive Corporation exhibits superior profitability with high ROE and ROA scores (5 each), signaling efficient capital and asset use. However, it carries significant leverage risk, reflected in a very unfavorable debt-to-equity score (1). W. R. Berkley excels in discounted cash flow valuation (5), indicating potential undervaluation, but suffers from weak equity returns (ROE score 1). Both firms share similar moderate P/E scores (2) and poor price-to-book valuations (1). Overall, Progressive shows a more balanced profitability profile, while Berkley relies heavily on valuation strength amid operational challenges.
Bankruptcy Risk: Solvency Showdown
The Progressive Corporation’s Altman Z-Score of 3.62 places it securely in the safe zone, signaling strong solvency and low bankruptcy risk in this cycle. W. R. Berkley’s Altman Z-Score is unavailable, preventing direct comparison:

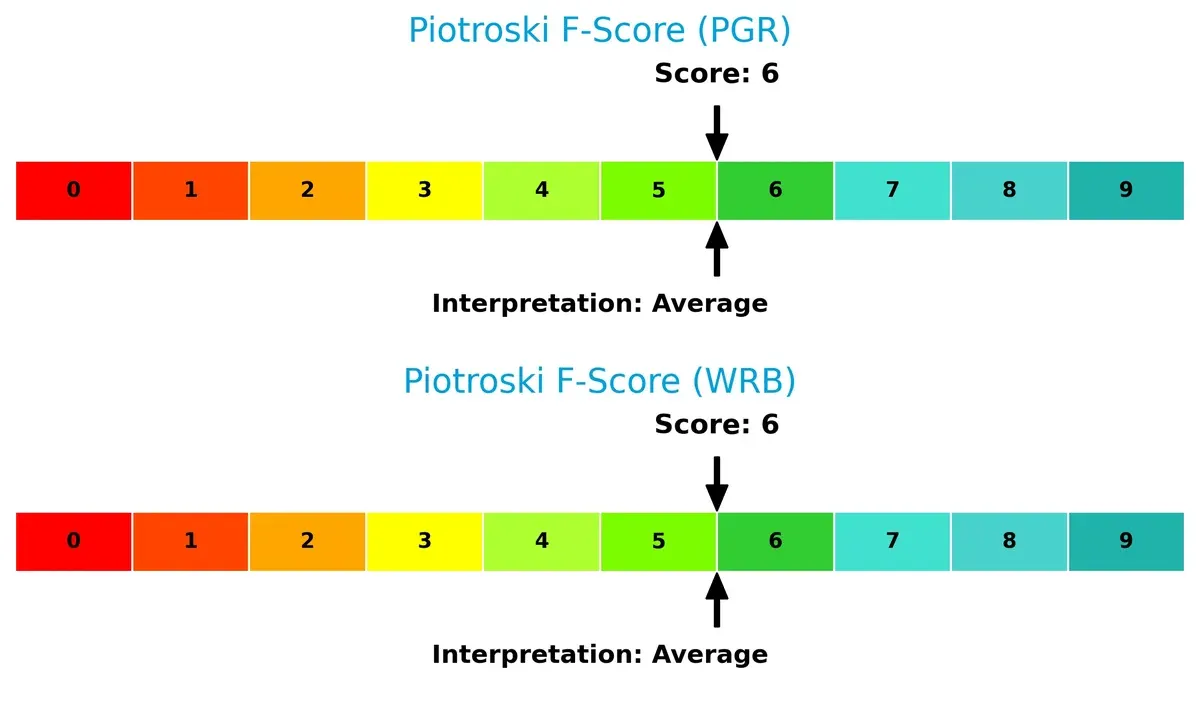
Financial Health: Quality of Operations
Both companies share an identical Piotroski F-Score of 6, indicating average financial health with no immediate red flags in profitability, leverage, or efficiency metrics:
How are the two companies positioned?
This section dissects the operational DNA of PGR and WRB by comparing their revenue distribution by segment and internal dynamics. The goal is to confront their economic moats to identify the more resilient, sustainable competitive advantage in today’s market.
Revenue Segmentation: The Strategic Mix
This visual comparison dissects how The Progressive Corporation and W. R. Berkley Corporation diversify their income streams and where their primary sector bets lie:
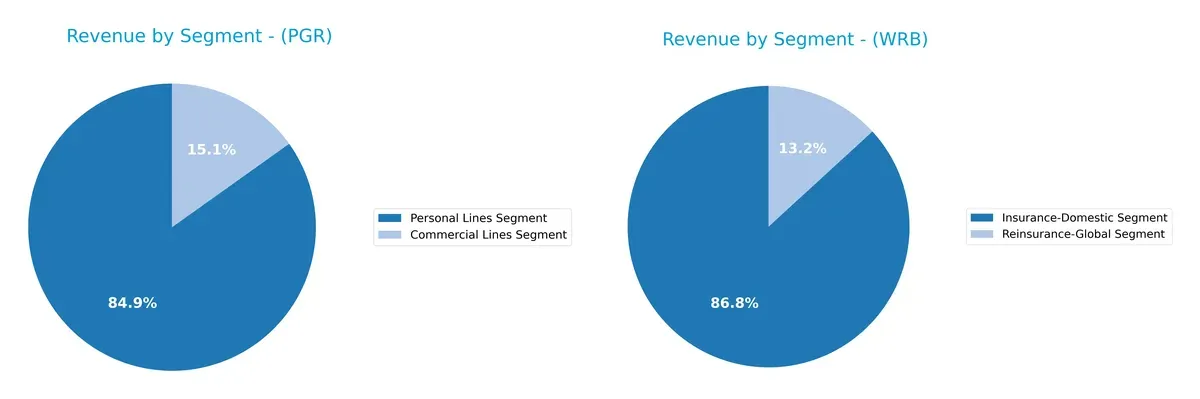
The Progressive Corporation anchors revenue heavily in Personal Lines, with $61B in 2024, dwarfing its $10.9B Commercial Lines segment. This concentration signals strong consumer-focused ecosystem lock-in but exposes it to retail market shifts. Conversely, W. R. Berkley balances $11.2B Insurance-Domestic against $1.7B Reinsurance-Global, reflecting a more diversified approach. Berkley’s mix mitigates concentration risk and leverages infrastructure dominance across insurance and reinsurance sectors.
Strengths and Weaknesses Comparison
This table compares the Strengths and Weaknesses of The Progressive Corporation (PGR) and W. R. Berkley Corporation (WRB):
PGR Strengths
- Strong net margin at 12.72%
- Exceptionally high ROE at 222.54%
- Favorable WACC at 5.33%
- Solid interest coverage of 50.33
- Diverse revenue streams with commercial and personal lines
- Consistent dividend yield at 2.15%
WRB Strengths
- Solid net margin at 12.1%
- Favorable debt metrics and interest coverage at 18.95
- Reliable dividend yield at 2.64%
- Presence in domestic insurance and global reinsurance segments
- Favorable PB ratio indicating potential undervaluation
PGR Weaknesses
- Unfavorable current and quick ratios at 0 indicating liquidity concerns
- High PB ratio at 29.35 suggesting overvaluation
- Zero fixed asset turnover points to asset utilization issues
- ROIC neutral at 9.3%
WRB Weaknesses
- ROE and ROIC at 0, signaling weak profitability returns
- Unavailable WACC metric limits cost of capital insight
- Unfavorable asset turnover ratios at 0
- Unfavorable liquidity ratios at 0 indicating potential short-term risks
Overall, PGR demonstrates strong profitability and capital efficiency but faces liquidity and valuation concerns. WRB shows solid margin control and balance sheet stability but struggles with returns and asset utilization. These contrasts highlight different strategic priorities in financial management and operational focus.
The Moat Duel: Analyzing Competitive Defensibility
A structural moat is the only thing protecting long-term profits from relentless competition and market pressures. Here’s how Progressive and Berkley defend their turf:
The Progressive Corporation: Customer-Centric Brand Strength
Progressive’s moat stems from strong brand recognition and extensive agent network, driving high ROIC and margin stability. Its growing profitability signals durable value creation. New digital tools could deepen this moat in 2026.
W. R. Berkley Corporation: Specialized Commercial Focus
Berkley leverages niche commercial insurance expertise, contrasting Progressive’s broad consumer base. Its steady EBIT margin sustains competitive positioning, but stagnant ROIC trends highlight growth challenges. Expansion into specialty lines offers growth potential.
Brand Loyalty vs. Niche Specialization
Progressive boasts a wider, more sustainable moat with rising ROIC and robust margin growth. Berkley’s specialization is solid but less expansive. Progressive better defends market share amid intensifying competition.
Which stock offers better returns?
Over the past 12 months, both stocks showed key price moves with decelerating bullish trends. Recent months reveal downward pressure despite increasing trading volumes.
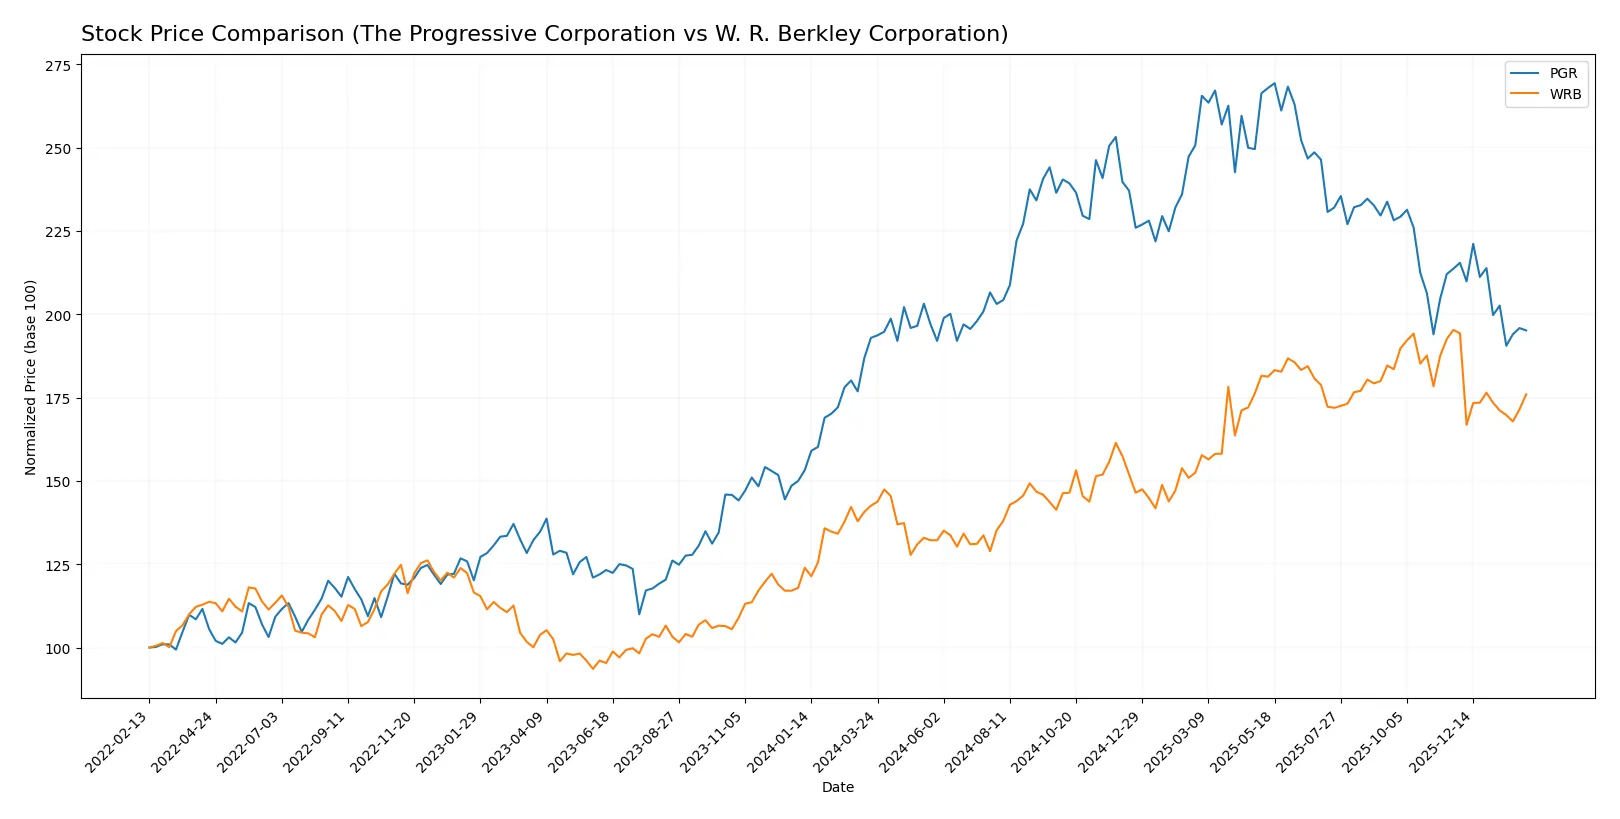
Trend Comparison
The Progressive Corporation (PGR) gained 1.15% over the past year, signaling a bullish but decelerating trend. Its price ranged between 202.37 and 286.03, with recent months showing a sharper 8.67% decline.
W. R. Berkley Corporation (WRB) rose 23.43% in the same period, also with decelerating momentum. Price fluctuated between 51.1 and 78.1, followed by a 9.9% drop recently, indicating some short-term weakness.
WRB delivered a significantly higher market return than PGR over 12 months. Both face recent downward trends, but WRB’s overall gains outpace PGR’s modest increase.
Target Prices
Analysts present a clear target price consensus for The Progressive Corporation and W. R. Berkley Corporation, reflecting moderate upside potential.
| Company | Target Low | Target High | Consensus |
|---|---|---|---|
| The Progressive Corporation | 214 | 265 | 236.55 |
| W. R. Berkley Corporation | 64 | 80 | 71 |
The Progressive Corporation’s consensus price of $236.55 suggests roughly 14% upside from the current $207.35. W. R. Berkley’s consensus at $71 indicates a modest 1% upside from its $70.44 stock price.

Don’t Let Luck Decide Your Entry Point
Optimize your entry points with our advanced ProRealTime indicators. You’ll get efficient buy signals with precise price targets for maximum performance. Start outperforming now!
How do institutions grade them?
Here is a comparison of the latest institutional grades for The Progressive Corporation and W. R. Berkley Corporation:
The Progressive Corporation Grades
The following table summarizes recent grades assigned by recognized grading firms for The Progressive Corporation.
| Grading Company | Action | New Grade | Date |
|---|---|---|---|
| Keefe, Bruyette & Woods | Maintain | Market Perform | 2026-01-30 |
| Wells Fargo | Maintain | Equal Weight | 2026-01-29 |
| BMO Capital | Maintain | Market Perform | 2026-01-29 |
| Morgan Stanley | Maintain | Underweight | 2026-01-29 |
| BMO Capital | Maintain | Market Perform | 2026-01-15 |
| Wells Fargo | Maintain | Equal Weight | 2026-01-13 |
| Barclays | Upgrade | Overweight | 2026-01-08 |
| Evercore ISI Group | Maintain | In Line | 2026-01-07 |
| JP Morgan | Maintain | Overweight | 2026-01-07 |
| Keefe, Bruyette & Woods | Maintain | Market Perform | 2026-01-06 |
W. R. Berkley Corporation Grades
Below is a summary of the latest grades issued by credible institutions for W. R. Berkley Corporation.
| Grading Company | Action | New Grade | Date |
|---|---|---|---|
| Cantor Fitzgerald | Maintain | Overweight | 2026-02-02 |
| Argus Research | Maintain | Buy | 2026-02-02 |
| Truist Securities | Maintain | Buy | 2026-01-28 |
| B of A Securities | Maintain | Neutral | 2026-01-27 |
| Mizuho | Maintain | Neutral | 2026-01-27 |
| Wells Fargo | Maintain | Equal Weight | 2026-01-27 |
| Jefferies | Maintain | Hold | 2026-01-27 |
| TD Cowen | Downgrade | Sell | 2026-01-20 |
| Cantor Fitzgerald | Maintain | Overweight | 2026-01-14 |
| Wells Fargo | Maintain | Equal Weight | 2026-01-13 |
Which company has the best grades?
W. R. Berkley Corporation holds generally more favorable grades, including multiple Buy and Overweight ratings. The Progressive Corporation tends to receive Market Perform and Equal Weight grades, with some Underweight and In Line opinions. Investors may interpret Berkley’s stronger consensus as reflecting higher confidence from analysts, potentially influencing portfolio positioning.
Risks specific to each company
The following categories identify the critical pressure points and systemic threats facing both firms in the 2026 market environment:
1. Market & Competition
The Progressive Corporation
- Dominates personal and commercial auto insurance with strong brand recognition. Faces intense price competition in personal lines.
W. R. Berkley Corporation
- Focuses on commercial and specialty lines with international exposure, benefiting from niche markets but facing specialty underwriting challenges.
2. Capital Structure & Debt
The Progressive Corporation
- Exhibits very low debt levels with excellent interest coverage at 50.3x, indicating strong balance sheet and financial flexibility.
W. R. Berkley Corporation
- Also maintains low debt with good interest coverage at 18.9x, but less robust than Progressive’s, limiting leverage capacity.
3. Stock Volatility
The Progressive Corporation
- Low beta of 0.32 signals defensive stock behavior, less sensitive to market swings.
W. R. Berkley Corporation
- Slightly higher beta at 0.36, marginally more volatile but still below market average, indicating relative stability.
4. Regulatory & Legal
The Progressive Corporation
- Faces regulatory scrutiny typical for US property & casualty insurers, with exposure to state-level insurance regulations.
W. R. Berkley Corporation
- Similar regulatory environment with added complexity from international operations, increasing compliance risk.
5. Supply Chain & Operations
The Progressive Corporation
- Operates through direct and independent agency channels; technology investments improve claims processing efficiency.
W. R. Berkley Corporation
- Relies on reinsurance and specialty underwriting partners, which may introduce operational dependencies and counterparty risk.
6. ESG & Climate Transition
The Progressive Corporation
- Increasing exposure to climate risks in property lines demands enhanced risk modeling and underwriting adjustments.
W. R. Berkley Corporation
- Faces ESG risks from specialty environmental products but has opportunity in growing sustainable insurance solutions.
7. Geopolitical Exposure
The Progressive Corporation
- Primarily US-focused, limiting geopolitical risk but subject to domestic political changes impacting insurance regulation.
W. R. Berkley Corporation
- Greater international footprint increases exposure to geopolitical uncertainty and cross-border regulatory challenges.
Which company shows a better risk-adjusted profile?
Progressive’s strongest risk is regulatory complexity in a highly competitive personal lines market. Berkley’s key risk lies in international geopolitical and operational dependencies. Progressive’s robust capital structure, low volatility, and defensive positioning yield a superior risk-adjusted profile. Its Altman Z-Score in the safe zone confirms financial resilience. Berkley’s absent Z-Score and weaker ROE highlight caution despite niche market strengths.
Final Verdict: Which stock to choose?
The Progressive Corporation’s superpower lies in its growing return on invested capital, signaling a durable competitive advantage and effective capital use. Its elevated price-to-book ratio and liquidity metrics warrant vigilance. This stock suits investors seeking aggressive growth fueled by operational excellence.
W. R. Berkley Corporation’s strategic moat is its steady free cash flow yield and favorable income quality, underpinning recurring revenue resilience. Relative to Progressive, it offers a more moderate risk profile with solid dividend yield. It fits well within a GARP (Growth at a Reasonable Price) portfolio.
If you prioritize dynamic value creation and expanding profitability, Progressive outshines due to its very favorable moat and robust income growth. However, if you seek better stability with consistent cash flows and a balanced risk approach, Berkley offers a compelling alternative despite limited moat visibility. Both present analytical scenarios tailored to distinct investor strategies.
Disclaimer: Investment carries a risk of loss of initial capital. The past performance is not a reliable indicator of future results. Be sure to understand risks before making an investment decision.
Go Further
I encourage you to read the complete analyses of The Progressive Corporation and W. R. Berkley Corporation to enhance your investment decisions: