Home > Comparison > Financial Services > PGR vs TRV
The strategic rivalry between The Progressive Corporation and The Travelers Companies, Inc. shapes the landscape of the property and casualty insurance sector. Progressive operates as a high-volume, technology-driven insurer focusing on personal and commercial lines. Travelers offers a diversified portfolio with strong commercial and specialty insurance segments. This analysis will evaluate which business model presents a superior risk-adjusted opportunity, guiding investors toward the most robust portfolio allocation in this competitive industry.

Table of contents
Companies Overview
The Progressive Corporation and The Travelers Companies, Inc. are key players shaping the U.S. property and casualty insurance market.
The Progressive Corporation: Innovator in Personal and Commercial Auto Insurance
The Progressive Corporation dominates the personal and commercial auto insurance sector. Its revenue primarily stems from personal lines covering autos, motorcycles, and RVs, alongside commercial auto and property policies. In 2026, Progressive sharpens its focus on expanding direct-to-consumer digital sales, leveraging technology to streamline underwriting and claims processing.
The Travelers Companies, Inc.: Diverse Commercial and Personal Insurance Leader
The Travelers Companies, Inc. excels as a broad commercial and personal property-casualty insurer. It generates income from business insurance, specialty bonds, and personal insurance across multiple industries and customer sizes. In 2026, Travelers emphasizes enhancing its specialty insurance offerings and strengthening broker and agency partnerships to deepen market penetration.
Strategic Collision: Similarities & Divergences
Both firms compete intensely in property and casualty insurance but diverge in strategy. Progressive prioritizes a direct-to-consumer digital model focused on personal and small commercial autos, while Travelers invests in a diversified portfolio with a broker-driven approach and broader commercial and specialty products. This contrast defines their investment profiles: Progressive as a tech-forward disruptor, Travelers as a stalwart with a diversified risk base.
Income Statement Comparison
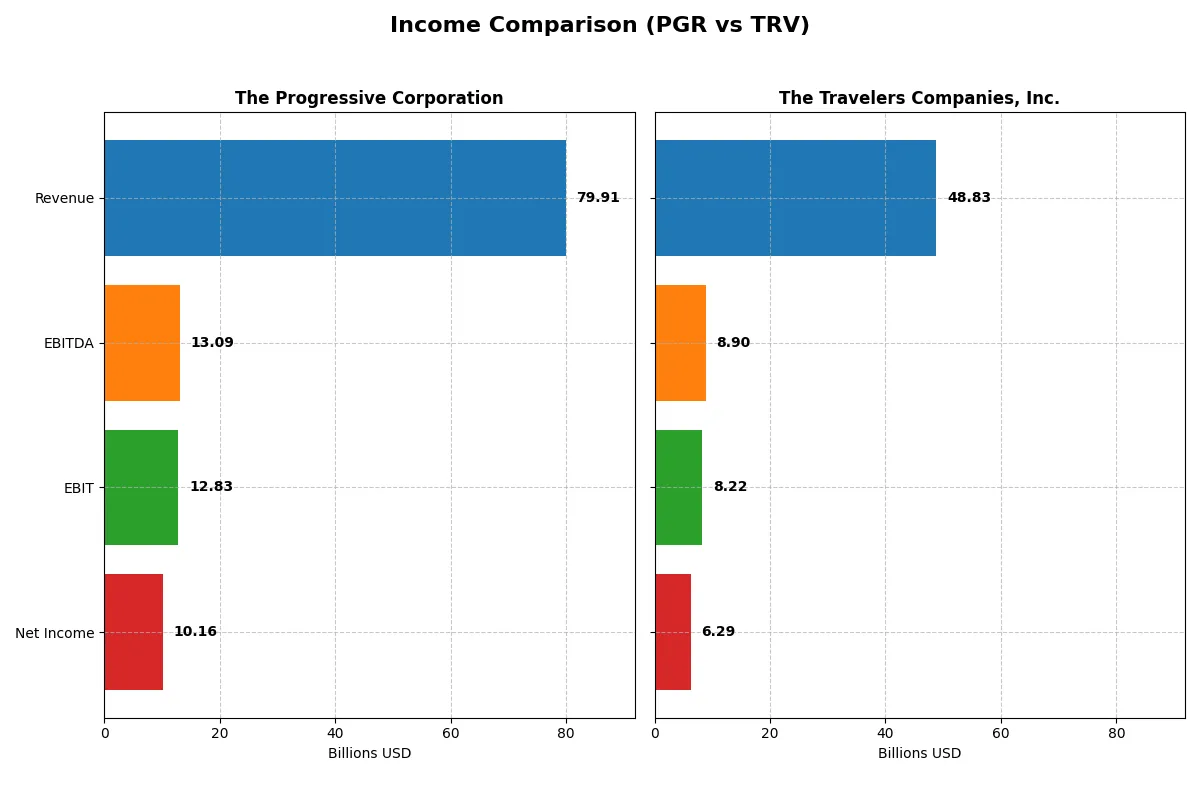
This data dissects the core profitability and scalability of both corporate engines to reveal who dominates the bottom line:
| Metric | The Progressive Corporation (PGR) | The Travelers Companies, Inc. (TRV) |
|---|---|---|
| Revenue | 79.9B | 48.8B |
| Cost of Revenue | 55.3B | 27.2B |
| Operating Expenses | 11.8B | 13.8B |
| Gross Profit | 24.6B | 21.6B |
| EBITDA | 13.1B | 8.9B |
| EBIT | 12.8B | 8.2B |
| Interest Expense | 255M | 425M |
| Net Income | 10.2B | 6.3B |
| EPS | 17.27 | 27.84 |
| Fiscal Year | 2025 | 2025 |
Income Statement Analysis: The Bottom-Line Duel
This income statement comparison reveals which company runs a more efficient and profitable corporate engine based on recent financial performance.
The Progressive Corporation Analysis
The Progressive Corporation’s revenue climbed steadily from 48B in 2021 to nearly 80B in 2025. Net income surged impressively, more than tripling from 3.3B in 2021 to 10.2B in 2025. Gross and net margins hold strong at 30.8% and 12.7%, respectively. The 2025 results highlight robust margin expansion and operational momentum, signaling high efficiency.
The Travelers Companies, Inc. Analysis
Travelers grew revenue from 34.8B in 2021 to 48.8B in 2025, showing steady expansion but at a slower pace than Progressive. Net income doubled to 6.2B over the same period. Gross margin of 44.3% outpaces Progressive, while net margin aligns closely at 12.9%. The latest year’s sharp profit growth and margin gains reflect solid cost control despite rising expenses.
Margin Strength vs. Scale and Growth
Progressive leads with superior revenue growth and a remarkable net income increase, driven by efficient cost management and expanding margins. Travelers boasts higher gross margins, indicating stronger pricing power or lower cost structure, but grows more modestly overall. Investors seeking rapid profit acceleration might favor Progressive’s dynamic profile, while those valuing margin robustness may lean toward Travelers.
Financial Ratios Comparison
These vital ratios act as a diagnostic tool to expose the underlying fiscal health, valuation premiums, and capital efficiency of the companies compared below:
| Ratios | The Progressive Corporation (PGR) | The Travelers Companies, Inc. (TRV) |
|---|---|---|
| ROE | 2.23% | 19.12% |
| ROIC | 9.30% | 12.10% |
| P/E | 13.19 | 10.34 |
| P/B | 29.35 | 1.98 |
| Current Ratio | 0 | 0.23 |
| Quick Ratio | 0 | 0.23 |
| D/E | 0 | 0.28 |
| Debt-to-Assets | 0 | 6.45% |
| Interest Coverage | 50.33 | 18.34 |
| Asset Turnover | 0.88 | 0.34 |
| Fixed Asset Turnover | 0 | 0 |
| Payout ratio | 28.37% | 15.57% |
| Dividend yield | 2.15% | 1.51% |
| Fiscal Year | 2025 | 2025 |
Efficiency & Valuation Duel: The Vital Signs
Ratios act as a company’s DNA, uncovering hidden risks and operational strengths that shape investment decisions.
The Progressive Corporation
The Progressive Corporation shows exceptional profitability with an ROE at 222.54%, signaling powerful shareholder value creation. Its P/E of 13.19 reflects a fairly priced stock relative to earnings. Despite a stretched P/B at 29.35, the company rewards investors with a 2.15% dividend yield, balancing growth and income effectively.
The Travelers Companies, Inc.
The Travelers Companies, Inc. delivers solid profitability with a 19.12% ROE and a slightly better P/E of 10.34, indicating undervaluation relative to earnings. Its P/B of 1.98 suggests reasonable market pricing. The 1.51% dividend yield is moderate, complemented by efficient capital returns and a conservative debt profile enhancing financial stability.
Premium Valuation vs. Operational Safety
Both firms hold favorable overall ratios, but Progressive’s extraordinary ROE contrasts with Travelers’ more balanced valuation metrics. I see Progressive as a growth-focused option with higher valuation risks. Travelers suits investors seeking solid returns and prudent financial management. The choice hinges on appetite for aggressive growth versus steady operational safety.
Which one offers the Superior Shareholder Reward?
I observe Progressive Corporation (PGR) delivers a 2.15% dividend yield with a moderate 28% payout, supported by strong free cash flow. Its buyback intensity appears limited but steady. Travelers (TRV) offers a lower 1.5% dividend yield and a 16% payout ratio but pairs this with a more aggressive buyback program, fueling total returns. I note PGR’s distribution is more sustainable, balancing dividends and buybacks with robust capital preservation. TRV’s model, while attractive for yield and buybacks, carries higher financial leverage and lower cash coverage. For 2026, I favor PGR’s superior blend of dividend reliability and prudent capital allocation, promising more stable shareholder reward.
Comparative Score Analysis: The Strategic Profile
The radar chart reveals the fundamental DNA and trade-offs of both firms, highlighting their core strengths and vulnerabilities:
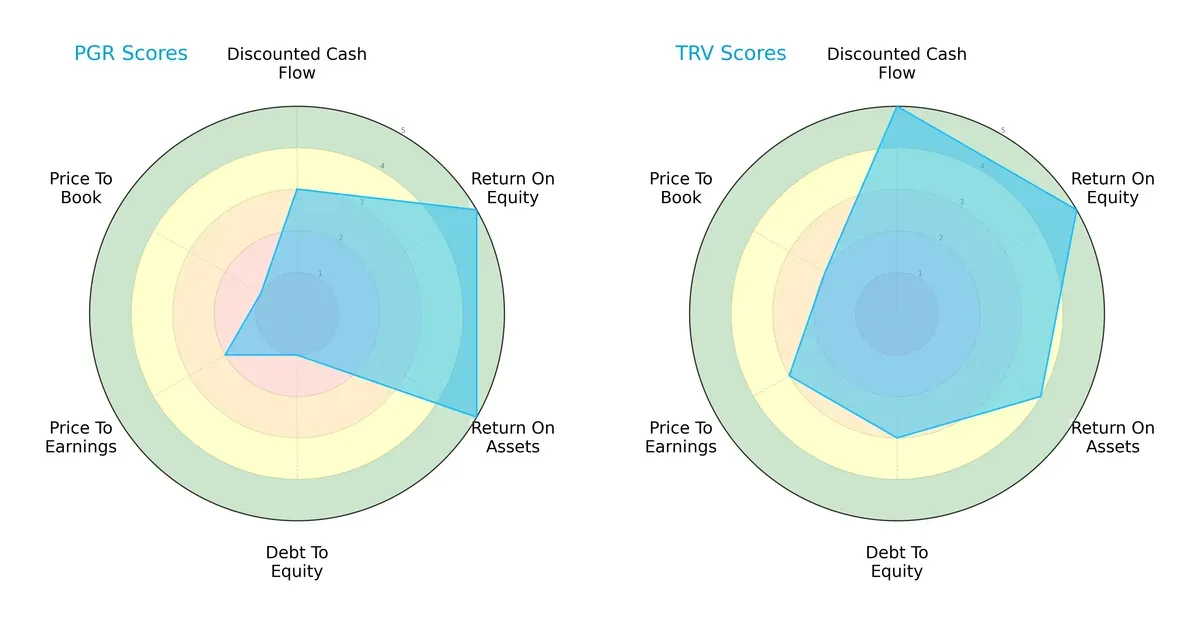
The Travelers Companies, Inc. (TRV) presents a more balanced profile with very favorable DCF, ROE, and ROA scores coupled with moderate debt and valuation metrics. The Progressive Corporation (PGR) relies heavily on operational efficiency (high ROE and ROA) but suffers from weak financial leverage and valuation scores, signaling higher balance sheet risk and potential overvaluation. TRV’s diversified strengths suggest a resilient strategy, whereas PGR’s edge is narrower but potent.
Bankruptcy Risk: Solvency Showdown
The Altman Z-Score gap signals a stark solvency contrast:
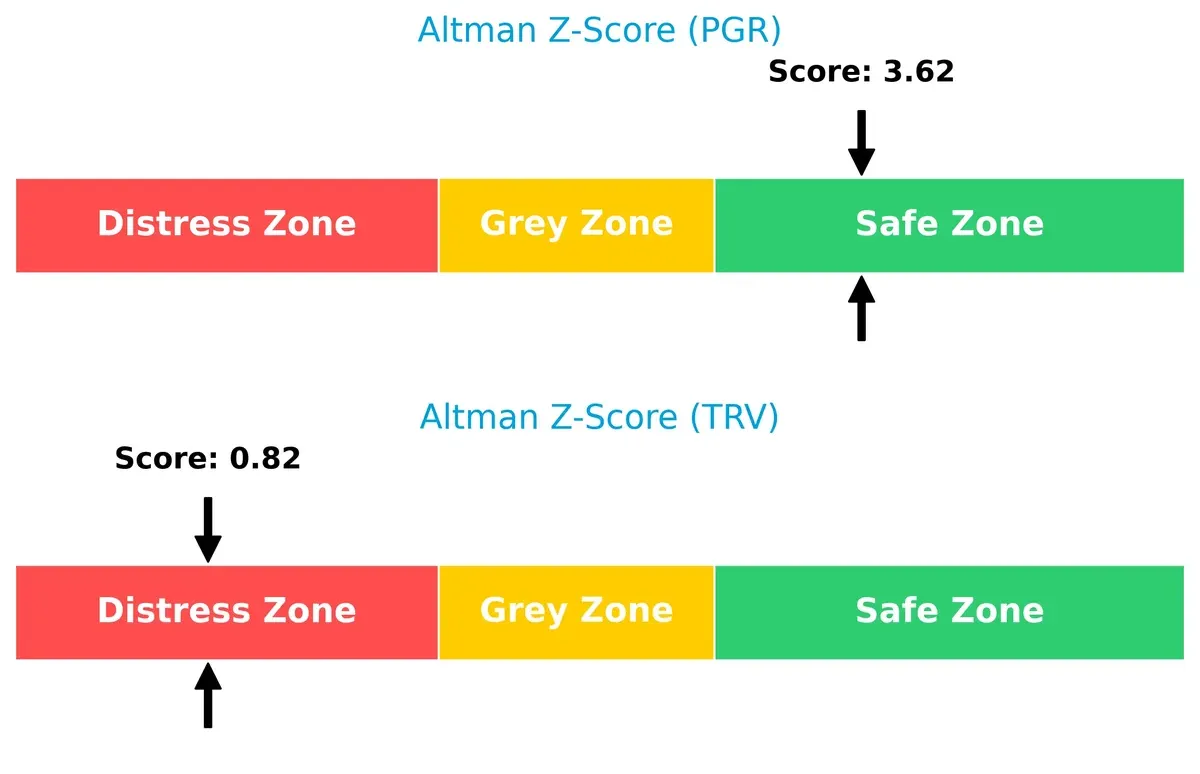
PGR scores 3.62, safely above the distress threshold, implying strong long-term survival prospects. TRV’s 0.82 places it deep in the distress zone, warning of elevated bankruptcy risk amid market stress. I view PGR as materially more solvent, a critical advantage as economic cycles tighten credit conditions.
Financial Health: Quality of Operations
Piotroski F-Score comparison highlights operational quality differences:
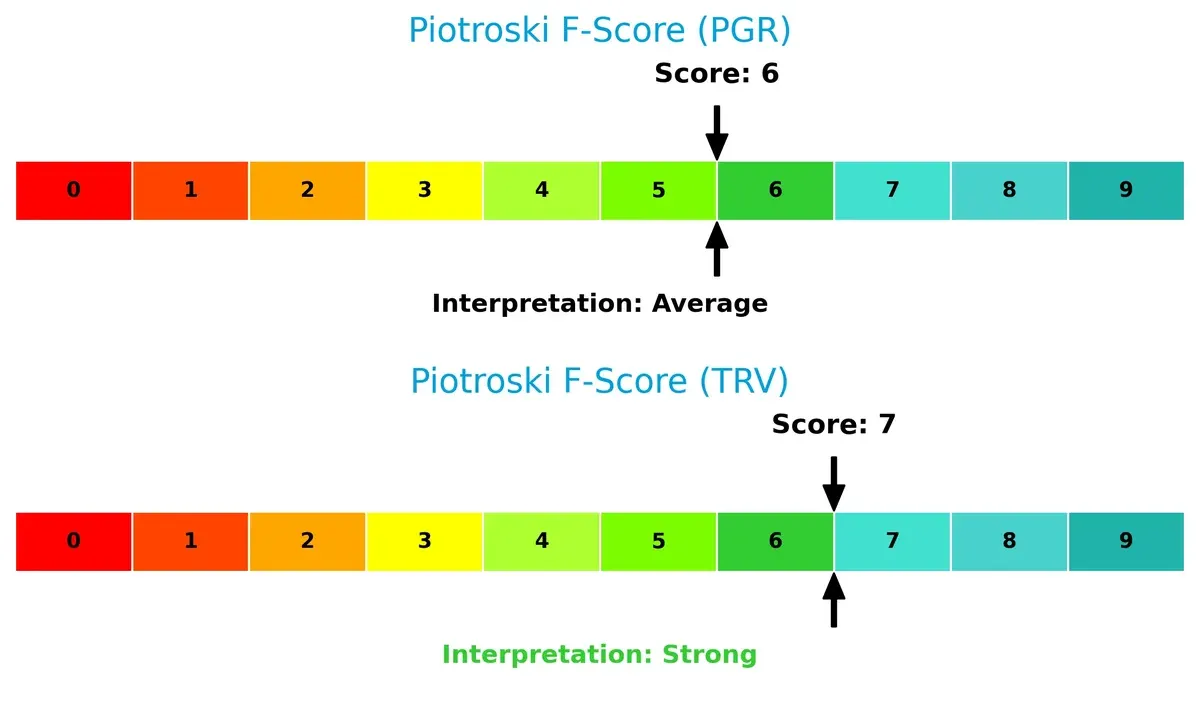
TRV’s score of 7 indicates strong financial health with solid profitability and efficiency. PGR’s 6 is average, signaling some internal weaknesses relative to TRV. While neither shows critical red flags, TRV’s metrics suggest superior resilience and internal controls, an important consideration for risk-aware investors.
How are the two companies positioned?
This section dissects the operational DNA of PGR and TRV by comparing revenue distribution and internal dynamics. The goal is to confront their economic moats and identify the more resilient, sustainable competitive advantage in today’s market.
Revenue Segmentation: The Strategic Mix
This visual comparison dissects how The Progressive Corporation and The Travelers Companies, Inc. diversify their income streams and where their primary sector bets lie:
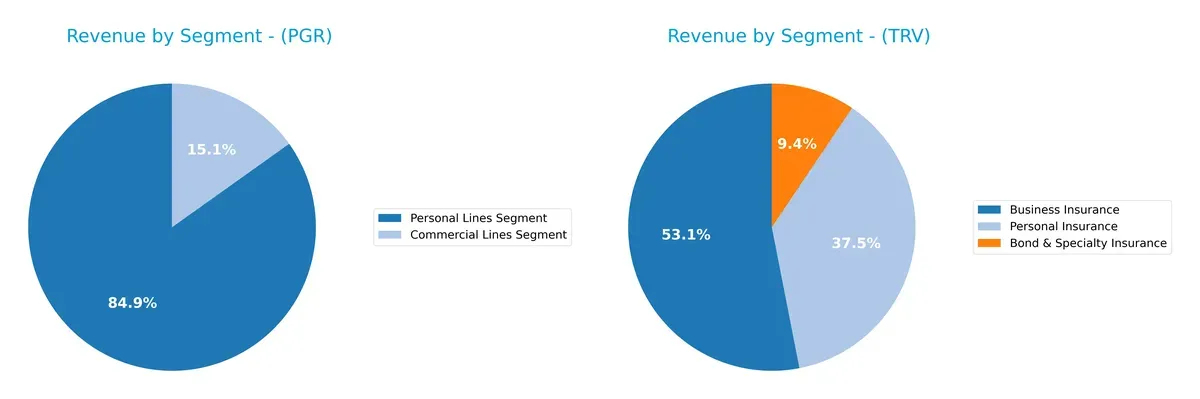
The Progressive Corporation heavily anchors its revenue in Personal Lines, reaching $61B in 2024, dwarfing its Commercial Lines at $10.9B. This signals concentrated exposure to individual consumers. Conversely, Travelers presents a more balanced portfolio with Business Insurance at $24.7B, Personal Insurance $17.4B, and Bond & Specialty Insurance $4.4B. Travelers’ diversity mitigates concentration risk, while Progressive’s focus may yield stronger brand loyalty but higher sector vulnerability.
Strengths and Weaknesses Comparison
This table compares the Strengths and Weaknesses of The Progressive Corporation (PGR) and The Travelers Companies, Inc. (TRV):
PGR Strengths
- Strong net margin at 12.72%
- Exceptionally high ROE at 222.54%
- Favorable WACC at 5.33%
- Solid dividend yield at 2.15%
- Large Personal Lines segment revenue of 61B in 2024
TRV Strengths
- Strong net margin at 12.88%
- Favorable ROIC at 12.1%
- Favorable debt ratios with 6.45% debt to assets
- Diverse revenue streams across three segments in 2024
- Geographic diversification including US, Canada, and Non-US markets
PGR Weaknesses
- Unfavorable current and quick ratios at 0 indicating liquidity concerns
- Unfavorable high PB ratio at 29.35
- Fixed asset turnover at 0 signals asset utilization issues
- Asset turnover neutral at 0.88
TRV Weaknesses
- Unfavorable current and quick ratios at 0.23 indicate liquidity constraints
- Low asset turnover at 0.34
- Fixed asset turnover at 0
- Dividend yield neutral at 1.51%
PGR excels in profitability metrics and strong personal lines revenue but faces liquidity and valuation concerns. TRV shows balanced profitability and geographic diversification but also struggles with liquidity and asset efficiency. Both companies demonstrate favorable overall financial health with specific operational challenges to address.
The Moat Duel: Analyzing Competitive Defensibility
A structural moat shields long-term profits from relentless competition erosion. Without it, sustainable advantage vanishes quickly:
The Progressive Corporation: Data-Driven Pricing and Customer Loyalty
Progressive’s moat stems from proprietary data analytics and switching costs. This enables stable margins and a 4% ROIC premium over WACC. New digital tools could deepen customer retention in 2026.
The Travelers Companies, Inc.: Diversified Portfolio with Capital Efficiency
Travelers leverages a broad commercial insurance portfolio and disciplined capital allocation. Its ROIC outpaces WACC by 6%, indicating stronger value creation. Geographic expansion and specialty lines offer growth avenues ahead.
The Moat Battle: Analytics-Driven Loyalty vs. Portfolio Diversification
Travelers holds a deeper moat, evidenced by a higher ROIC gap and broader market reach. Progressive’s data edge is robust but narrower. Travelers appears better positioned to defend and grow market share.
Which stock offers better returns?
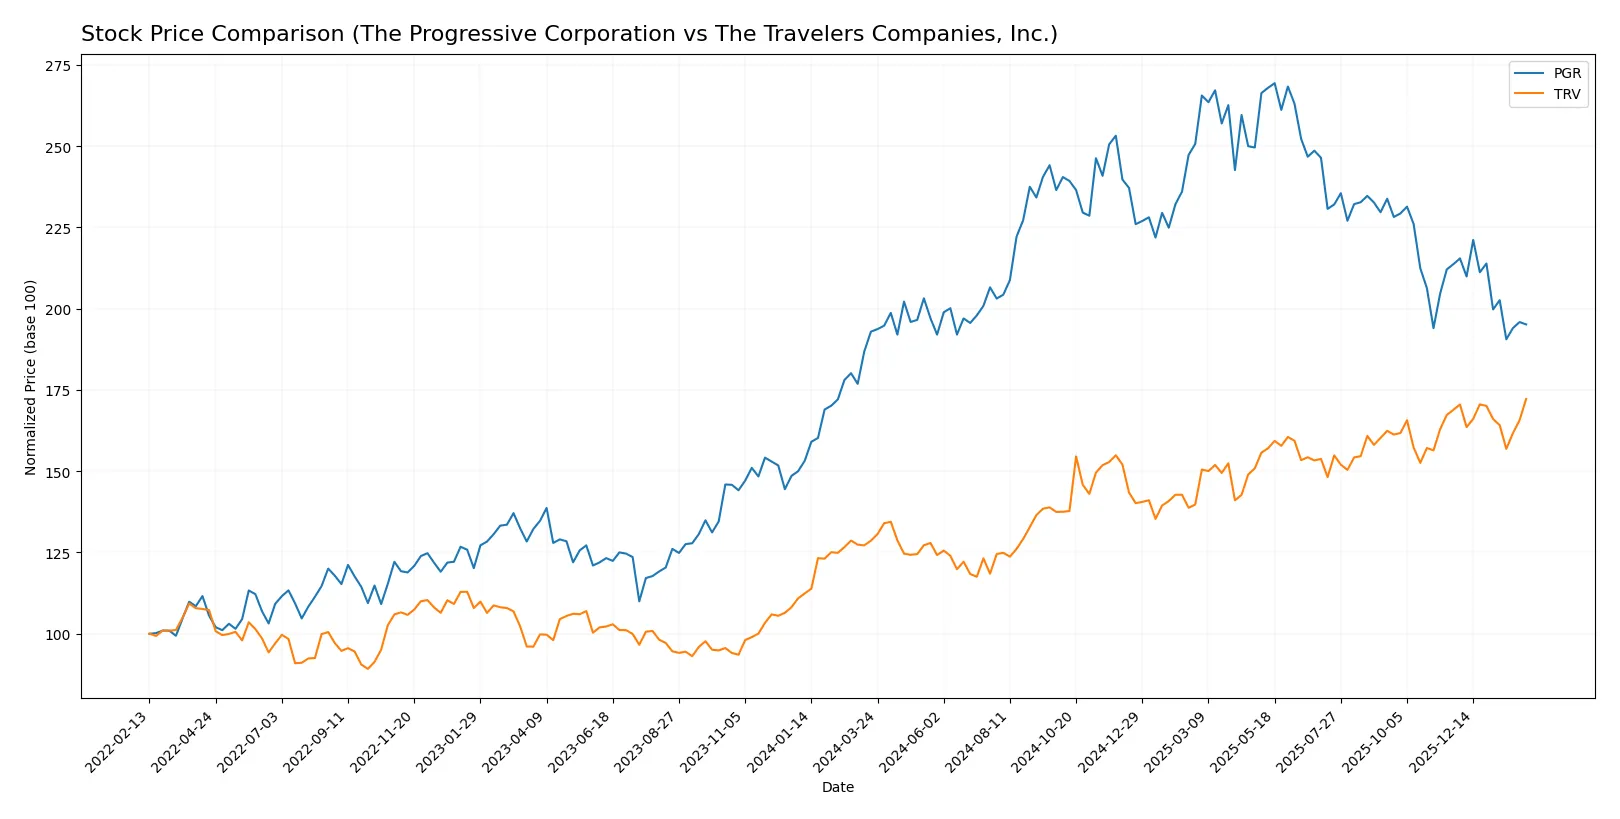
The past year shows contrasting price dynamics for The Progressive Corporation and The Travelers Companies, Inc., with notable gains and recent shifts in trading momentum.
Trend Comparison
The Progressive Corporation’s stock rose 1.15% over the past 12 months, indicating a bullish but decelerating trend with a high volatility of 24.31 and a recent decline of -8.67%.
The Travelers Companies, Inc. shares surged 33.89% in the same period, also with decelerating momentum and slightly higher volatility at 25.29; its recent trend remained nearly flat at +1.98%.
Travelers outperformed Progressive clearly, delivering a stronger overall market return despite both showing slower acceleration in their price trends.
Target Prices
Analysts show a bullish consensus for both The Progressive Corporation and The Travelers Companies, Inc.
| Company | Target Low | Target High | Consensus |
|---|---|---|---|
| The Progressive Corporation | 214 | 265 | 236.55 |
| The Travelers Companies, Inc. | 304 | 317 | 312.75 |
The Progressive Corporation’s consensus target sits about 14% above the current price, indicating solid upside potential. Travelers’ target consensus exceeds its current price by roughly 6%, reflecting moderate growth expectations.

Don’t Let Luck Decide Your Entry Point
Optimize your entry points with our advanced ProRealTime indicators. You’ll get efficient buy signals with precise price targets for maximum performance. Start outperforming now!
How do institutions grade them?
Below is a summary of the latest institutional grades for both companies:
The Progressive Corporation Grades
These are recent grades assigned by reputable financial institutions for The Progressive Corporation.
| Grading Company | Action | New Grade | Date |
|---|---|---|---|
| Keefe, Bruyette & Woods | Maintain | Market Perform | 2026-01-30 |
| Wells Fargo | Maintain | Equal Weight | 2026-01-29 |
| BMO Capital | Maintain | Market Perform | 2026-01-29 |
| Morgan Stanley | Maintain | Underweight | 2026-01-29 |
| BMO Capital | Maintain | Market Perform | 2026-01-15 |
| Wells Fargo | Maintain | Equal Weight | 2026-01-13 |
| Barclays | Upgrade | Overweight | 2026-01-08 |
| Evercore ISI Group | Maintain | In Line | 2026-01-07 |
| JP Morgan | Maintain | Overweight | 2026-01-07 |
| Keefe, Bruyette & Woods | Maintain | Market Perform | 2026-01-06 |
The Travelers Companies, Inc. Grades
Here are the latest institutional grades for The Travelers Companies, Inc.
| Grading Company | Action | New Grade | Date |
|---|---|---|---|
| Cantor Fitzgerald | Maintain | Overweight | 2026-02-02 |
| Citigroup | Maintain | Sell | 2026-01-27 |
| Keefe, Bruyette & Woods | Maintain | Outperform | 2026-01-23 |
| Roth Capital | Maintain | Buy | 2026-01-23 |
| Mizuho | Maintain | Neutral | 2026-01-22 |
| Wells Fargo | Maintain | Equal Weight | 2026-01-22 |
| Cantor Fitzgerald | Maintain | Overweight | 2026-01-14 |
| Wells Fargo | Maintain | Equal Weight | 2026-01-13 |
| Barclays | Maintain | Equal Weight | 2026-01-08 |
| Evercore ISI Group | Maintain | Outperform | 2026-01-07 |
Which company has the best grades?
The Travelers Companies, Inc. holds generally stronger grades, including Outperform and Buy ratings, compared to The Progressive Corporation’s Market Perform and Equal Weight consensus. This suggests higher analyst confidence in Travelers’ near-term prospects, potentially influencing investor sentiment positively.
Risks specific to each company
The following categories identify critical pressure points and systemic threats facing both firms in the 2026 market environment:
1. Market & Competition
The Progressive Corporation
- Strong market position with diversified personal and commercial lines but faces pricing pressures in personal auto insurance.
The Travelers Companies, Inc.
- Broad product mix including specialty lines, yet intense competition in commercial insurance markets challenges growth.
2. Capital Structure & Debt
The Progressive Corporation
- Nearly zero debt levels signal a strong balance sheet and low financial risk.
The Travelers Companies, Inc.
- Moderate debt-to-equity ratio of 0.28 indicates manageable leverage but higher risk than peers.
3. Stock Volatility
The Progressive Corporation
- Beta of 0.318 implies low volatility, offering defensive characteristics in turbulent markets.
The Travelers Companies, Inc.
- Beta of 0.517 shows higher volatility, reflecting sensitivity to market swings.
4. Regulatory & Legal
The Progressive Corporation
- Exposure to evolving auto insurance regulations could pressure underwriting margins.
The Travelers Companies, Inc.
- Regulatory complexity in specialty and bond insurance segments increases compliance costs.
5. Supply Chain & Operations
The Progressive Corporation
- Operational risks include claims processing efficiency critical to customer retention.
The Travelers Companies, Inc.
- Reliance on brokers and agents exposes it to distribution channel risks amid digital disruption.
6. ESG & Climate Transition
The Progressive Corporation
- Faces climate risk from property insurance due to increasing weather-related claims and catastrophes.
The Travelers Companies, Inc.
- Climate change impacts underwriting in energy and construction insurance lines, requiring adaptation.
7. Geopolitical Exposure
The Progressive Corporation
- Primarily US-focused, limiting geopolitical risks but also geographic diversification.
The Travelers Companies, Inc.
- US and international operations increase exposure to geopolitical uncertainties and exchange rate fluctuations.
Which company shows a better risk-adjusted profile?
The Progressive Corporation’s minimal debt and low stock volatility stand out. However, its weak liquidity ratios and high price-to-book ratio raise red flags. Conversely, The Travelers Companies balances moderate leverage with a stronger return on invested capital but faces distress signals from its Altman Z-score. Overall, Progressive shows a more stable risk-adjusted profile, supported by a safe-zone Altman Z-score of 3.62 versus Travelers’ distress-zone 0.82. Progressive’s defensive beta of 0.318 also reduces market risk exposure, while Travelers’ higher volatility and operational complexities pose greater challenges in 2026.
Final Verdict: Which stock to choose?
The Progressive Corporation (PGR) shines with its unmatched value creation and a very favorable moat, driven by a steadily growing ROIC well above its cost of capital. Its main point of vigilance lies in its weak liquidity ratios, which could pose short-term challenges. PGR suits an aggressive growth portfolio comfortable with cyclical volatility.
The Travelers Companies, Inc. (TRV) boasts a strategic moat rooted in efficient capital use and solid recurring profitability. Its financial stability surpasses PGR, reflected in a healthier balance between debt and assets and a more attractive valuation. TRV fits well within a GARP portfolio seeking steady growth with a reasonable margin of safety.
If you prioritize aggressive expansion and high-value creation, PGR is the compelling choice due to its superior ROIC trajectory and strong earnings growth. However, if you seek better stability and a balanced risk profile, TRV offers an attractive blend of durable competitive advantage and valuation discipline. Both companies demonstrate strengths, but your portfolio strategy should guide the final tilt.
Disclaimer: Investment carries a risk of loss of initial capital. The past performance is not a reliable indicator of future results. Be sure to understand risks before making an investment decision.
Go Further
I encourage you to read the complete analyses of The Progressive Corporation and The Travelers Companies, Inc. to enhance your investment decisions: