Home > Comparison > Consumer Defensive > PG vs UL
The rivalry between The Procter & Gamble Company and Unilever PLC shapes the global consumer defensive landscape. P&G dominates with a diversified portfolio spanning beauty, health care, and fabric care, emphasizing branded household products. Unilever blends consumer staples with a strong foothold in foods and refreshment, reflecting a broader fast-moving consumer goods model. This analysis will assess which strategy offers superior risk-adjusted returns for a diversified portfolio in this competitive sector.
Table of contents
Companies Overview
The Procter & Gamble Company and Unilever PLC stand as dominant forces in the global consumer products arena.
The Procter & Gamble Company: Global Consumer Goods Powerhouse
P&G dominates the household and personal products market with a diverse portfolio spanning beauty, grooming, health care, fabric, and family care. Its core revenue comes from branded consumer packaged goods sold through multiple retail channels worldwide. In 2026, P&G focuses strategically on innovation and premiumization to sustain its market leadership and consumer loyalty.
Unilever PLC: FMCG Giant with Diversified Consumer Portfolio
Unilever operates as a leading fast-moving consumer goods company with strong segments in beauty, foods, and home care. It generates revenue through a broad range of global brands, offering everything from personal care to refreshment products. In 2026, Unilever emphasizes sustainability and portfolio optimization to drive growth amid evolving consumer preferences.
Strategic Collision: Similarities & Divergences
Both companies rely on strong brand portfolios to capture global market share but diverge in focus; P&G centers on product innovation, while Unilever prioritizes sustainability. Their primary battleground is personal and home care products, where consumer loyalty drives pricing power. Investors face distinct profiles: P&G offers steady innovation-driven growth, whereas Unilever presents a sustainability-led transformation story.
Income Statement Comparison
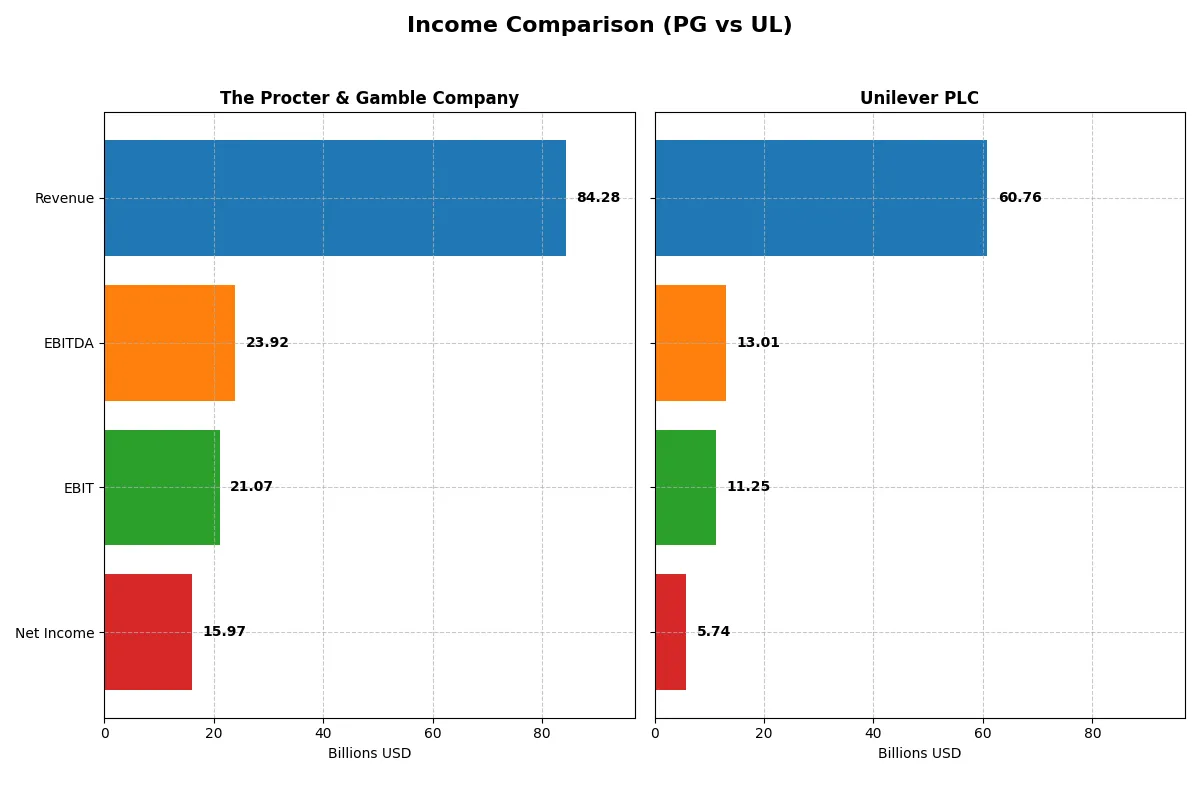
This data dissects the core profitability and scalability of both corporate engines to reveal who dominates the bottom line:
| Metric | The Procter & Gamble Company (PG) | Unilever PLC (UL) |
|---|---|---|
| Revenue | 84.3B USD | 60.8B EUR |
| Cost of Revenue | 41.2B USD | 0 EUR |
| Operating Expenses | 22.7B USD | 51.4B EUR |
| Gross Profit | 43.1B USD | 60.8B EUR |
| EBITDA | 23.9B USD | 13.0B EUR |
| EBIT | 21.1B USD | 11.3B EUR |
| Interest Expense | 907M USD | 1.12B EUR |
| Net Income | 16.0B USD | 5.74B EUR |
| EPS | 6.67 USD | 2.30 EUR |
| Fiscal Year | 2025 | 2024 |
Income Statement Analysis: The Bottom-Line Duel
The income statement comparison reveals which company converts top-line strength into bottom-line efficiency and sustainable profitability.
The Procter & Gamble Company Analysis
Procter & Gamble’s revenue grew steadily from $76B in 2021 to $84B in 2025, while net income rose from $14.3B to nearly $16B. The company maintains a robust gross margin above 51% and a net margin near 19%, signaling strong cost control. In 2025, P&G’s EBIT margin improved to 25%, reflecting enhanced operational efficiency and earnings momentum.
Unilever PLC Analysis
Unilever’s revenue expanded from €50.7B in 2020 to €60.8B in 2024, with net income increasing modestly from €5.6B to €5.7B. Despite an impressive gross margin reported at 100% (likely reflecting accounting nuances), its net margin remains below 10%, indicating thinner profitability. Unilever’s EBIT margin stands at 18.5% in 2024, showing solid but comparatively lower operational leverage than P&G.
Margin Dominance vs. Scale Resilience
Procter & Gamble outperforms with superior margins and consistent net income growth, underscoring operational prowess. Unilever shows stronger revenue growth but struggles to translate scale into higher profitability. For investors prioritizing margin strength and earnings quality, P&G’s profile offers clearer fundamental advantage.
Financial Ratios Comparison
These vital ratios act as a diagnostic tool to expose underlying fiscal health, valuation premiums, and capital efficiency for the companies compared below:
| Ratios | The Procter & Gamble Company (PG) | Unilever PLC (UL) |
|---|---|---|
| ROE | 30.7% | 28.7% |
| ROIC | 16.5% | 11.1% |
| P/E | 24.5 | 26.9 |
| P/B | 7.52 | 7.74 |
| Current Ratio | 0.70 | 0.76 |
| Quick Ratio | 0.49 | 0.56 |
| D/E (Debt-to-Equity) | 0.68 | 1.53 |
| Debt-to-Assets | 28.3% | 38.4% |
| Interest Coverage | 22.5 | 8.41 |
| Asset Turnover | 0.67 | 0.76 |
| Fixed Asset Turnover | 3.53 | 5.21 |
| Payout Ratio | 61.8% | 75.2% |
| Dividend Yield | 2.52% | 2.79% |
| Fiscal Year | 2025 | 2024 |
Efficiency & Valuation Duel: The Vital Signs
Financial ratios act as a company’s DNA, exposing hidden risks and operational strengths that shape investor decisions.
The Procter & Gamble Company
P&G delivers robust profitability with a 30.7% ROE and a strong 18.95% net margin, indicating operational excellence. Its P/E of 24.48 suggests a fairly valued stock, though a high PB of 7.52 raises caution. The 2.52% dividend yield rewards shareholders, reflecting disciplined capital allocation and steady cash flow generation.
Unilever PLC
Unilever posts a solid 28.7% ROE but a modest 9.45% net margin, signaling less efficiency compared to peers. Its P/E of 26.93 positions the stock as relatively expensive. A 2.79% dividend yield supports income investors, while a higher debt-to-equity ratio at 1.53 flags elevated leverage risk amid reinvestment for growth.
Premium Valuation vs. Operational Safety
P&G offers a better balance of operational efficiency and reasonable valuation, with stronger margins and lower leverage. Unilever’s profile suits investors favoring higher dividend yield and growth potential but with added financial risk. Choose based on your risk tolerance and income preference.
Which one offers the Superior Shareholder Reward?
I observe that Procter & Gamble (PG) offers a consistent dividend yield near 2.5% with a payout ratio around 62%, supported by robust free cash flow coverage of roughly 80%. PG complements dividends with significant buybacks, enhancing total returns. Unilever (UL) yields slightly higher dividends about 2.8–3.5% but carries a higher payout ratio near 75%, raising sustainability concerns given its lower net margin and weaker interest coverage. UL’s buyback activity appears less intense, limiting its total shareholder return. I conclude PG’s balanced payout and aggressive buybacks provide a more sustainable, superior reward profile for 2026 investors.
Comparative Score Analysis: The Strategic Profile
The radar chart reveals the fundamental DNA and trade-offs of both firms, highlighting their financial strengths and valuation nuances:
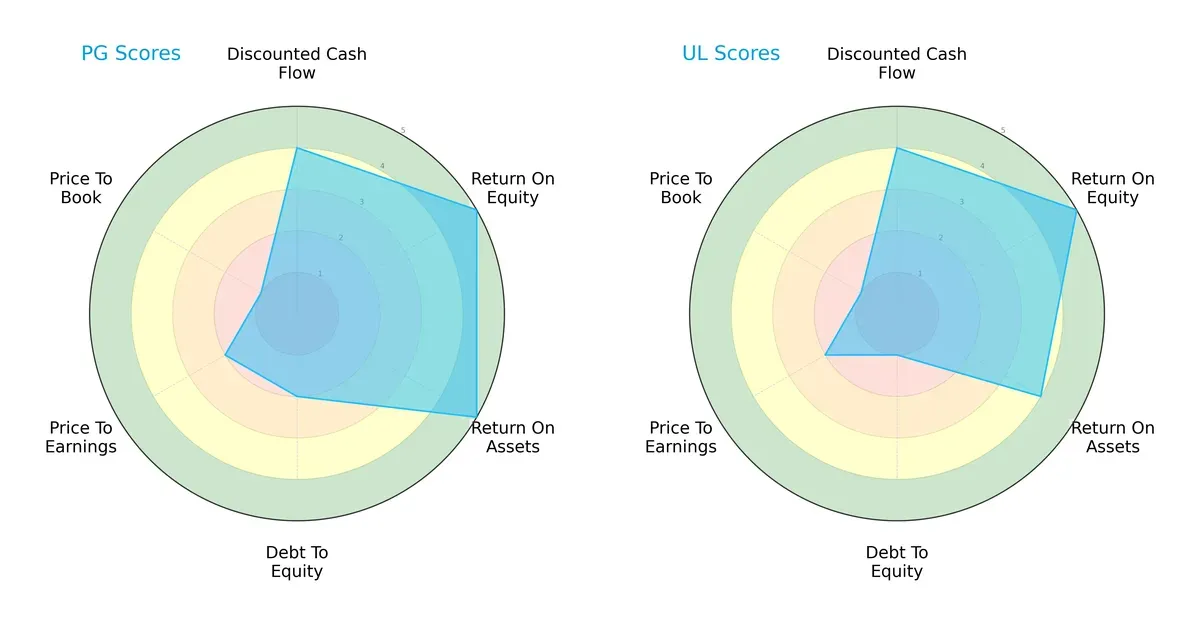
Procter & Gamble and Unilever share an overall moderate score with similarly strong DCF and ROE profiles. P&G edges out with a slightly better ROA score (5 vs. 4), indicating more efficient asset use. However, Unilever boasts a healthier debt-to-equity score (1 vs. 2), signaling a stronger balance sheet. Both firms suffer from weak price-to-book scores, reflecting challenging valuation metrics. P&G’s profile is more balanced, while Unilever leans on its low leverage as a competitive edge.
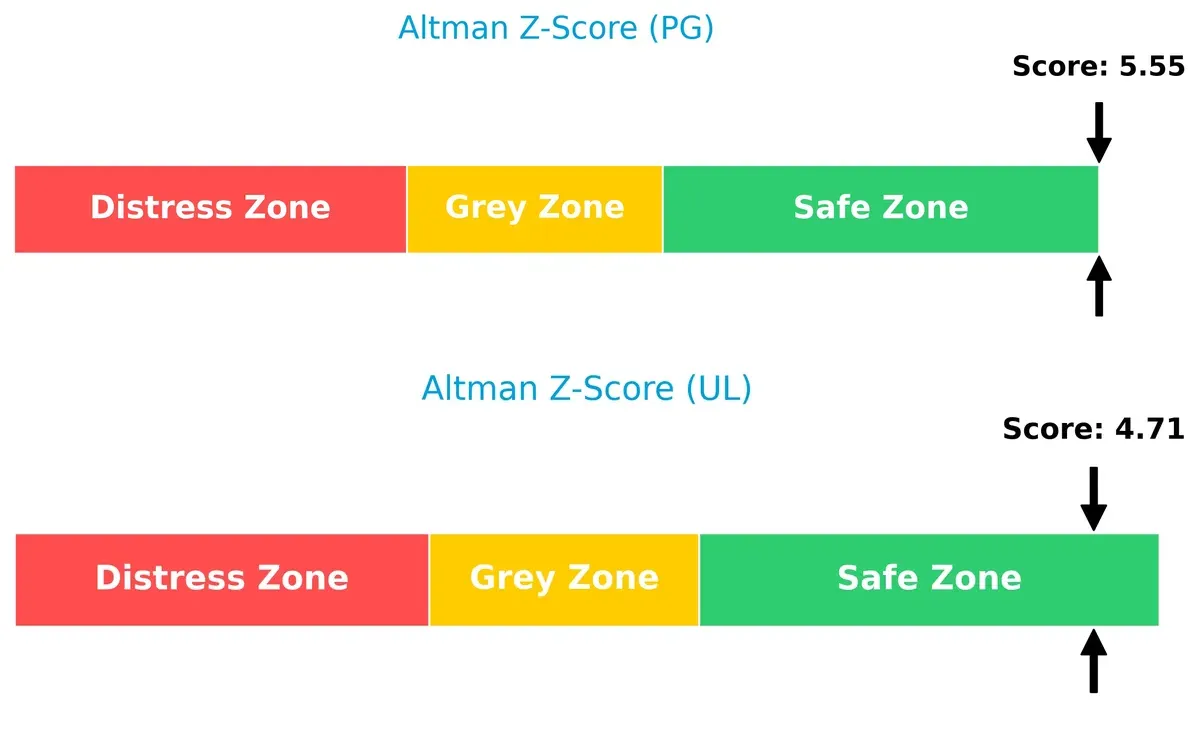
Bankruptcy Risk: Solvency Showdown
The Altman Z-Scores place both companies comfortably in the safe zone, but P&G’s 5.55 surpasses Unilever’s 4.71, implying a marginally stronger long-term solvency buffer:
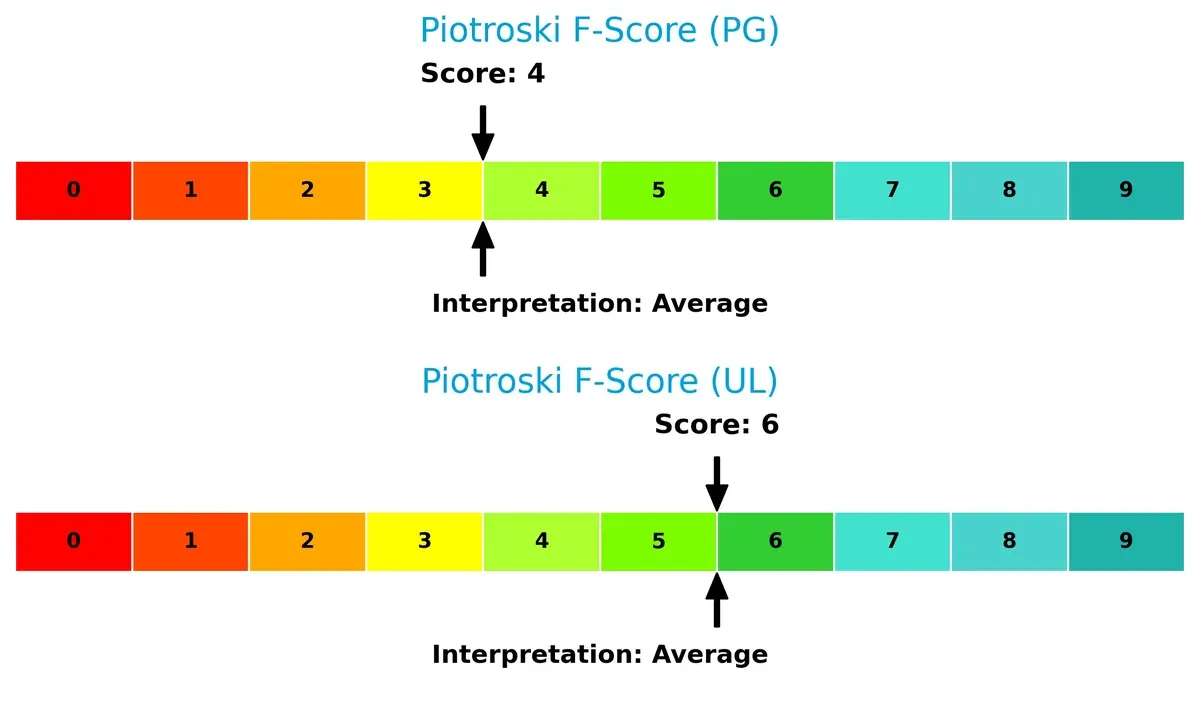
Financial Health: Quality of Operations
Unilever’s Piotroski F-Score of 6 outperforms P&G’s 4, suggesting healthier internal financial metrics and operational quality. P&G’s lower score flags potential red flags in profitability, liquidity, or efficiency compared to Unilever:
How are the two companies positioned?
This section dissects the operational DNA of PG and UL by analyzing their revenue distribution and internal strengths and weaknesses. The goal is to confront their economic moats to reveal which business model offers the most resilient and sustainable competitive advantage today.
Revenue Segmentation: The Strategic Mix
This visual comparison dissects how The Procter & Gamble Company and Unilever PLC diversify their income streams and where their primary sector bets lie:
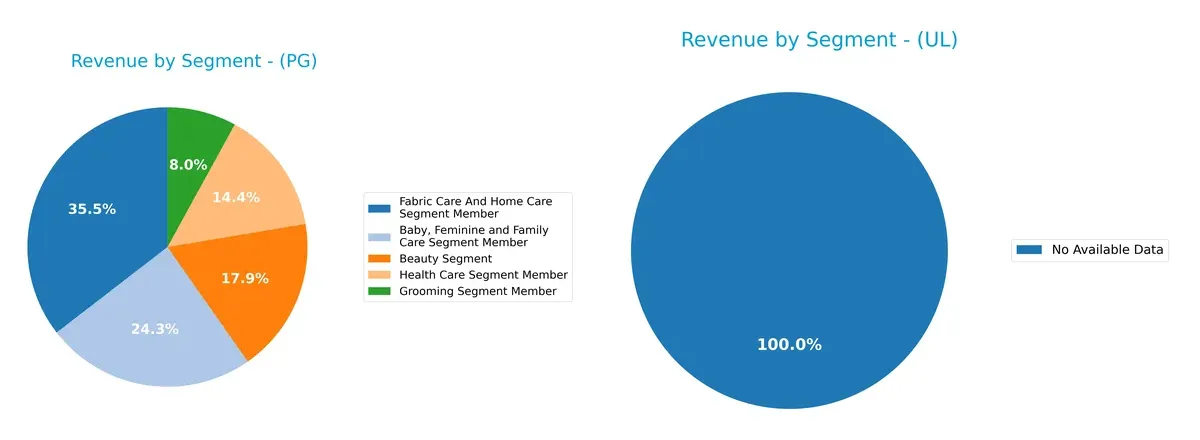
The Procter & Gamble Company anchors revenue in Fabric Care and Home Care with $29.6B, followed by Baby, Feminine and Family Care at $20.2B. Beauty ($14.9B), Health Care ($12B), and Grooming ($6.7B) diversify its mix. Unilever PLC lacks available segment data here, preventing direct comparison. P&G’s portfolio balances scale and diversification, reducing concentration risk while leveraging ecosystem lock-in in household essentials.
Strengths and Weaknesses Comparison
This table compares the Strengths and Weaknesses of The Procter & Gamble Company (PG) and Unilever PLC (UL):
PG Strengths
- Diverse product segments across Baby Care, Beauty, Fabric Care, Grooming, and Health Care
- Balanced revenue split between US (41.6B) and Non-US (42.7B) markets
- High profitability with net margin at 18.95% and ROE at 30.71%
- Strong capital efficiency shown by ROIC (16.47%) well above WACC (5.41%)
- Favorable interest coverage (23.23) supports financial stability
- Consistent dividend yield of 2.52%
UL Strengths
- Broad geographic diversification across Americas, Asia Pacific, Europe, Latin America, and North America
- Favorable ROE (28.73%) and ROIC (11.12%) indicate effective capital use
- WACC is low at 4.56%, supporting growth investments
- Solid fixed asset turnover (5.21) signals operational efficiency
- Dividend yield slightly higher at 2.79%
- Global footprint spanning multiple continents
PG Weaknesses
- Current ratio (0.7) and quick ratio (0.49) below 1 signal potential liquidity constraints
- Price-to-book ratio (7.52) is unfavorable, suggesting possible overvaluation
- Moderate asset turnover (0.67) limits revenue relative to asset base
- Neutral debt-to-equity ratio (0.68) indicates balanced leverage but room for improvement
- Neutral price-to-earnings (24.48) offers less margin for valuation upside
UL Weaknesses
- Elevated debt-to-equity ratio (1.53) increases financial risk
- Current ratio (0.76) and quick ratio (0.56) also below 1, indicating liquidity pressure
- Unfavorable P/E (26.93) and P/B (7.74) ratios may reflect valuation concerns
- Debt-to-assets ratio (38.44%) is neutral but higher than PG
- Interest coverage (10.06) lower than PG, potentially more sensitive to interest costs
Overall, PG demonstrates stronger profitability and liquidity metrics, benefiting from a well-diversified product base and balanced geographic exposure. UL excels in global diversification but faces higher leverage and liquidity risks. These contrasts suggest differing strategic priorities in capital structure and market focus.
The Moat Duel: Analyzing Competitive Defensibility
A structural moat alone shields long-term profits from relentless competitive erosion. Let’s dissect how these two giants defend their turf:
The Procter & Gamble Company: Brand Power & Operational Excellence
P&G’s moat stems from strong intangible assets and brand loyalty driving stable margins and a 25% EBIT margin. Its ROIC exceeds WACC by 11%, showing efficient capital use. New product innovation and global expansion in 2026 could further deepen this moat.
Unilever PLC: Diversified Portfolio with Geographic Reach
Unilever relies on a broad product mix and geographic diversification, unlike P&G’s brand-centric edge. It generates value with a 6.6% ROIC premium over WACC but faces a declining ROIC trend. Expansion in emerging markets may offset profitability pressures in 2026.
Wide Moat Brand Equity vs. Diversified Market Penetration
P&G’s wider and growing moat outmatches Unilever’s slight competitive edge and shrinking returns. P&G is better positioned to defend market share amid intensifying competition and economic cycles.
Which stock offers better returns?
Both The Procter & Gamble Company and Unilever PLC show distinct price movements over the past 12 months, reflecting contrasting market dynamics and investor sentiment.
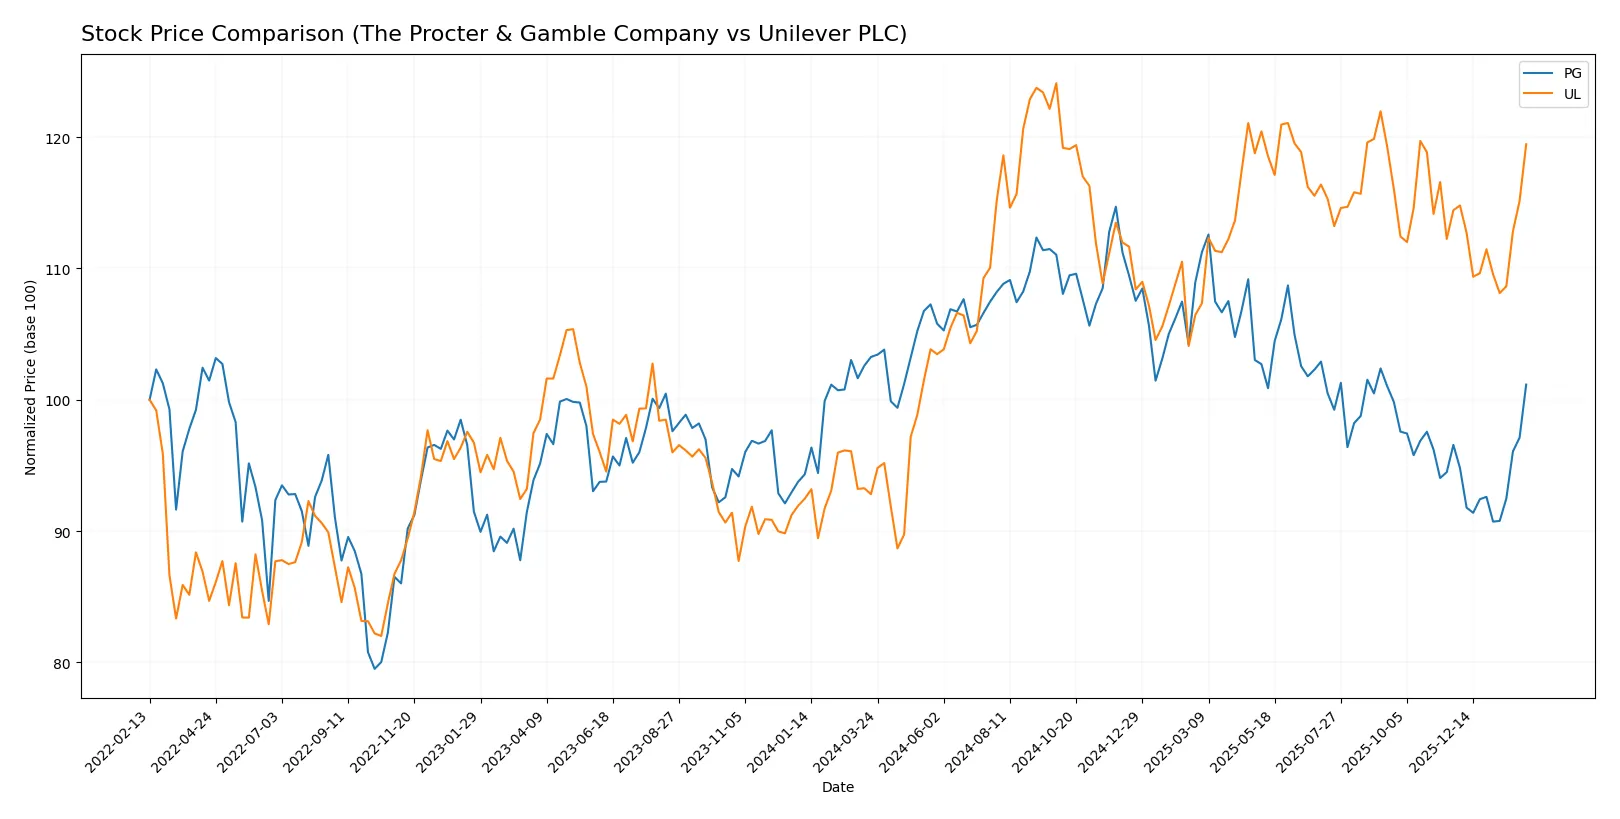
Trend Comparison
The Procter & Gamble Company’s stock declined 2.03% over the past year, indicating a bearish trend with accelerating price movement and notable volatility (8.85 std deviation). It peaked at 179.26 and troughed at 141.79.
Unilever PLC’s stock rose sharply by 28.71% over the same period, reflecting a strong bullish trend with acceleration. It showed lower volatility (4.53 std deviation), hitting a high of 73.69 and a low of 52.66.
Comparing the two, Unilever PLC delivered significantly higher market performance and a sustained upward trajectory versus Procter & Gamble’s marginal decline and higher volatility.
Target Prices
Analysts present a robust target consensus for Procter & Gamble and Unilever, reflecting steady confidence in their growth prospects.
| Company | Target Low | Target High | Consensus |
|---|---|---|---|
| The Procter & Gamble Company | 150 | 179 | 165.67 |
| Unilever PLC | 60.1 | 71 | 65.55 |
The Procter & Gamble consensus target at 165.67 exceeds the current price of 158.13, implying moderate upside. Unilever’s consensus target of 65.55 slightly trails its present price of 70.93, indicating a cautious outlook.

Don’t Let Luck Decide Your Entry Point
Optimize your entry points with our advanced ProRealTime indicators. You’ll get efficient buy signals with precise price targets for maximum performance. Start outperforming now!
How do institutions grade them?
The Procter & Gamble Company Grades
The following table summarizes recent institutional grades for The Procter & Gamble Company:
| Grading Company | Action | New Grade | Date |
|---|---|---|---|
| TD Cowen | Downgrade | Hold | 2026-01-27 |
| Wells Fargo | Maintain | Overweight | 2026-01-23 |
| UBS | Maintain | Buy | 2026-01-23 |
| JP Morgan | Upgrade | Overweight | 2026-01-23 |
| UBS | Maintain | Buy | 2026-01-14 |
| TD Cowen | Maintain | Buy | 2026-01-08 |
| Wells Fargo | Maintain | Overweight | 2026-01-05 |
| JP Morgan | Maintain | Neutral | 2025-12-18 |
| Jefferies | Upgrade | Buy | 2025-12-17 |
| JP Morgan | Maintain | Neutral | 2025-10-27 |
Unilever PLC Grades
The following table summarizes recent institutional grades for Unilever PLC:
| Grading Company | Action | New Grade | Date |
|---|---|---|---|
| Erste Group | Downgrade | Hold | 2024-11-19 |
| B of A Securities | Upgrade | Buy | 2024-08-22 |
| JP Morgan | Upgrade | Overweight | 2024-05-23 |
| Argus Research | Maintain | Buy | 2024-05-08 |
| Morgan Stanley | Downgrade | Underweight | 2024-02-27 |
| Bernstein | Upgrade | Market Perform | 2022-03-14 |
| Bernstein | Upgrade | Market Perform | 2022-03-13 |
| Bernstein | Upgrade | Market Perform | 2021-11-01 |
| Bernstein | Upgrade | Market Perform | 2021-10-31 |
| Deutsche Bank | Downgrade | Hold | 2021-09-16 |
Which company has the best grades?
The Procter & Gamble Company consistently receives Buy and Overweight ratings from top firms, indicating stronger institutional confidence. Unilever’s grades are more mixed, including underweight and hold ratings, suggesting higher uncertainty. Investors may perceive Procter & Gamble as the more favored stock by analysts.
Risks specific to each company
The following categories identify critical pressure points and systemic threats facing both firms in the 2026 market environment:
1. Market & Competition
The Procter & Gamble Company
- Strong brand portfolio with diversified segments, but faces intense competition in mature markets.
Unilever PLC
- Broad product range including food; faces fierce competition and margin pressure in emerging markets.
2. Capital Structure & Debt
The Procter & Gamble Company
- Moderate debt-to-equity (0.68), favorable interest coverage (23.23), indicating sound balance sheet.
Unilever PLC
- Higher leverage (debt-to-equity 1.53) and lower interest coverage (10.06) increase financial risk.
3. Stock Volatility
The Procter & Gamble Company
- Beta of 0.38 signals low stock volatility, appealing for defensive investors.
Unilever PLC
- Even lower beta of 0.237 suggests very stable stock but possibly limited upside.
4. Regulatory & Legal
The Procter & Gamble Company
- Operates in highly regulated markets; exposure to product safety and advertising laws.
Unilever PLC
- Exposure to EU regulatory frameworks and Brexit-related complexities add compliance costs.
5. Supply Chain & Operations
The Procter & Gamble Company
- Global supply chain benefits from scale but vulnerable to raw material price swings.
Unilever PLC
- Complex supply chain with food segment adds volatility; dependent on commodity markets.
6. ESG & Climate Transition
The Procter & Gamble Company
- Increasing ESG initiatives; pressure to reduce plastic use and carbon footprint.
Unilever PLC
- Strong ESG focus with sustainability embedded, but faces challenges in food segment emissions.
7. Geopolitical Exposure
The Procter & Gamble Company
- US-based with global sales; geopolitical tensions may disrupt international growth.
Unilever PLC
- UK-based with significant emerging market exposure; currency and political risks elevated.
Which company shows a better risk-adjusted profile?
The Procter & Gamble Company’s moderate leverage and strong interest coverage mitigate financial risk better than Unilever’s higher debt load. P&G’s stable market position and lower stock volatility reinforce its defensive stance. Unilever’s broader geographic and segment exposure adds complexity and risk. P&G’s Altman Z-score (5.55) confirms superior financial safety compared to Unilever’s 4.71. These factors collectively position P&G with a clearer risk-adjusted advantage in 2026.
Final Verdict: Which stock to choose?
The Procter & Gamble Company stands out for its unmatched ability to generate strong returns on invested capital well above its cost of capital. This cash machine delivers consistent profitability and steadily growing ROIC, signaling a durable competitive advantage. However, its low liquidity ratios warrant vigilance. It suits portfolios aiming for steady, long-term growth with an income focus.
Unilever PLC boasts a strategic moat rooted in solid recurring revenue streams and operational efficiency across diverse markets. While its profitability trend shows some decline, it offers a slightly safer profile in terms of free cash flow yield and dividend yield. This makes it attractive for investors seeking growth at a reasonable price with moderate risk tolerance.
If you prioritize a resilient cash generator with a strong economic moat and consistent profitability, Procter & Gamble outshines due to its sustained value creation and favorable income growth. However, if you seek exposure to a globally diversified, steady-growth company offering better free cash flow yield and moderate risk, Unilever presents a compelling alternative. Both fit distinct investor profiles but demand careful risk monitoring.
Disclaimer: Investment carries a risk of loss of initial capital. The past performance is not a reliable indicator of future results. Be sure to understand risks before making an investment decision.
Go Further
I encourage you to read the complete analyses of The Procter & Gamble Company and Unilever PLC to enhance your investment decisions: