Home > Comparison > Consumer Defensive > PG vs ELF
The strategic rivalry between The Procter & Gamble Company and e.l.f. Beauty, Inc. shapes the competitive landscape of the household and personal products sector. Procter & Gamble operates as a diversified consumer defensive giant with a broad portfolio and global reach. In contrast, e.l.f. Beauty focuses on niche, digitally savvy cosmetic offerings with a leaner operational model. This analysis will evaluate which corporate trajectory presents superior risk-adjusted potential for a diversified portfolio.
Table of contents
Companies Overview
The Procter & Gamble Company and e.l.f. Beauty, Inc. stand as influential players in the consumer personal care market.
The Procter & Gamble Company: Global Consumer Staples Powerhouse
P&G dominates the household and personal products sector with a diversified portfolio across beauty, grooming, health care, fabric care, and family care. Its core revenue stems from branded packaged goods sold worldwide through multiple retail channels. In 2026, P&G’s strategic focus remains on innovation and expanding its premium brands to sustain its market leadership.
e.l.f. Beauty, Inc.: Digital-First Cosmetics Innovator
e.l.f. Beauty operates primarily in cosmetic and skincare products, leveraging direct-to-consumer e-commerce and international retail partnerships. Its revenue engine centers on accessible, trend-driven beauty brands targeting younger demographics. The company’s 2026 strategy emphasizes expanding online sales and broadening its product range to capture evolving consumer preferences.
Strategic Collision: Similarities & Divergences
Both companies compete in personal care but adopt different approaches: P&G relies on a broad, multi-channel distribution and brand depth, while e.l.f. prioritizes agility and a digital-first presence. Their battleground lies in capturing consumer loyalty in the evolving beauty and personal care market. Investors face contrasting profiles: P&G offers stability and scale; e.l.f. presents growth potential with higher volatility.
Income Statement Comparison
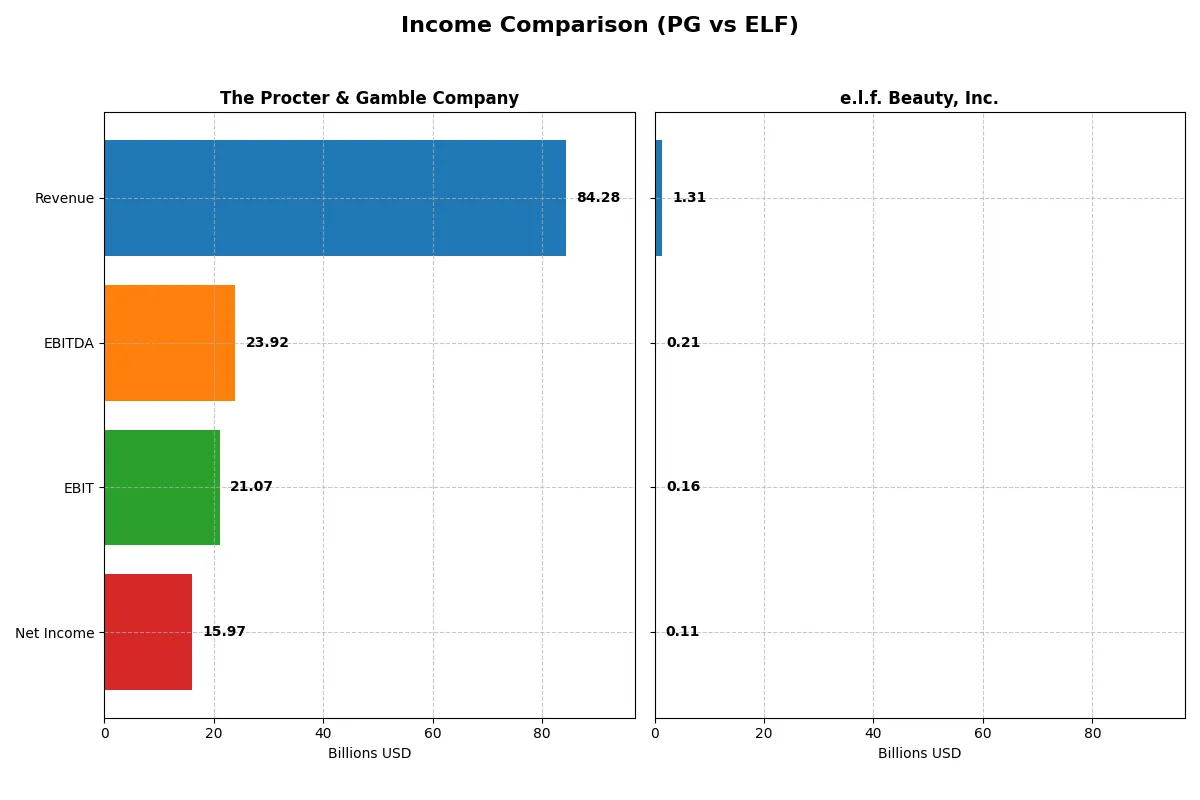
This data dissects the core profitability and scalability of both corporate engines to reveal who dominates the bottom line:
| Metric | The Procter & Gamble Company (PG) | e.l.f. Beauty, Inc. (ELF) |
|---|---|---|
| Revenue | 84.3B | 1.31B |
| Cost of Revenue | 41.2B | 378M |
| Operating Expenses | 22.7B | 778M |
| Gross Profit | 43.1B | 936M |
| EBITDA | 23.9B | 206M |
| EBIT | 21.1B | 162M |
| Interest Expense | 907M | 17.2M |
| Net Income | 15.97B | 112M |
| EPS | 6.67 | 1.99 |
| Fiscal Year | 2025 | 2025 |
Income Statement Analysis: The Bottom-Line Duel
This income statement comparison reveals which company channels revenue into profits most efficiently, exposing the strength of each corporate engine.
The Procter & Gamble Company Analysis
P&G’s revenue grew modestly to 84.3B in 2025, with net income rising to 15.97B. Its gross margin remains strong at 51.16%, showing consistent cost control. The net margin of 18.95% highlights efficient operations. P&G’s EBIT rose 7% year-over-year, signaling solid momentum in profitability despite flat revenue growth.
e.l.f. Beauty, Inc. Analysis
e.l.f. Beauty’s revenue surged 28% to 1.31B in 2025 with net income of 112M, reflecting rapid expansion. Gross margin at 71.24% dominates, but net margin lags at 8.53%. Operating expenses grew sharply, constraining net margin growth, which declined 31.5%. Growth momentum is evident, but profitability efficiency faces pressure.
Margin Power vs. Revenue Scale
P&G delivers superior margin stability and higher absolute profits, winning on efficiency and scale with near 16B net income. e.l.f. shows impressive revenue growth but struggles with margin compression, yielding far smaller net income. For investors valuing steady profits and operational discipline, P&G’s profile is more attractive and resilient.
Financial Ratios Comparison
These vital ratios act as a diagnostic tool to expose the underlying fiscal health, valuation premiums, and capital efficiency of the companies analyzed:
| Ratios | The Procter & Gamble Company (PG) | e.l.f. Beauty, Inc. (ELF) |
|---|---|---|
| ROE | 30.7% | 14.7% |
| ROIC | 16.5% | 11.2% |
| P/E | 24.5x | 31.5x |
| P/B | 7.52x | 4.64x |
| Current Ratio | 0.70 | 3.05 |
| Quick Ratio | 0.49 | 2.00 |
| D/E (Debt-to-Equity) | 0.68 | 0.41 |
| Debt-to-Assets | 28.3% | 25.1% |
| Interest Coverage | 22.5x | 9.2x |
| Asset Turnover | 0.67 | 1.05 |
| Fixed Asset Turnover | 3.53 | 45.6 |
| Payout Ratio | 61.8% | 0% |
| Dividend Yield | 2.52% | 0% |
| Fiscal Year | 2025 | 2025 |
Efficiency & Valuation Duel: The Vital Signs
Ratios act as the company’s DNA, revealing hidden risks and operational excellence that shape investor confidence and valuation fairness.
The Procter & Gamble Company
P&G delivers strong profitability with a 30.7% ROE and nearly 19% net margin, signaling efficient capital use. Its P/E of 24.5 is fairly valued, though a 7.5 PB ratio appears stretched. The firm supports shareholders with a 2.5% dividend yield, reflecting stable cash flow and prudent capital allocation.
e.l.f. Beauty, Inc.
e.l.f. posts moderate profitability, with a 14.7% ROE and 8.5% net margin, showing growth-stage efficiency but weaker returns. The P/E of 31.5 flags an expensive valuation, compounded by no dividend payout. Reinvestment focuses on growth and innovation, aligning with its expansion and higher WACC risk profile.
Premium Valuation vs. Operational Safety
P&G offers a superior balance of robust returns and reasonable valuation, backed by consistent dividends. e.l.f. remains more speculative with higher valuation and reinvestment risks. Investors seeking stability may prefer P&G, while growth-oriented profiles might tolerate e.l.f.’s stretched multiples.
Which one offers the Superior Shareholder Reward?
I see Procter & Gamble (PG) delivers a 2.5% dividend yield with a 62% payout ratio, supported by strong free cash flow coverage at 79%. PG also executes consistent buybacks, enhancing total returns. In contrast, e.l.f. Beauty (ELF) pays no dividends but reinvests heavily in growth, with no buybacks yet. PG’s distribution model is more sustainable for income-focused investors, while ELF targets capital appreciation through reinvestment. Given 2026’s environment, I favor PG for a superior total return, blending reliable dividends and buybacks with solid cash flow.
Comparative Score Analysis: The Strategic Profile
The radar chart reveals the fundamental DNA and trade-offs of The Procter & Gamble Company and e.l.f. Beauty, Inc.:
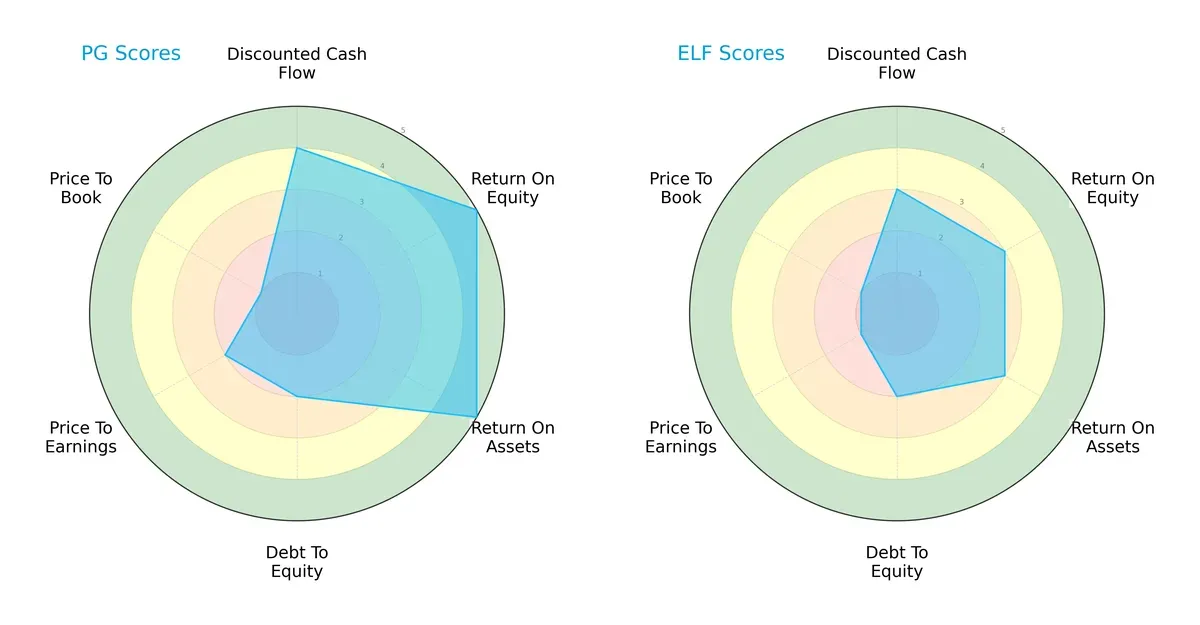
Procter & Gamble displays a more balanced profile with strong ROE (5) and ROA (5) scores, signaling efficient profitability and asset use. e.l.f. Beauty has moderate returns (ROE 3, ROA 3) and matches P&G’s moderate debt-to-equity score (2). P&G’s discounted cash flow score (4) exceeds e.l.f.’s (3), while both firms show weak valuation metrics, with e.l.f. lagging further on P/E (1 vs. 2) and P/B (1 vs. 1). P&G clearly leverages operational efficiency; e.l.f. relies on niche positioning but faces valuation headwinds.
Bankruptcy Risk: Solvency Showdown
The Altman Z-Scores position both firms safely above distress thresholds, with P&G’s 5.42 notably stronger than e.l.f.’s 3.63:
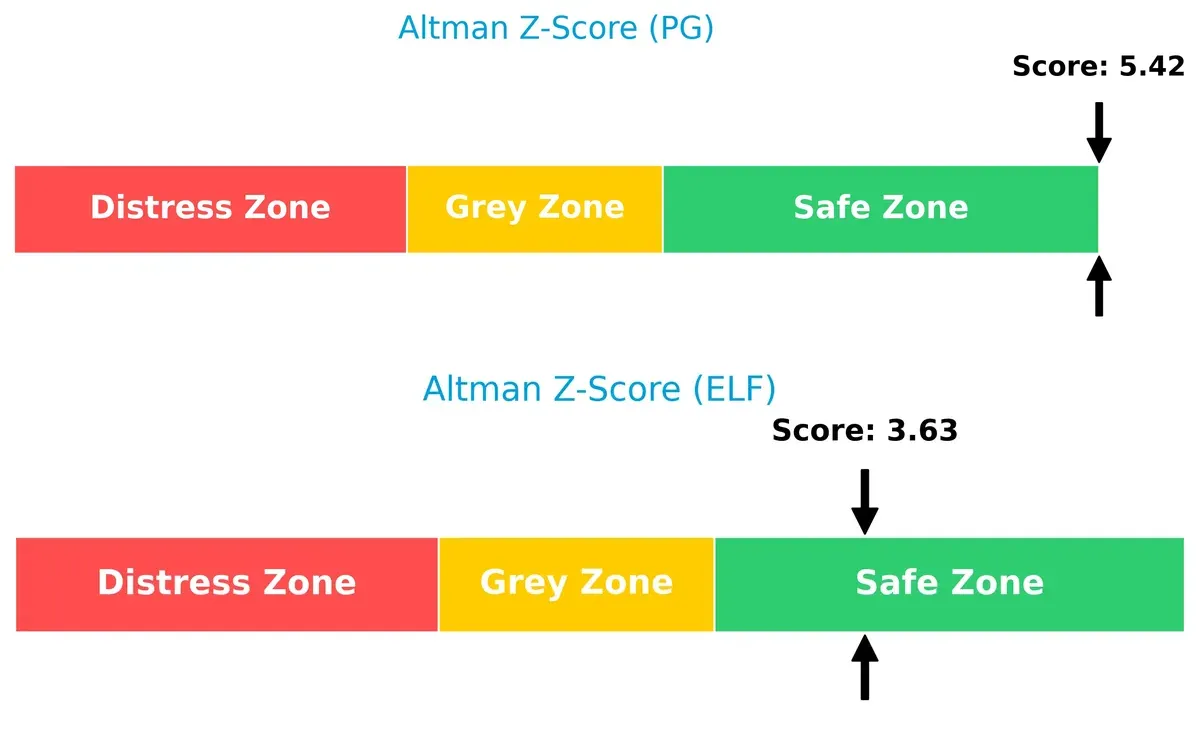
P&G’s superior score suggests a more robust buffer against economic cycles and financial shocks, reinforcing its resilience. e.l.f., while safe, operates closer to the margin, indicating higher vulnerability during downturns.
Financial Health: Quality of Operations
Piotroski F-Scores highlight e.l.f.’s slightly better internal financial health at 5 versus P&G’s 4, both in the average range:
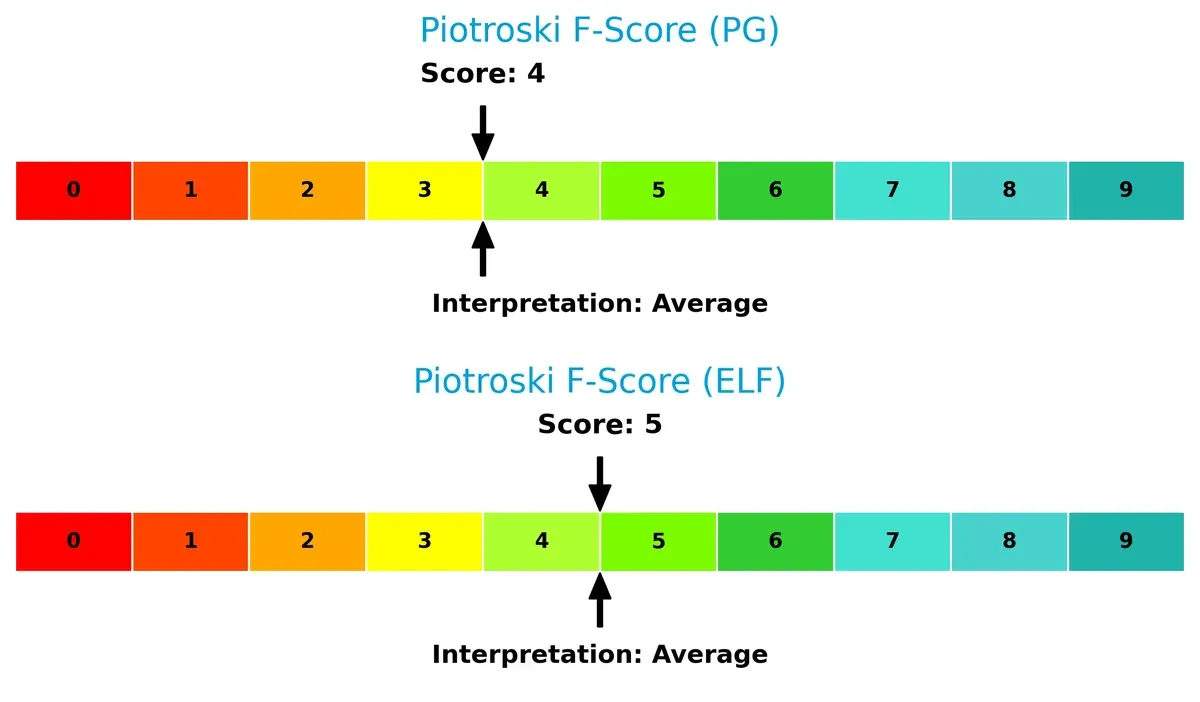
This suggests e.l.f. maintains slightly stronger recent profitability and efficiency signals. However, neither company scores in the high range, signaling room for operational improvements and caution regarding potential internal weaknesses.
How are the two companies positioned?
This section dissects the operational DNA of PG and ELF by comparing their revenue distribution and internal dynamics. The goal is to confront their economic moats and identify which model offers the most resilient competitive advantage today.
Revenue Segmentation: The Strategic Mix
This visual comparison dissects how The Procter & Gamble Company and e.l.f. Beauty, Inc. diversify their income streams and where their primary sector bets lie:
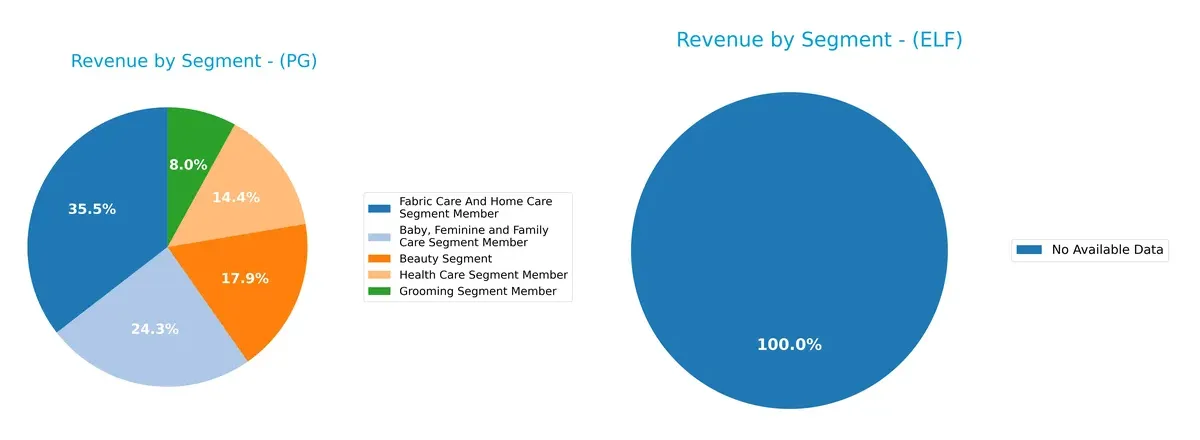
The Procter & Gamble Company anchors its revenue in Fabric Care & Home Care with $29.6B, followed by Baby, Feminine & Family Care at $20.2B. Its mix spans Beauty ($14.9B), Health Care ($12B), and Grooming ($6.7B), showcasing true diversification. e.l.f. Beauty, Inc. offers no data, so its segmentation cannot be evaluated. P&G’s broad portfolio reduces concentration risk and leverages ecosystem lock-in across consumer staples.
Strengths and Weaknesses Comparison
This table compares the Strengths and Weaknesses of The Procter & Gamble Company (PG) and e.l.f. Beauty, Inc. (ELF):
PG Strengths
- Diversified revenue across six major product segments
- Strong profitability with 18.95% net margin and 30.71% ROE
- Favorable capital efficiency with 16.47% ROIC vs 5.4% WACC
- Balanced global presence with nearly equal US and Non-US sales
- High interest coverage ratio at 23.23 supports financial stability
ELF Strengths
- Favorable asset turnover at 1.05 and extremely high fixed asset turnover at 45.63
- Positive quick ratio of 2.0 indicating liquidity strength
- Low debt-to-equity ratio at 0.41 indicating conservative leverage
- Solid interest coverage ratio at 9.44 ensures debt servicing ability
PG Weaknesses
- Low current (0.7) and quick ratios (0.49) raise liquidity concerns
- High price-to-book ratio at 7.52 suggests overvaluation risk
- Moderate debt-to-equity ratio at 0.68 limits financial flexibility
- Neutral asset turnover at 0.67 may indicate asset utilization inefficiency
ELF Weaknesses
- Unfavorable ROIC at 11.21% below WACC of 11.5% signals value destruction
- High price-to-earnings ratio at 31.49 reflects expensive valuation
- High current ratio at 3.05 may indicate inefficient working capital use
- Zero dividend yield limits income appeal to shareholders
PG shows a broad product and geographic diversification with strong profitability and capital returns, offset by liquidity and valuation concerns. ELF demonstrates operational efficiency and conservative leverage but faces challenges in capital returns, valuation, and dividend policy. Both companies display distinct profiles that influence their strategic options.
The Moat Duel: Analyzing Competitive Defensibility
A structural moat is the only shield protecting long-term profits from relentless competition and market disruption. Let’s dissect the moats of two industry players:
The Procter & Gamble Company: Brand Power and Scale Economies
P&G’s moat hinges on its iconic brands and massive scale, delivering stable 25% EBIT margins and 11% ROIC above WACC. Its global reach and diversified portfolio deepen this moat in 2026 amid premium product launches.
e.l.f. Beauty, Inc.: Growth-Driven Innovation
e.l.f. relies on rapid innovation and strong direct-to-consumer channels, contrasting with P&G’s legacy scale. Despite a slight value erosion (ROIC below WACC), its 418% ROIC growth signals rising competitive strength and expanding market presence.
Legacy Brand Dominance vs. Agile Growth Innovation
P&G holds a wider, more durable moat with proven value creation and margin stability. e.l.f. shows promise in growth but lacks P&G’s entrenched competitive fortress. P&G is better positioned to defend market share long term.
Which stock offers better returns?
Over the past year, both stocks show bearish trends but with differing degrees of decline and recent recovery phases impacting trading dynamics.
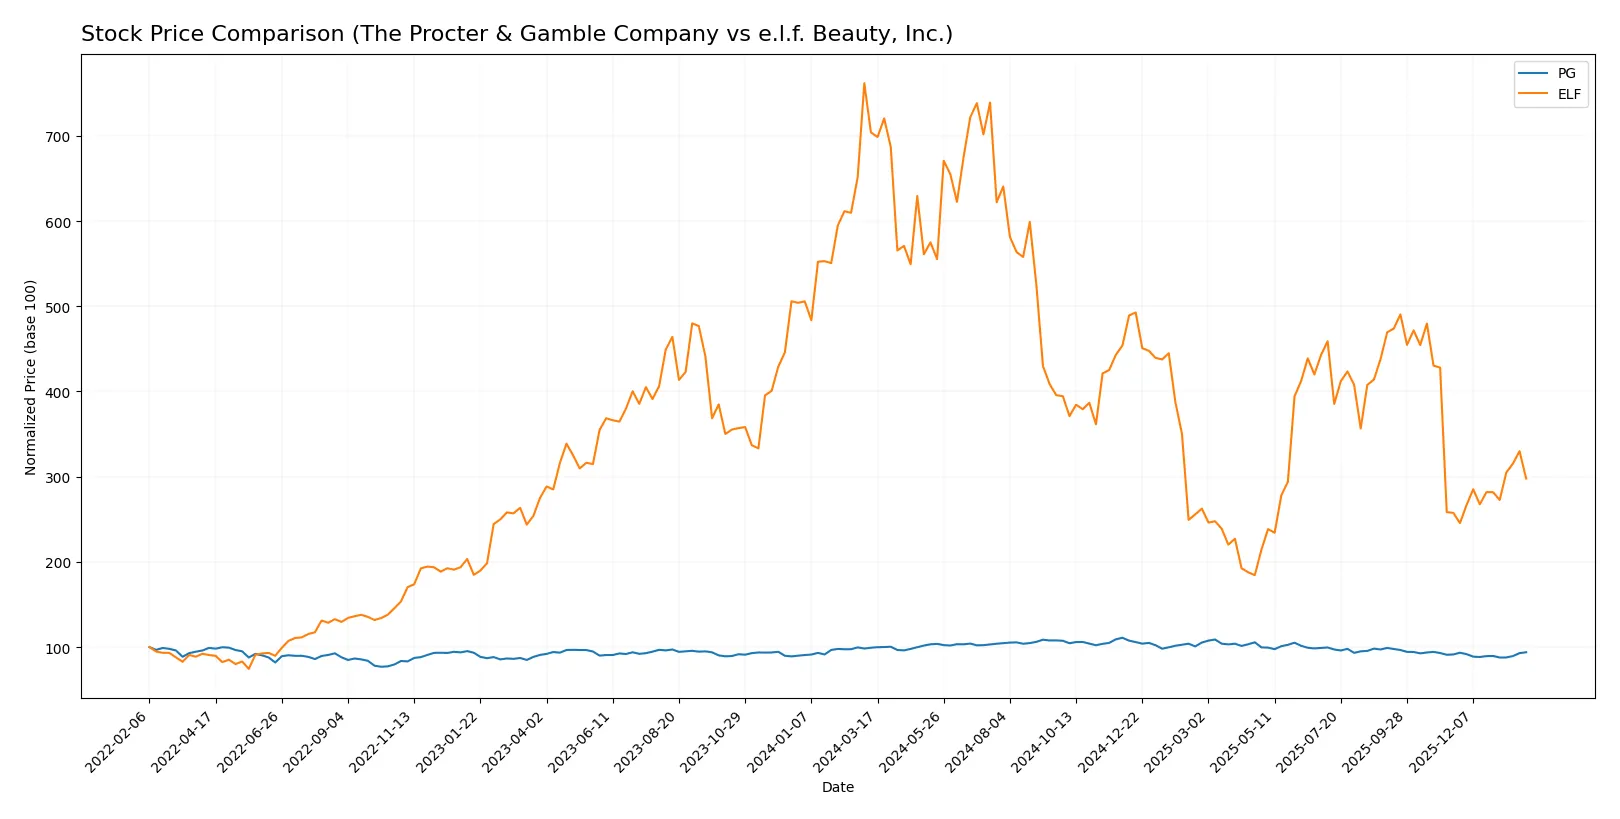
Trend Comparison
The Procter & Gamble Company’s stock declined 5.35% over 12 months, showing an accelerating bearish trend with a high volatility of 8.85%. Recent price movement turned slightly bullish, gaining 2.78% since November 2025.
e.l.f. Beauty, Inc. suffered a steep 57.7% drop over the same period, also accelerating downward with extreme volatility at 41.79%. Its recent trend sharply reversed, rising 15.62% from November 2025, showing strong short-term recovery.
PG’s steadier decline contrasts with ELF’s deep loss and strong rebound. PG delivered higher overall stability, while ELF exhibited the highest recent market performance despite long-term weakness.
Target Prices
Analysts present a moderately optimistic target consensus for both Procter & Gamble and e.l.f. Beauty.
| Company | Target Low | Target High | Consensus |
|---|---|---|---|
| The Procter & Gamble Company | 150 | 179 | 165.67 |
| e.l.f. Beauty, Inc. | 85 | 165 | 111.83 |
The Procter & Gamble consensus target sits about 9% above its current price, reflecting steady confidence. e.l.f. Beauty’s wider range implies greater uncertainty, with the consensus modestly above its current price.

Don’t Let Luck Decide Your Entry Point
Optimize your entry points with our advanced ProRealTime indicators. You’ll get efficient buy signals with precise price targets for maximum performance. Start outperforming now!
How do institutions grade them?
The Procter & Gamble Company Grades
The latest grades from major institutions for The Procter & Gamble Company are as follows:
| Grading Company | Action | New Grade | Date |
|---|---|---|---|
| TD Cowen | Downgrade | Hold | 2026-01-27 |
| UBS | Maintain | Buy | 2026-01-23 |
| JP Morgan | Upgrade | Overweight | 2026-01-23 |
| Wells Fargo | Maintain | Overweight | 2026-01-23 |
| UBS | Maintain | Buy | 2026-01-14 |
| TD Cowen | Maintain | Buy | 2026-01-08 |
| Wells Fargo | Maintain | Overweight | 2026-01-05 |
| JP Morgan | Maintain | Neutral | 2025-12-18 |
| Jefferies | Upgrade | Buy | 2025-12-17 |
| JP Morgan | Maintain | Neutral | 2025-10-27 |
e.l.f. Beauty, Inc. Grades
The latest grades from major institutions for e.l.f. Beauty, Inc. are as follows:
| Grading Company | Action | New Grade | Date |
|---|---|---|---|
| TD Cowen | Maintain | Buy | 2026-01-21 |
| UBS | Maintain | Neutral | 2026-01-14 |
| Piper Sandler | Maintain | Neutral | 2025-12-22 |
| JP Morgan | Maintain | Overweight | 2025-12-18 |
| Goldman Sachs | Maintain | Buy | 2025-11-07 |
| Piper Sandler | Downgrade | Neutral | 2025-11-06 |
| UBS | Maintain | Neutral | 2025-11-06 |
| Canaccord Genuity | Maintain | Buy | 2025-11-06 |
| JP Morgan | Maintain | Overweight | 2025-11-06 |
| Baird | Maintain | Outperform | 2025-11-06 |
Which company has the best grades?
The Procter & Gamble Company generally receives stronger grades, including multiple “Buy” and “Overweight” ratings. e.l.f. Beauty, Inc. grades cluster around “Neutral” with some “Buy” and “Overweight” ratings. P&G’s higher consensus grades suggest more institutional confidence, potentially impacting investor sentiment more favorably.
Risks specific to each company
In 2026, both firms face critical pressure points and systemic threats shaped by market dynamics, financial structure, and external environments. These risk categories reveal their vulnerabilities and resilience:
1. Market & Competition
The Procter & Gamble Company
- Dominates a mature market with strong brand moats but faces slower growth amid fierce FMCG competition.
e.l.f. Beauty, Inc.
- Operates in a highly competitive beauty niche, vulnerable to rapid trend shifts and larger incumbents’ pressure.
2. Capital Structure & Debt
The Procter & Gamble Company
- Maintains moderate leverage (D/E 0.68) with strong interest coverage (23.23x), signaling solid debt management.
e.l.f. Beauty, Inc.
- Lower leverage (D/E 0.41) but higher WACC (11.5%) raises the cost of capital and financial risk.
3. Stock Volatility
The Procter & Gamble Company
- Low beta (0.39) reflects stable trading and defensive sector positioning.
e.l.f. Beauty, Inc.
- High beta (1.72) indicates elevated volatility and sensitivity to market swings.
4. Regulatory & Legal
The Procter & Gamble Company
- Faces extensive regulatory scrutiny globally due to product range and scale, but with established compliance systems.
e.l.f. Beauty, Inc.
- Operating globally but smaller scale may limit regulatory burden; however, cosmetic regulations remain stringent and evolving.
5. Supply Chain & Operations
The Procter & Gamble Company
- Large, diversified supply chain offers resilience but complexity risks remain amid inflationary pressures.
e.l.f. Beauty, Inc.
- Smaller scale supply chain more agile but vulnerable to disruptions and cost inflation.
6. ESG & Climate Transition
The Procter & Gamble Company
- Significant ESG investments and targets strengthen long-term sustainability but raise near-term costs.
e.l.f. Beauty, Inc.
- Emerging ESG initiatives with room for improvement; risks from consumer and regulatory expectations rising.
7. Geopolitical Exposure
The Procter & Gamble Company
- Global footprint exposes it to trade tensions and currency fluctuations but with hedging strategies.
e.l.f. Beauty, Inc.
- More concentrated US focus limits some geopolitical risk but reduces international growth diversification.
Which company shows a better risk-adjusted profile?
The Procter & Gamble Company’s dominant market position, conservative leverage with strong interest coverage, and low stock volatility provide a more stable risk-adjusted profile. e.l.f. Beauty faces greater market and financial risks, amplified by higher beta and cost of capital. P&G’s Altman Z-Score of 5.42 confirms strong financial safety, while e.l.f.’s 3.63, though in the safe zone, signals less buffer. The most impactful risk for P&G is its unfavorable liquidity ratios, posing near-term operational strain. For e.l.f., elevated stock volatility and high WACC threaten valuation stability. Overall, P&G offers better risk management amid 2026’s uncertain landscape.
Final Verdict: Which stock to choose?
The Procter & Gamble Company stands out as a cash-generating powerhouse with a durable competitive moat. Its ability to deliver consistent returns above its cost of capital signals efficient capital allocation. However, a weak current ratio signals liquidity caution. PG suits portfolios seeking stable, long-term income and moderate growth.
e.l.f. Beauty, Inc. impresses with a strategic moat rooted in rapid revenue growth and asset turnover. Its liquidity profile is notably stronger, offering a cushion against volatility. Yet, its capital destruction trend and high valuation multiples warrant careful monitoring. ELF fits growth-oriented investors willing to embrace higher risk for outsized potential.
If you prioritize steady value creation and income stability, Procter & Gamble outshines as the compelling choice due to its proven moat and robust cash flow. However, if you seek aggressive growth with a tolerance for volatility, e.l.f. Beauty offers better upside potential, albeit with greater financial risk and valuation premium.
Disclaimer: Investment carries a risk of loss of initial capital. The past performance is not a reliable indicator of future results. Be sure to understand risks before making an investment decision.
Go Further
I encourage you to read the complete analyses of The Procter & Gamble Company and e.l.f. Beauty, Inc. to enhance your investment decisions: