Home > Comparison > Consumer Defensive > PG vs CL
The strategic rivalry between The Procter & Gamble Company and Colgate-Palmolive Company defines the current trajectory of the consumer defensive sector. Procter & Gamble operates as a diversified industrial powerhouse spanning five segments, while Colgate-Palmolive focuses on oral care and pet nutrition with a leaner operational model. This head-to-head pits broad market leadership against targeted specialization. This analysis aims to identify which path delivers superior risk-adjusted returns for a diversified portfolio.
Table of contents
Companies Overview
The Procter & Gamble Company and Colgate-Palmolive Company dominate the global household and personal products market.
The Procter & Gamble Company: Global Consumer Goods Powerhouse
The Procter & Gamble Company defines the household & personal products sector with a diverse portfolio. It generates revenue through five segments including Beauty, Grooming, and Health Care. In 2026, its strategic focus remains on expanding premium brands and enhancing e-commerce channels to sustain its competitive advantage and market leadership.
Colgate-Palmolive Company: Oral and Home Care Specialist
Colgate-Palmolive Company excels in oral, personal, and home care products, supplemented by a growing pet nutrition segment. Its core revenue stems from a broad range of consumer brands marketed globally through retailers and e-commerce. The 2026 strategy emphasizes innovation in oral health and pet nutrition to capture niche growth opportunities.
Strategic Collision: Similarities & Divergences
Both companies operate in consumer defensive sectors but differ in scope; Procter & Gamble pursues a broad multi-segment approach, while Colgate-Palmolive focuses heavily on oral care and pet nutrition. They compete primarily on brand strength and retail reach. Their investment profiles contrast: Procter & Gamble offers scale and diversification, whereas Colgate-Palmolive presents focused growth with niche exposure.
Income Statement Comparison
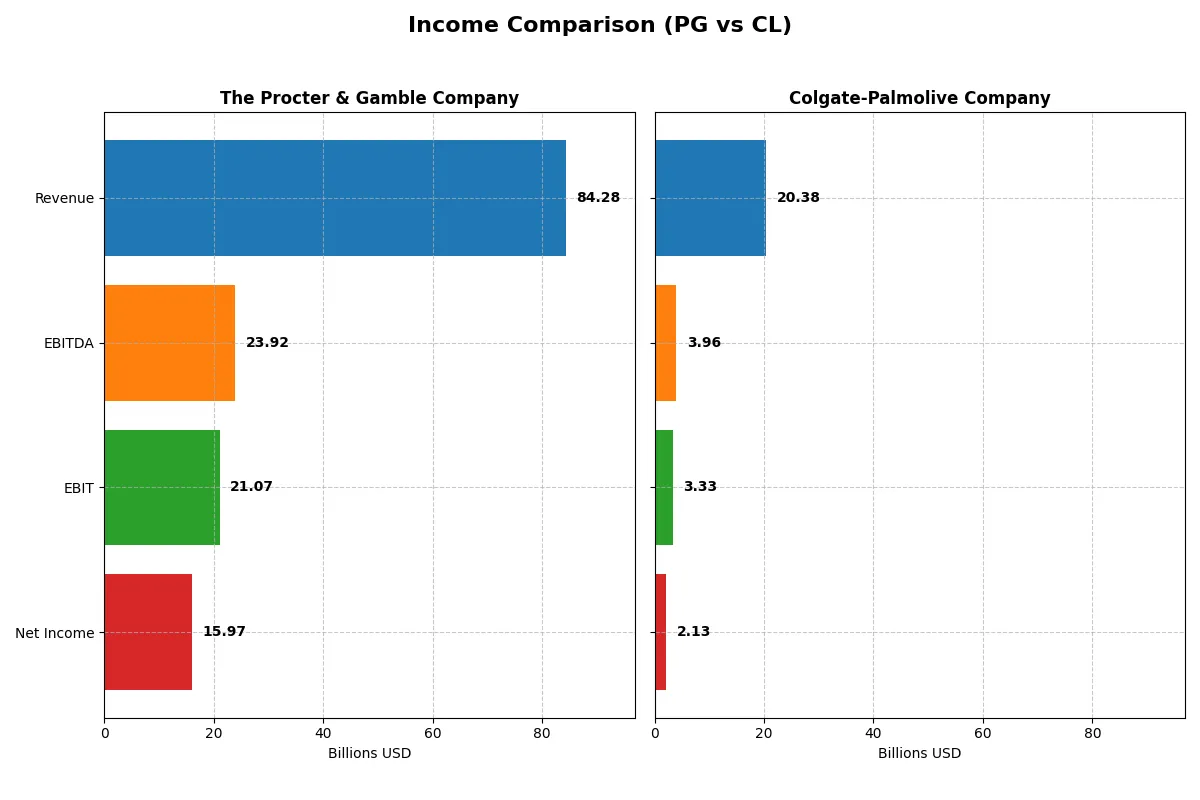
This data dissects the core profitability and scalability of both corporate engines to reveal who dominates the bottom line:
| Metric | The Procter & Gamble Company (PG) | Colgate-Palmolive Company (CL) |
|---|---|---|
| Revenue | 84.3B | 20.4B |
| Cost of Revenue | 41.2B | 8.1B |
| Operating Expenses | 22.7B | 7.9B |
| Gross Profit | 43.1B | 12.3B |
| EBITDA | 23.9B | 4.0B |
| EBIT | 21.1B | 3.3B |
| Interest Expense | 907M | 267M |
| Net Income | 15.9B | 0 |
| EPS | 6.67 | 2.64 |
| Fiscal Year | 2025 | 2025 |
Income Statement Analysis: The Bottom-Line Duel
This income statement comparison reveals which company operates with greater efficiency and profitability across recent fiscal years.
The Procter & Gamble Company Analysis
Procter & Gamble’s revenue grew steadily from 76B in 2021 to 84B in 2025, with net income rising from 14.3B to 16B. The company maintains robust gross and net margins, around 51% and 19%, respectively. In 2025, P&G improved EBIT by 7% and net margin by nearly the same, signaling enhanced operational efficiency and solid momentum.
Colgate-Palmolive Company Analysis
Colgate-Palmolive’s revenue climbed from 17.4B in 2021 to 20.4B in 2025, but net income declined from 2.17B to near zero in 2025 due to a large net income deduction. Gross margin hovered above 60%, yet net margin fell sharply to 10%. The latest year showed a steep 27% net margin drop and a 25% EPS decline, indicating weakening profitability despite revenue gains.
Margin Strength vs. Profitability Sustainability
Procter & Gamble clearly outperforms Colgate in sustaining profit growth and margin health. P&G’s consistent margin expansion and net income rise contrast with Colgate’s troubling net income erosion despite revenue growth. For investors prioritizing durable profitability and operational efficiency, P&G’s profile presents a stronger fundamental case.
Financial Ratios Comparison
These vital ratios act as a diagnostic tool to expose the underlying fiscal health, valuation premiums, and capital efficiency of the companies analyzed:
| Ratios | The Procter & Gamble Company (PG) | Colgate-Palmolive Company (CL) |
|---|---|---|
| ROE | 30.7% | 13.6% |
| ROIC | 16.5% | 30.6% |
| P/E | 24.5 | 25.7 |
| P/B | 7.52 | 350.6 |
| Current Ratio | 0.70 | 0.92 |
| Quick Ratio | 0.49 | 0.58 |
| D/E | 0.68 | 40.15 |
| Debt-to-Assets | 28.3% | 53.0% |
| Interest Coverage | 22.5 | 15.0 |
| Asset Turnover | 0.67 | 1.25 |
| Fixed Asset Turnover | 3.53 | 4.55 |
| Payout ratio | 61.8% | 61.9% |
| Dividend yield | 2.52% | 2.41% |
| Fiscal Year | 2025 | 2024 |
Efficiency & Valuation Duel: The Vital Signs
Ratios act as the company’s DNA, revealing hidden risks and operational excellence that drive investor decisions.
The Procter & Gamble Company
PG demonstrates strong profitability with a 30.7% ROE and an 18.95% net margin, signaling operational efficiency. Its P/E ratio at 24.48 appears neutral, though a high PB ratio of 7.52 is stretched. The 2.52% dividend yield rewards shareholders steadily, reflecting a balanced capital allocation strategy.
Colgate-Palmolive Company
CL shows an exceptionally high ROE at 1362.7%, suggesting extraordinary returns, but this may signal accounting distortions. Its net margin is a solid 14.37%. The P/E ratio of 25.73 is expensive, and a sky-high PB of 350.65 highlights valuation risk. The 2.41% dividend yield offers consistent shareholder returns amid aggressive leverage.
Premium Valuation vs. Operational Safety
PG offers a safer risk-reward profile with balanced profitability and a reasonable valuation despite some liquidity concerns. CL’s inflated ROE and stretched valuation expose higher risk. PG fits investors seeking stable operational excellence; CL may appeal to those chasing outsized returns with caution.
Which one offers the Superior Shareholder Reward?
I compare The Procter & Gamble Company (PG) and Colgate-Palmolive Company (CL) focusing on dividends, payout ratios, and buybacks. PG delivers a 2.52% dividend yield with a 62% payout ratio, supported by strong free cash flow coverage above 80%. It pairs dividends with a robust buyback program, enhancing total shareholder return sustainably. CL pays a similar yield near 2.4% but sports a higher payout ratio around 62-76%, risking future flexibility. CL’s buybacks are less pronounced, and its heavier debt load raises caution. I judge PG’s balanced distribution and buyback strategy more sustainable and attractive for total return in 2026.
Comparative Score Analysis: The Strategic Profile
The radar chart reveals the core financial DNA and trade-offs of The Procter & Gamble Company and Colgate-Palmolive Company, highlighting their strategic differences:
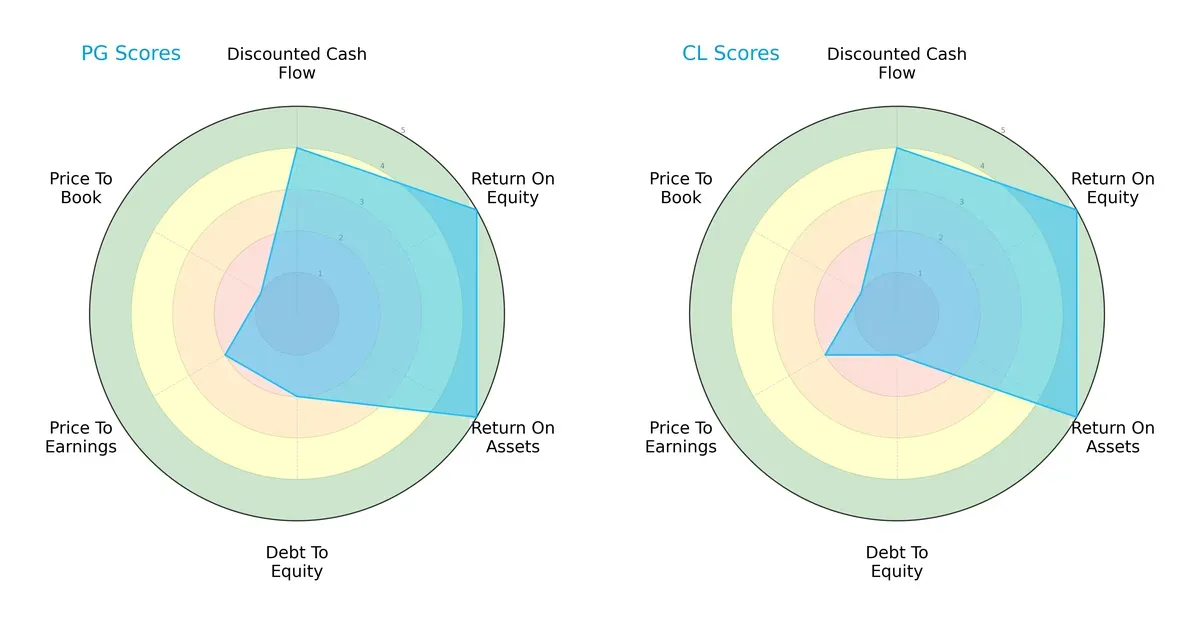
Both firms show strong operational efficiency with top scores in ROE and ROA (5 each). They share favorable discounted cash flow scores (4), indicating healthy future cash flow expectations. However, Colgate-Palmolive exhibits a more conservative balance sheet with a weaker debt-to-equity score (1) versus P&G’s moderate score (2). Valuation metrics remain a challenge for both, with low scores in price-to-book (1) and moderate price-to-earnings (2), reflecting possible market skepticism or overvaluation risks. P&G’s profile is slightly more balanced, leveraging solid profitability and moderate leverage, while Colgate-Palmolive relies heavily on low leverage as its financial edge.
—
Bankruptcy Risk: Solvency Showdown
The Altman Z-Score gap indicates both companies reside comfortably in the safe zone, but Colgate-Palmolive’s higher 6.75 score suggests a stronger buffer against financial distress than P&G’s 5.42:

—
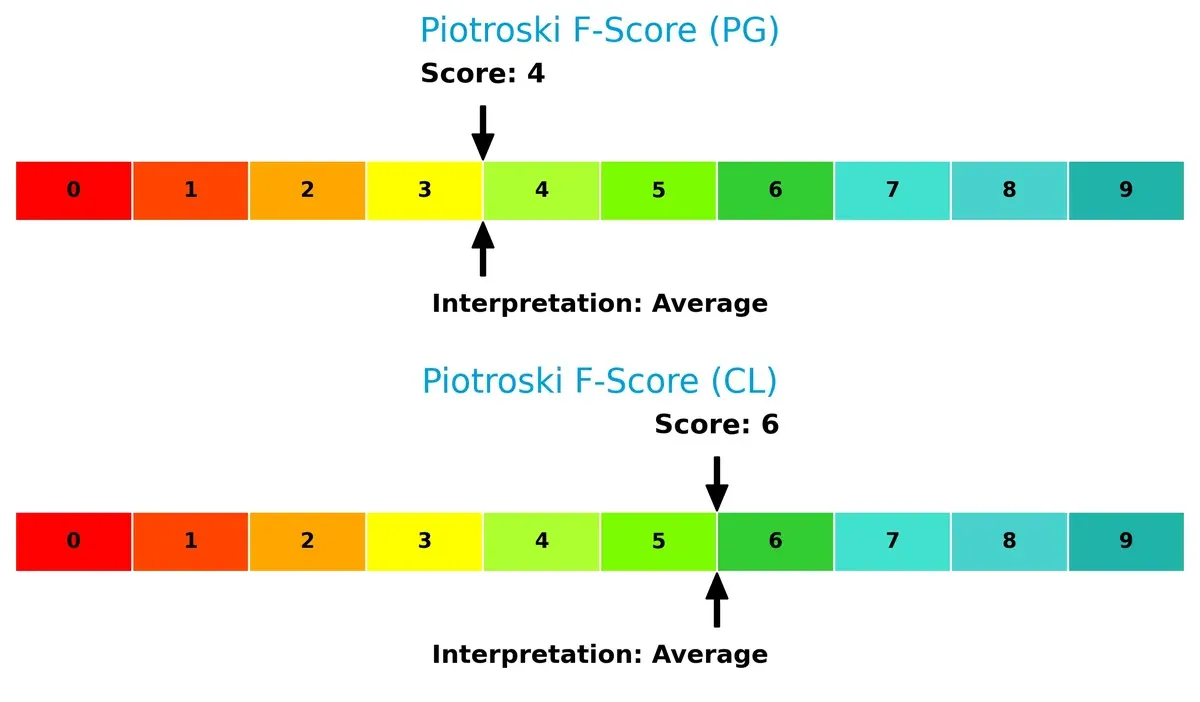
Financial Health: Quality of Operations
Piotroski F-Scores show Colgate-Palmolive at 6, outpacing P&G’s 4, suggesting Colgate is in comparatively better financial shape without immediate red flags:
How are the two companies positioned?
This section dissects the operational DNA of PG and CL by comparing their revenue distribution by segment alongside their core strengths and weaknesses. The ultimate goal is to confront their economic moats to identify which model delivers the most resilient, sustainable competitive advantage today.
Revenue Segmentation: The Strategic Mix
This visual comparison dissects how The Procter & Gamble Company and Colgate-Palmolive Company diversify their income streams and where their primary sector bets lie:
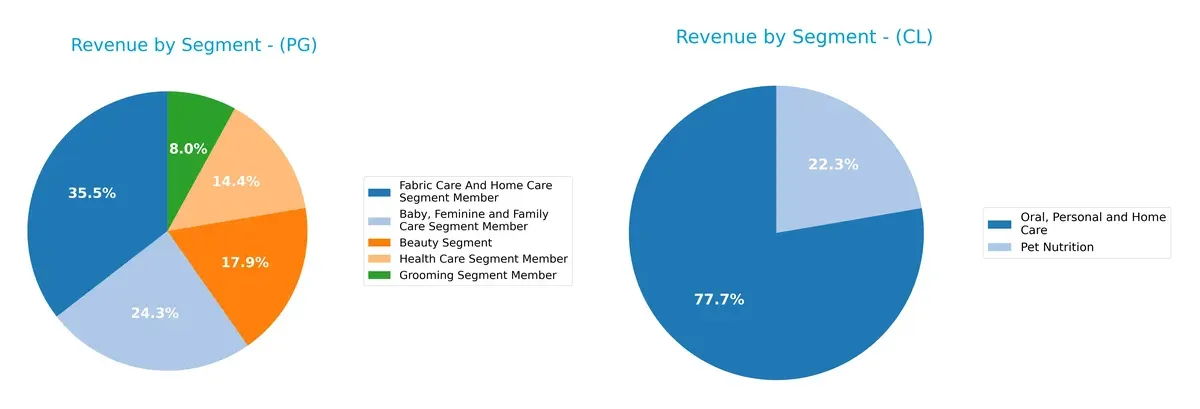
Procter & Gamble dwarfs Colgate-Palmolive in segment breadth, with five substantial divisions ranging from $6.6B grooming to $29.6B fabric care. P&G’s diversified mix anchors its ecosystem lock-in and reduces concentration risk. In contrast, Colgate-Palmolive pivots heavily on Oral, Personal and Home Care at $15.6B, with a smaller $4.5B pet nutrition segment. This concentration implies higher dependency on a core category but may offer focused market dominance.
Strengths and Weaknesses Comparison
This table compares the strengths and weaknesses of The Procter & Gamble Company (PG) and Colgate-Palmolive Company (CL):
PG Strengths
- Diversified product segments across six categories
- Strong global presence with nearly equal US and Non-US revenues
- Favorable profitability metrics: net margin 18.95%, ROIC 16.47%, interest coverage 23.23x
CL Strengths
- Focused product segments in Oral, Personal, Home Care, and Pet Nutrition
- Favorable profitability with ROIC 30.56% and strong net margin 14.37%
- Higher asset turnover at 1.25 and fixed asset turnover 4.55
PG Weaknesses
- Low liquidity ratios: current ratio 0.7, quick ratio 0.49
- High price-to-book ratio at 7.52
- Moderate debt-to-equity at 0.68
- PE ratio neutral at 24.48
CL Weaknesses
- Poor liquidity with current ratio 0.92, quick ratio 0.58
- Very high price-to-book ratio at 350.65
- Elevated debt-to-equity at 40.15
- Unfavorable PE at 25.73
Both companies show strong profitability supported by solid returns on invested capital. PG’s diversified product range and global footprint provide resilience, while CL’s efficiency in asset utilization stands out. Liquidity and valuation metrics highlight financial risks for both, especially CL’s stretched price-to-book ratio and debt load. These factors influence strategic decisions on capital allocation and risk management.
The Moat Duel: Analyzing Competitive Defensibility
A structural moat alone shields long-term profits from relentless competitive erosion. It defines which firms can sustain advantage over decades:
The Procter & Gamble Company: Brand Power with Scale Economies
P&G’s moat stems from its vast brand portfolio and scale-driven cost advantages. This delivers stable 19% net margins and a growing ROIC above WACC by 11%. Expansion into emerging markets in 2026 could deepen its cost and distribution moats.
Colgate-Palmolive Company: Focused Brand Loyalty and Innovation
Colgate’s moat relies on strong brand loyalty in oral care and pet nutrition, supported by a remarkable 26% ROIC premium over WACC. Its narrower product scope limits scale but boosts margin resilience. New formulas and global pet nutrition growth offer upside in 2026.
Moat Strength: Scale Economies vs. Brand Focus
Both firms show very favorable moats with rising ROICs, but P&G’s broader scale translates into a wider moat. P&G’s diverse segments better defend market share against disruption, while Colgate’s focused moat is deeper but more vulnerable to category shifts.
Which stock offers better returns?
The past year revealed divergent price movements for Procter & Gamble and Colgate-Palmolive, marked by accelerating trends and varying buyer dominance in trading volumes.
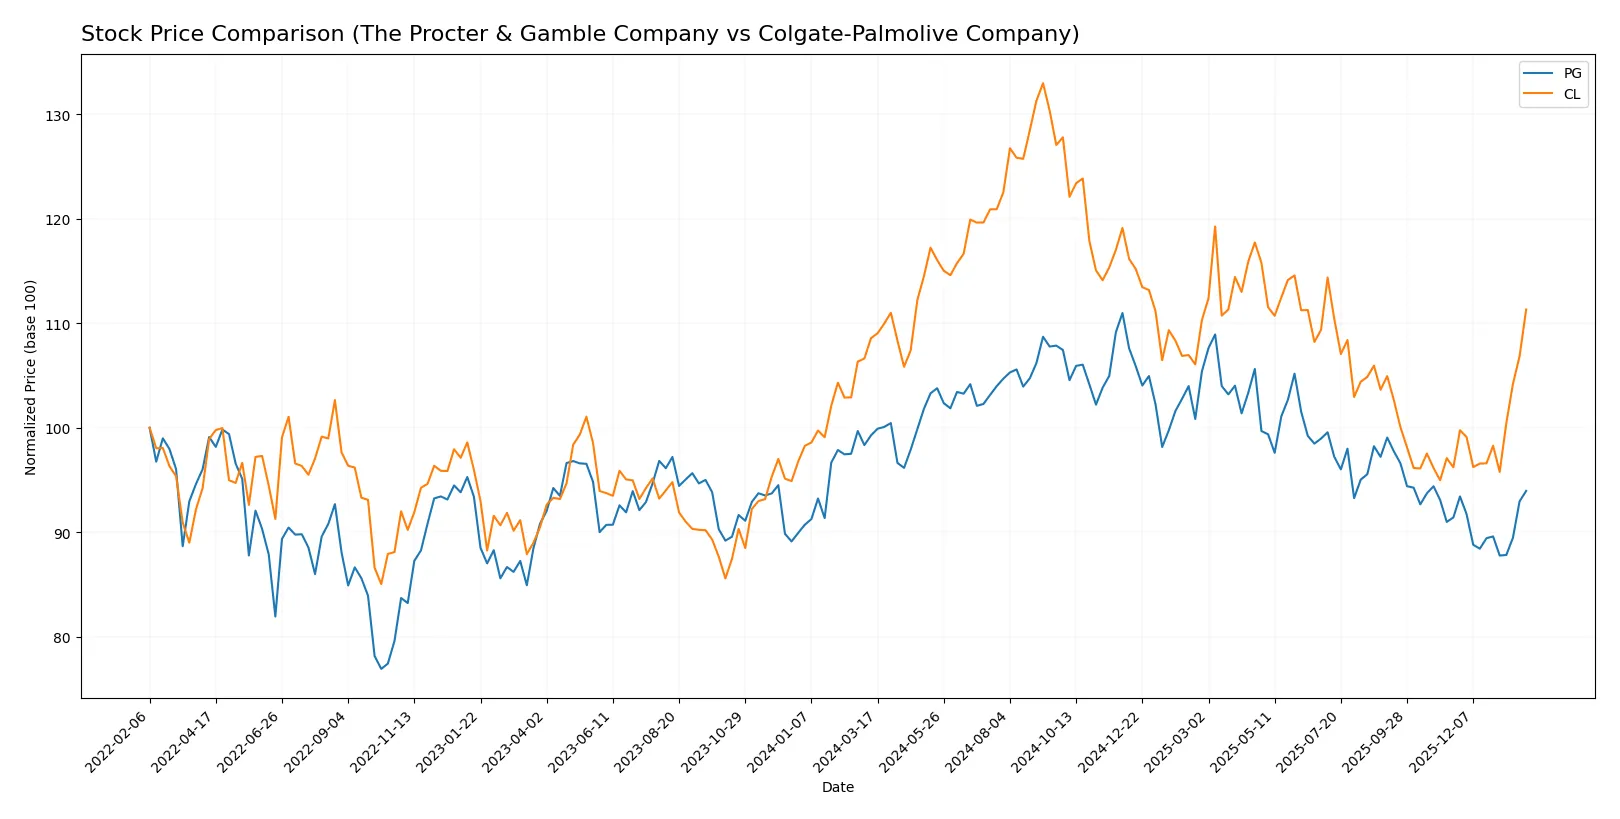
Trend Comparison
The Procter & Gamble Company’s stock declined 5.35% over the past year, showing a bearish trend with accelerating downward momentum and a high volatility level (8.85 std deviation).
Colgate-Palmolive Company’s stock rose 2.52% in the same period, sustaining a bullish trend with accelerating gains and moderate volatility (7.34 std deviation).
Colgate-Palmolive outperformed Procter & Gamble, delivering positive returns versus a negative price change for PG over the past year.
Target Prices
Analysts present a moderately bullish consensus on Procter & Gamble and Colgate-Palmolive with target prices above current levels.
| Company | Target Low | Target High | Consensus |
|---|---|---|---|
| The Procter & Gamble Company | 150 | 179 | 165.67 |
| Colgate-Palmolive Company | 83 | 96 | 89.2 |
The consensus targets for both stocks sit above their current prices, indicating expected appreciation. Procter & Gamble’s target consensus suggests a 9% upside versus its $151.77 price; Colgate-Palmolive shows a smaller but notable 1% potential increase from $90.29.

Don’t Let Luck Decide Your Entry Point
Optimize your entry points with our advanced ProRealTime indicators. You’ll get efficient buy signals with precise price targets for maximum performance. Start outperforming now!
How do institutions grade them?
The Procter & Gamble Company Grades
Below are the latest institutional grades for The Procter & Gamble Company:
| Grading Company | Action | New Grade | Date |
|---|---|---|---|
| TD Cowen | Downgrade | Hold | 2026-01-27 |
| UBS | Maintain | Buy | 2026-01-23 |
| JP Morgan | Upgrade | Overweight | 2026-01-23 |
| Wells Fargo | Maintain | Overweight | 2026-01-23 |
| UBS | Maintain | Buy | 2026-01-14 |
| TD Cowen | Maintain | Buy | 2026-01-08 |
| Wells Fargo | Maintain | Overweight | 2026-01-05 |
| JP Morgan | Maintain | Neutral | 2025-12-18 |
| Jefferies | Upgrade | Buy | 2025-12-17 |
| JP Morgan | Maintain | Neutral | 2025-10-27 |
Colgate-Palmolive Company Grades
The following table lists recent grades for Colgate-Palmolive Company:
| Grading Company | Action | New Grade | Date |
|---|---|---|---|
| JP Morgan | Maintain | Overweight | 2026-01-16 |
| UBS | Maintain | Buy | 2026-01-14 |
| Wells Fargo | Upgrade | Equal Weight | 2026-01-13 |
| TD Cowen | Maintain | Buy | 2026-01-08 |
| Piper Sandler | Upgrade | Overweight | 2026-01-07 |
| JP Morgan | Maintain | Overweight | 2025-12-18 |
| Argus Research | Downgrade | Hold | 2025-12-11 |
| RBC Capital | Upgrade | Outperform | 2025-12-09 |
| Barclays | Maintain | Equal Weight | 2025-11-04 |
| Citigroup | Maintain | Buy | 2025-11-03 |
Which company has the best grades?
Both companies receive mostly positive grades, but The Procter & Gamble Company shows a stronger consensus for Buy and Overweight ratings. Colgate-Palmolive’s mix includes some downgrades and Equal Weight grades. Investors may view P&G’s steadier upgrades as a sign of greater confidence.
Risks specific to each company
The following categories identify the critical pressure points and systemic threats facing both firms in the 2026 market environment:
1. Market & Competition
The Procter & Gamble Company
- Dominates with diversified segments and strong brand portfolio, but faces intense competition in global consumer goods.
Colgate-Palmolive Company
- Strong niche presence in oral care and pet nutrition, but less diversified, risking market share loss in broader household products.
2. Capital Structure & Debt
The Procter & Gamble Company
- Moderate leverage (D/E 0.68) with favorable interest coverage (23.23) ensures financial flexibility.
Colgate-Palmolive Company
- Higher leverage (D/E 40.15) and elevated debt-to-assets ratio (53.05%) raise financial risk despite decent interest coverage (12.46).
3. Stock Volatility
The Procter & Gamble Company
- Low beta (0.388) indicates lower market volatility and defensive stock behavior.
Colgate-Palmolive Company
- Even lower beta (0.285) suggests very stable stock, appealing for risk-averse investors.
4. Regulatory & Legal
The Procter & Gamble Company
- Global operations expose it to complex regulatory environments but strong compliance track record mitigates risks.
Colgate-Palmolive Company
- Regulatory risks concentrated in oral care and pet nutrition sectors with ongoing scrutiny on product safety standards.
5. Supply Chain & Operations
The Procter & Gamble Company
- Extensive global supply chain vulnerable to geopolitical disruptions but benefits from scale and operational efficiencies.
Colgate-Palmolive Company
- Smaller scale supply chain focused on fewer categories, potentially less resilient but more agile.
6. ESG & Climate Transition
The Procter & Gamble Company
- Aggressive ESG initiatives and climate goals support long-term sustainability but require significant capital investment.
Colgate-Palmolive Company
- Emerging ESG efforts with room for improvement; slower climate transition could affect brand perception.
7. Geopolitical Exposure
The Procter & Gamble Company
- Broad international footprint exposes it to currency fluctuations and trade tensions.
Colgate-Palmolive Company
- More concentrated geographic exposure reduces some risks but increases vulnerability to regional instability.
Which company shows a better risk-adjusted profile?
P&G’s moderate leverage and comprehensive market diversification provide a stronger cushion against financial and operational shocks. Colgate’s higher debt levels and concentrated product lines heighten its financial and competitive risks. Both maintain defensive stock volatility, but P&G’s broader scale and ESG leadership enhance its resilience in 2026’s uncertain environment.
Final Verdict: Which stock to choose?
The Procter & Gamble Company shines with unmatched capital efficiency and a durable competitive moat, consistently creating value above its cost of capital. Its main point of vigilance is a weaker liquidity position, which could challenge short-term flexibility. PG suits investors aiming for steady, long-term growth with moderate risk tolerance.
Colgate-Palmolive Company commands a strategic moat through robust returns on invested capital and a strong cash flow profile. Although it carries higher leverage and slightly more balance sheet risk than PG, it offers superior recent price momentum and resilience. CL fits well within portfolios seeking growth at a reasonable price with a tolerance for financial leverage.
If you prioritize capital efficiency and a proven value creator with stable fundamentals, PG outshines as the compelling choice due to its strong economic moat and consistent profitability. However, if you seek growth with stronger price momentum and can tolerate higher leverage, CL offers better upside potential and accelerating returns. Both present analytical scenarios depending on investor risk appetite and strategy.
Disclaimer: Investment carries a risk of loss of initial capital. The past performance is not a reliable indicator of future results. Be sure to understand risks before making an investment decision.
Go Further
I encourage you to read the complete analyses of The Procter & Gamble Company and Colgate-Palmolive Company to enhance your investment decisions: