Home > Comparison > Financial Services > USB vs PNC
The competitive dynamics between U.S. Bancorp and The PNC Financial Services Group shape the regional banking landscape in the U.S. U.S. Bancorp operates a broad financial services platform with a strong retail and commercial banking presence, while PNC emphasizes diversified banking with a focus on corporate and institutional clients. This analysis explores their contrasting growth strategies to identify which bank offers the more compelling risk-adjusted return for a balanced portfolio in today’s evolving financial sector.

Table of contents
Companies Overview
U.S. Bancorp and The PNC Financial Services Group dominate regional banking with expansive footprints and comprehensive service offerings.
U.S. Bancorp: Midwest and West Regional Banking Powerhouse
U.S. Bancorp operates as a regional bank with a stronghold in the Midwest and West. It generates revenue through diversified financial services including consumer banking, corporate lending, wealth management, and payment processing. In 2021, it emphasized expanding digital channels and asset management, leveraging 2,230 branches and 4,059 ATMs to enhance customer reach and operational efficiency.
The PNC Financial Services Group: Diversified Banking and Wealth Leader
PNC stands out as a diversified financial services company with a broad national footprint. Its revenue derives from retail banking, corporate and institutional lending, and asset management. In 2021, PNC focused on strengthening its technology platforms and expanding its asset management capabilities, supported by 2,591 branches and 9,502 ATMs, aiming to deepen client relationships and capture scale advantages.
Strategic Collision: Similarities & Divergences
Both banks emphasize diversified revenue streams and robust branch networks but diverge in geographic focus and scale. U.S. Bancorp prioritizes the Midwest and West, while PNC targets a broader U.S. presence with a heavier asset management push. The primary battleground is retail and corporate lending, where each seeks to leverage digital innovation. Their distinct scale and strategic priorities define unique risk and growth profiles for investors.
Income Statement Comparison
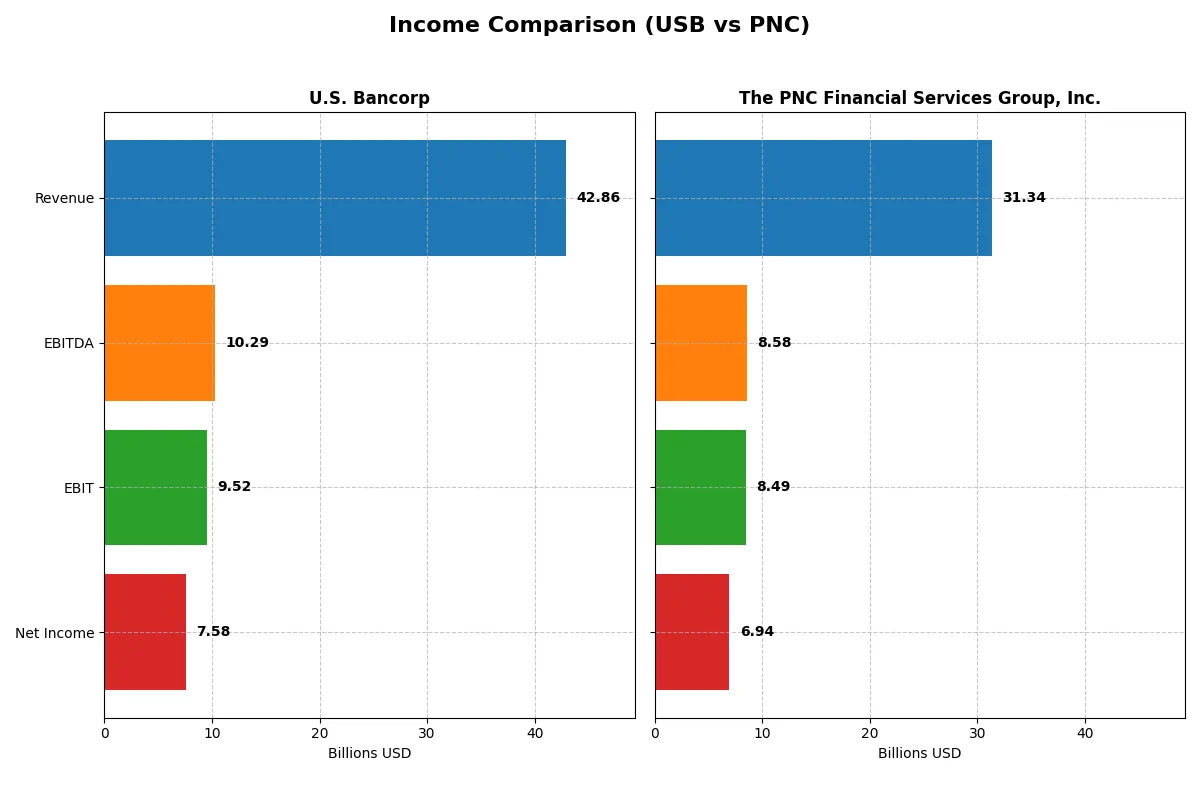
This data dissects the core profitability and scalability of both corporate engines to reveal who dominates the bottom line:
| Metric | U.S. Bancorp (USB) | The PNC Financial Services Group, Inc. (PNC) |
|---|---|---|
| Revenue | 42.9B | 31.3B |
| Cost of Revenue | 15.9B | 8.9B |
| Operating Expenses | 17.4B | 14.0B |
| Gross Profit | 26.9B | 22.5B |
| EBITDA | 10.3B | 8.6B |
| EBIT | 9.5B | 8.5B |
| Interest Expense | 14.3B | 10.9B |
| Net Income | 7.6B | 6.9B |
| EPS | 4.62 | 16.62 |
| Fiscal Year | 2025 | 2025 |
Income Statement Analysis: The Bottom-Line Duel
This income statement comparison reveals which company operates with superior efficiency and profitability in a highly competitive financial sector.
U.S. Bancorp Analysis
U.S. Bancorp’s revenue shows steady growth, reaching $42.9B in 2025, but net income dipped slightly over five years to $7.6B in 2025. Gross margin remains healthy at 62.8%, while net margin stands at 17.7%, signaling solid profitability. The 2025 year shows strong momentum with a 20.3% EBIT increase and improved net margin, despite rising interest expenses.
The PNC Financial Services Group, Inc. Analysis
PNC’s revenue declined slightly to $31.3B in 2025 but net income rose by 22.2% over five years to $6.9B. It boasts superior margins with a gross margin of 71.7% and a net margin of 22.1%. The 2025 results reflect efficient cost control and robust margin expansion, supported by a 17.2% EBIT growth and a 26.6% net margin increase year-over-year.
Margin Strength vs. Growth Stability
PNC demonstrates stronger margin health and consistent net income growth, outperforming U.S. Bancorp’s scale and revenue expansion. U.S. Bancorp offers higher revenue but struggles with margin compression and interest expense pressures. Investors seeking margin resilience may favor PNC, while those prioritizing revenue growth might lean toward U.S. Bancorp’s profile.
Financial Ratios Comparison
These vital ratios act as a diagnostic tool to expose the underlying fiscal health, valuation premiums, and capital efficiency of the companies compared below:
| Ratios | U.S. Bancorp (USB) | The PNC Financial Services Group, Inc. (PNC) |
|---|---|---|
| ROE | 11.62% | 11.45% |
| ROIC | 11.14% | 7.65% |
| P/E | 10.95 | 11.86 |
| P/B | 1.27 | 1.36 |
| Current Ratio | 2.73 | 0.81 |
| Quick Ratio | 2.73 | 0.81 |
| D/E | 1.20 | 0.94 |
| Debt-to-Assets | 11.26% | 9.96% |
| Interest Coverage | 0.66 | 0.78 |
| Asset Turnover | 0.062 | 0.055 |
| Fixed Asset Turnover | 11.38 | 0.00 |
| Payout ratio | 41.46% | 37.49% |
| Dividend yield | 3.79% | 3.16% |
| Fiscal Year | 2025 | 2025 |
Efficiency & Valuation Duel: The Vital Signs
Financial ratios serve as a company’s DNA, exposing hidden risks and operational strengths that shape investment decisions.
U.S. Bancorp
U.S. Bancorp exhibits solid profitability with an 11.6% ROE and a commendable 17.7% net margin. Its valuation appears reasonable, with a P/E of 10.95 and P/B of 1.27, suggesting the stock is attractively priced. The firm supports shareholders through a 3.79% dividend yield, balancing income with efficient capital allocation despite a slightly unfavorable ROIC versus WACC.
The PNC Financial Services Group, Inc.
PNC posts a stronger net margin of 22.1% but a slightly lower ROE at 11.45%. The stock trades at a higher P/E of 11.86 and P/B of 1.36, indicating a premium valuation. Dividend yield stands at 3.16%, reflecting steady shareholder returns. However, mixed ratio signals and a lower ROIC relative to WACC temper the efficiency narrative.
Balanced Value vs. Premium Income Profile
U.S. Bancorp offers a more favorable global ratio profile with attractive valuation metrics and solid dividend yield, presenting a balanced risk-reward tradeoff. PNC’s higher margins come with stretched valuation and more neutral ratio signals. Income-focused investors may prefer PNC’s premium profile, while value seekers might lean toward U.S. Bancorp’s operational stability.
Which one offers the Superior Shareholder Reward?
I compare U.S. Bancorp (USB) and The PNC Financial Services Group, Inc. (PNC) on dividends, payout ratios, and buybacks to evaluate total shareholder return. USB yields 3.8% with a 41% payout ratio, balancing steady dividends and moderate buybacks. PNC offers a 3.2% yield but a lower 37% payout, directing more free cash flow to share repurchases and growth. USB’s higher dividend yield and consistent payout signal reliable income, while PNC’s aggressive buybacks suggest capital return through share appreciation. Historically, USB’s sustainable dividend coverage with stable free cash flow offers safer long-term rewards. I conclude USB provides a superior total return profile for 2026 investors seeking income plus growth.
Comparative Score Analysis: The Strategic Profile
The radar chart reveals the fundamental DNA and trade-offs of both U.S. Bancorp and The PNC Financial Services Group, Inc.:
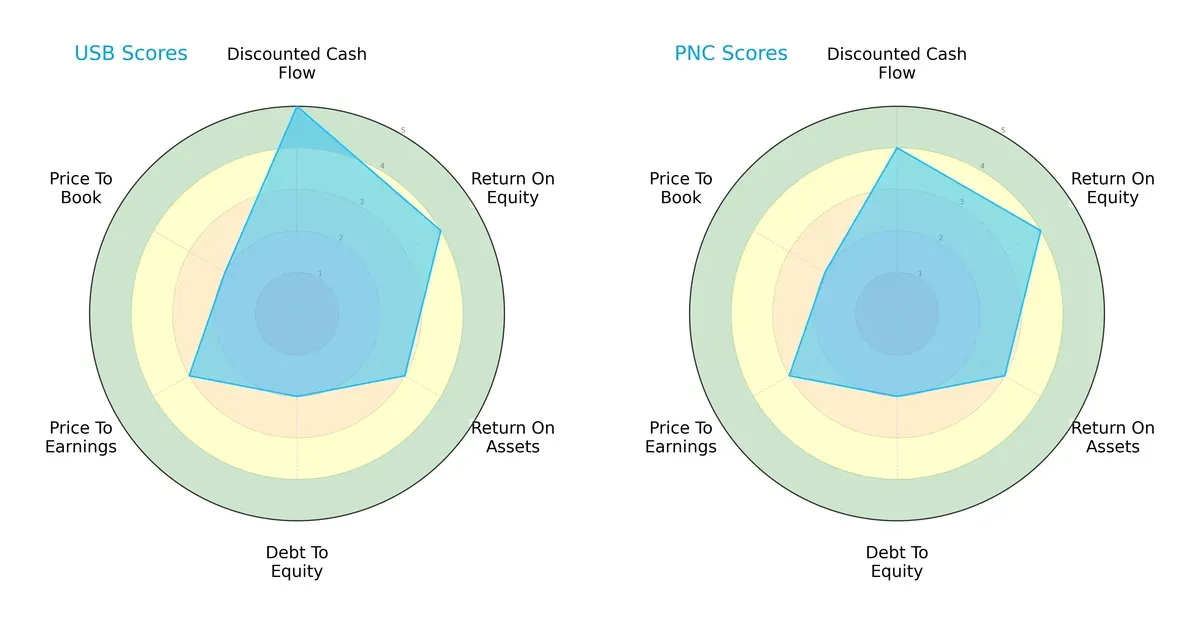
U.S. Bancorp leads in discounted cash flow with a very favorable score of 5, signaling strong future cash generation. Both firms tie on return on equity and assets, illustrating similar operational efficiency. Debt-to-equity and valuation metrics are equally moderate, indicating balanced but cautious leverage and pricing. U.S. Bancorp shows a slight edge in cash flow strength, while PNC maintains a more consistent overall profile without heavy reliance on one metric.
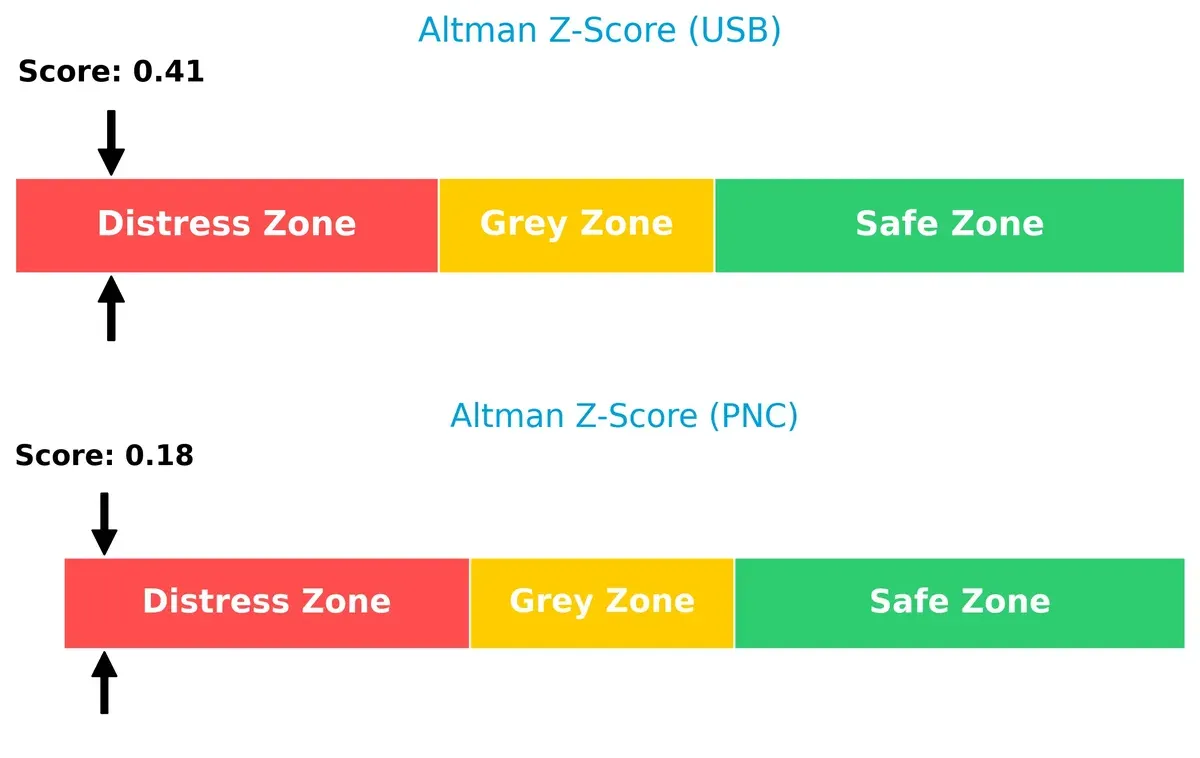
Bankruptcy Risk: Solvency Showdown
The Altman Z-Scores place both banks in the distress zone, with U.S. Bancorp at 0.41 and PNC even lower at 0.18, implying significant long-term survival risks under current economic conditions:
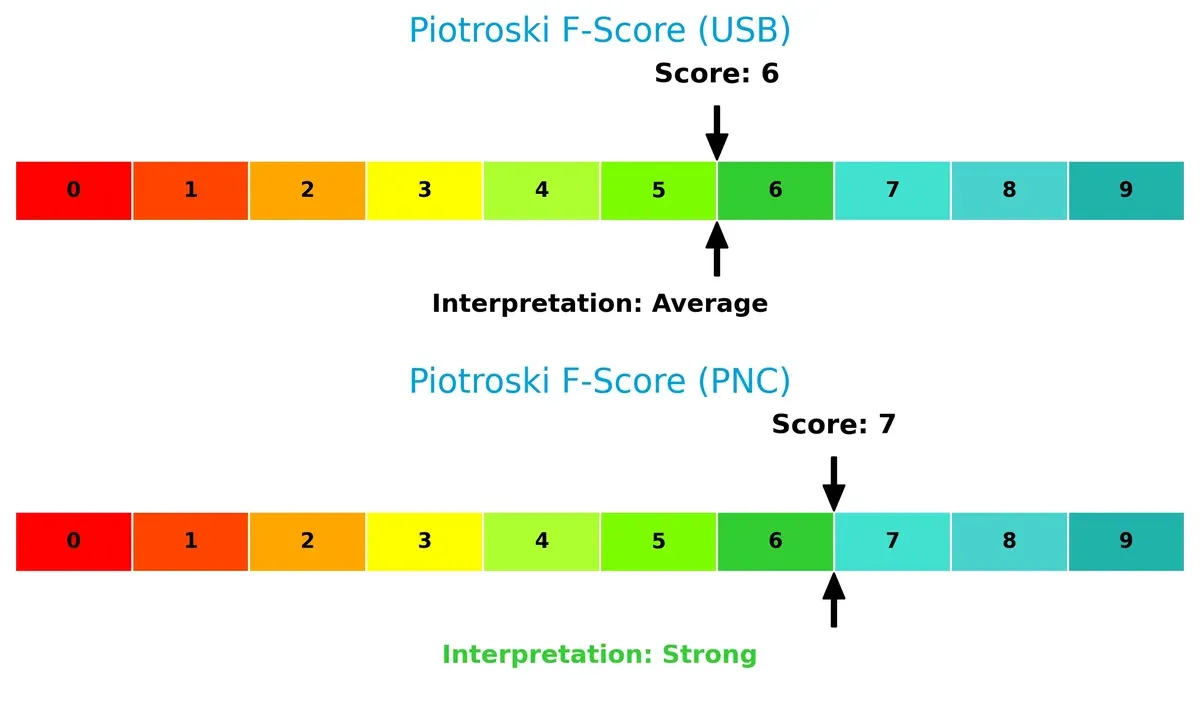
Financial Health: Quality of Operations
The Piotroski F-Score confirms PNC’s stronger internal financial health at 7, compared to U.S. Bancorp’s 6. PNC’s higher score suggests better profitability and balance sheet quality, while U.S. Bancorp’s average score signals some operational caution:
How are the two companies positioned?
This section dissects USB and PNC’s operational DNA by comparing revenue distribution and internal dynamics. The goal is to confront their economic moats to identify which model offers the most resilient competitive advantage today.
Revenue Segmentation: The Strategic Mix
This visual comparison dissects how U.S. Bancorp and The PNC Financial Services Group diversify their income streams and where their primary sector bets lie:
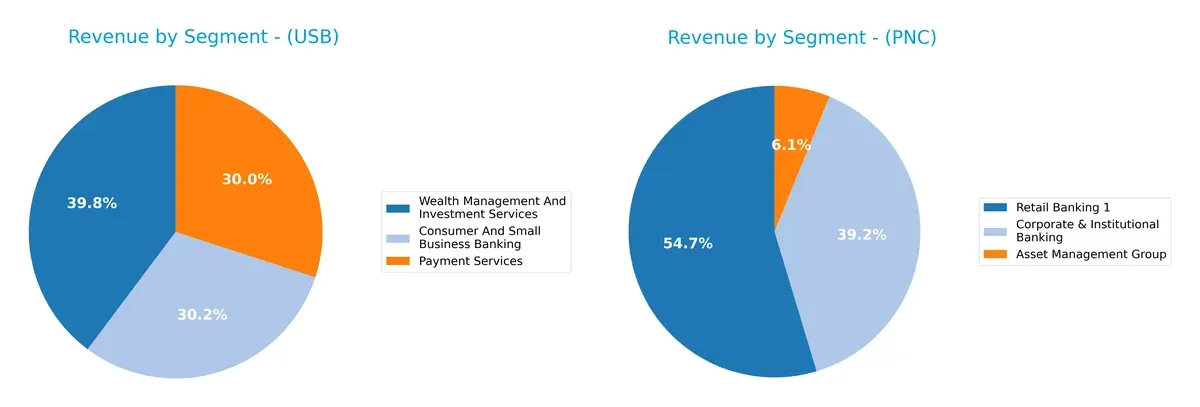
U.S. Bancorp pivots on Wealth Management and Investment Services, generating $12.2B in 2024, alongside balanced contributions from Consumer Banking ($9.3B) and Payment Services ($9.2B). By contrast, PNC leans heavily on Retail Banking at $12.9B and Corporate & Institutional Banking at $9.3B, with Asset Management trailing at $1.45B. USB’s diversified mix reduces concentration risk, while PNC’s focus anchors its strategy in retail and corporate banking dominance.
Strengths and Weaknesses Comparison
This table compares the Strengths and Weaknesses of U.S. Bancorp and The PNC Financial Services Group, Inc.:
U.S. Bancorp Strengths
- Diversified revenue streams across banking, payments, and wealth management
- Favorable net margin at 17.68%
- Strong current and quick ratios at 2.73 indicating liquidity
- Favorable PE and PB ratios show market valuation support
- Dividend yield of 3.79% provides investor income
The PNC Financial Services Group, Inc. Strengths
- Higher net margin at 22.13% reflects profitability advantage
- Favorable PE and PB ratios support valuation
- Strong presence in retail and corporate banking
- Dividend yield of 3.16% supports shareholder returns
U.S. Bancorp Weaknesses
- ROIC below WACC signals capital allocation inefficiency
- Elevated debt-to-equity at 1.2 raises leverage concerns
- Low interest coverage at 0.66 indicates risk in servicing debt
- Low asset turnover at 0.06 signals operational inefficiency
- Negative contribution from Treasury and Corporate Support segment
The PNC Financial Services Group, Inc. Weaknesses
- Current ratio at 0.81 signals liquidity risk
- Neutral ROIC and unfavorable WACC imply moderate capital returns
- Fixed asset turnover at zero indicates asset utilization issues
- Interest coverage low at 0.78 shows debt servicing pressure
- Smaller diversification outside core banking segments
Both companies show strengths in profitability and market valuation metrics. USB demonstrates stronger liquidity and diversification, while PNC excels in net margin and retail banking scale. However, both face capital allocation and debt servicing challenges that could impact strategic flexibility.
The Moat Duel: Analyzing Competitive Defensibility
A structural moat is the only reliable shield protecting long-term profits from relentless competitive erosion in financial services:
U.S. Bancorp: Cost Advantage in Regional Banking
U.S. Bancorp leverages scale and operational efficiency to sustain a cost advantage. Its improving ROIC trend signals growing profitability despite current value destruction. Expansion in digital payments could deepen this moat in 2026.
The PNC Financial Services Group, Inc.: Diversified Service Moat
PNC’s moat arises from broad service diversification and strong client relationships, contrasting USB’s cost focus. It maintains steady ROIC growth, though below WACC, with opportunities to expand in wealth management and institutional banking.
Cost Efficiency vs. Service Diversification: The Moat Showdown
Both banks face value destruction but exhibit rising ROICs. USB’s cost advantage offers a deeper moat through operational leverage. I see USB better positioned to defend market share amid intensifying competition.
Which stock offers better returns?
Over the past 12 months, both U.S. Bancorp and The PNC Financial Services Group, Inc. recorded strong price gains with accelerating bullish trends and rising trading volumes.
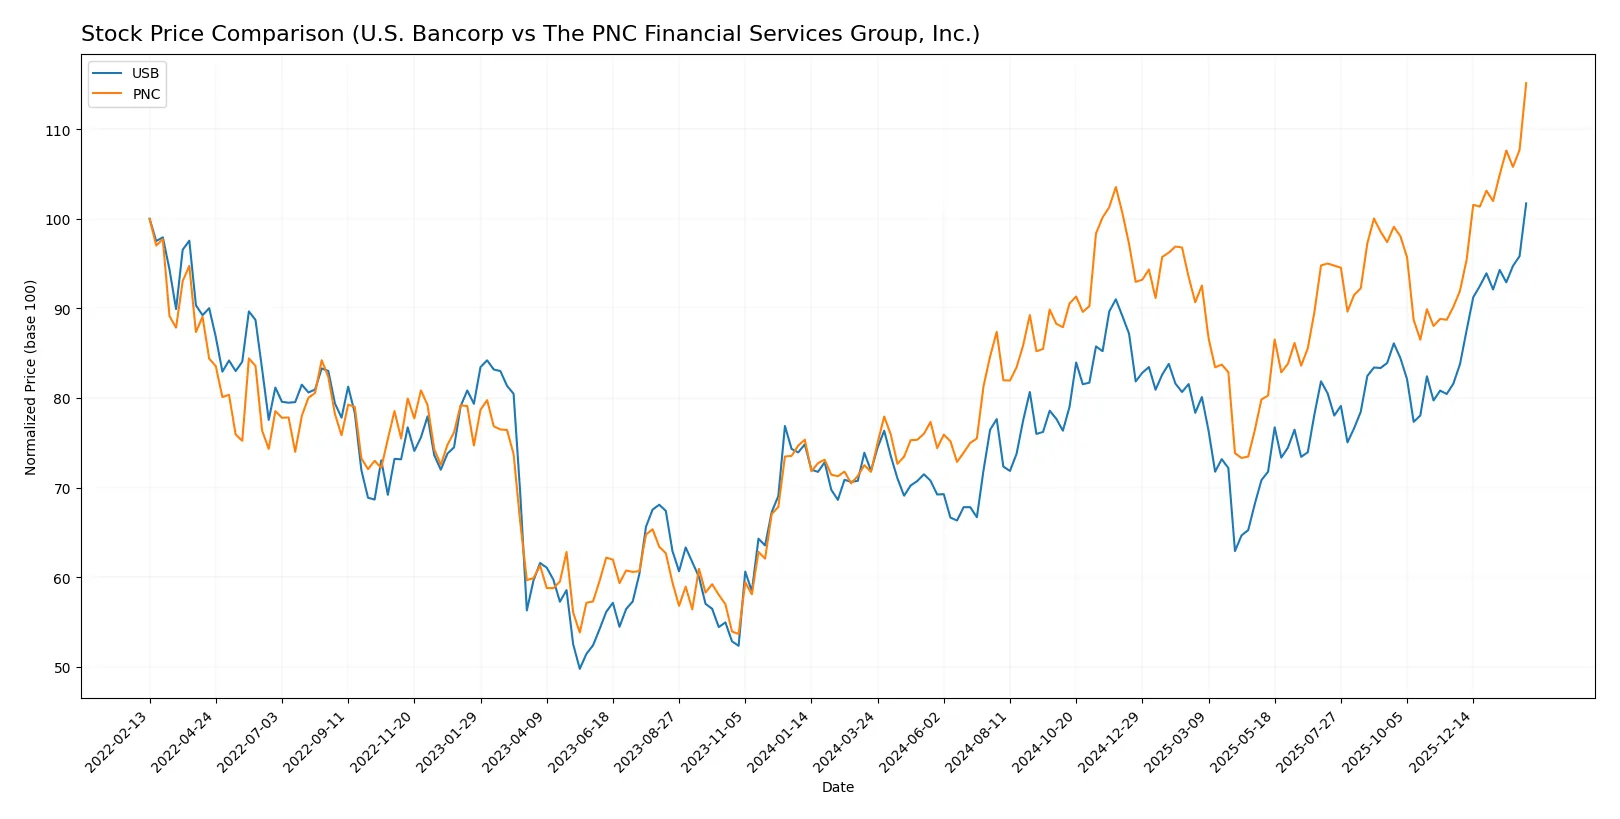
Trend Comparison
U.S. Bancorp’s stock rose 41.54% over the last year, showing a bullish trend with accelerating momentum and a price range between 36.83 and 59.56.
The PNC Financial Services Group’s shares gained 60.49%, also bullish with acceleration, but exhibited higher volatility and a wider price range of 148.78 to 238.77.
PNC delivered the highest market performance, outperforming USB by nearly 19 percentage points during the analyzed 12-month period.
Target Prices
Analysts present a clear consensus on target prices for U.S. Bancorp and The PNC Financial Services Group, Inc.
| Company | Target Low | Target High | Consensus |
|---|---|---|---|
| U.S. Bancorp | 52 | 65 | 58.96 |
| The PNC Financial Services Group, Inc. | 206 | 284 | 242.5 |
The consensus target for U.S. Bancorp sits slightly below its current price of 59.4, suggesting modest upside risk. PNC’s target consensus exceeds its 237.8 stock price, indicating potential for appreciation in the near term.

Don’t Let Luck Decide Your Entry Point
Optimize your entry points with our advanced ProRealTime indicators. You’ll get efficient buy signals with precise price targets for maximum performance. Start outperforming now!
How do institutions grade them?
U.S. Bancorp Grades
The following table shows recent grades from reputable institutions for U.S. Bancorp:
| Grading Company | Action | New Grade | Date |
|---|---|---|---|
| Argus Research | Maintain | Buy | 2026-01-22 |
| RBC Capital | Maintain | Outperform | 2026-01-21 |
| Keefe, Bruyette & Woods | Maintain | Market Perform | 2026-01-21 |
| DA Davidson | Maintain | Buy | 2026-01-21 |
| Truist Securities | Maintain | Hold | 2026-01-21 |
| TD Cowen | Maintain | Buy | 2026-01-21 |
| Oppenheimer | Maintain | Outperform | 2026-01-21 |
| TD Cowen | Maintain | Buy | 2026-01-07 |
| Wolfe Research | Downgrade | Peer Perform | 2026-01-07 |
| Barclays | Maintain | Overweight | 2026-01-05 |
The PNC Financial Services Group, Inc. Grades
The following table shows recent grades from reputable institutions for The PNC Financial Services Group, Inc.:
| Grading Company | Action | New Grade | Date |
|---|---|---|---|
| RBC Capital | Maintain | Outperform | 2026-01-20 |
| TD Cowen | Maintain | Buy | 2026-01-20 |
| Wells Fargo | Maintain | Overweight | 2026-01-20 |
| Morgan Stanley | Maintain | Underweight | 2026-01-20 |
| Keefe, Bruyette & Woods | Maintain | Market Perform | 2026-01-20 |
| Oppenheimer | Maintain | Outperform | 2026-01-20 |
| TD Cowen | Maintain | Buy | 2026-01-07 |
| Barclays | Maintain | Overweight | 2026-01-05 |
| Truist Securities | Maintain | Hold | 2025-12-18 |
| Keefe, Bruyette & Woods | Maintain | Market Perform | 2025-12-17 |
Which company has the best grades?
U.S. Bancorp and PNC both receive mostly positive grades like Buy and Outperform. U.S. Bancorp has a slight downgrade from Wolfe Research, while PNC faces an Underweight rating from Morgan Stanley. Overall, grades suggest similar market confidence with nuanced risk perceptions.
Risks specific to each company
The following categories identify the critical pressure points and systemic threats facing both firms in the 2026 market environment:
1. Market & Competition
U.S. Bancorp
- Faces intense regional banking competition with steady but moderate net margin performance.
The PNC Financial Services Group, Inc.
- Operates a larger branch and ATM network but contends with slightly higher market volatility.
2. Capital Structure & Debt
U.S. Bancorp
- Debt-to-equity ratio at 1.2 signals heavier leverage, posing moderate financial risk.
The PNC Financial Services Group, Inc.
- Lower debt-to-equity at 0.94 reflects a more conservative capital structure.
3. Stock Volatility
U.S. Bancorp
- Beta of 1.057 indicates volatility slightly above the market average.
The PNC Financial Services Group, Inc.
- Beta of 0.968 suggests relative stability versus the broader market.
4. Regulatory & Legal
U.S. Bancorp
- Operates under stringent regional banking regulations; risk of compliance costs remains.
The PNC Financial Services Group, Inc.
- Also faces regulatory scrutiny but benefits from diversified services reducing single-point legal risks.
5. Supply Chain & Operations
U.S. Bancorp
- Network of 2,230 banking offices may strain operational efficiency.
The PNC Financial Services Group, Inc.
- Larger footprint with 2,591 branches could expose to higher operational complexity.
6. ESG & Climate Transition
U.S. Bancorp
- ESG risks are moderate; no data suggests aggressive climate transition investments.
The PNC Financial Services Group, Inc.
- Slightly more diversified portfolio may provide better resilience to ESG-related disruptions.
7. Geopolitical Exposure
U.S. Bancorp
- Primarily U.S.-focused, limiting exposure to global geopolitical risks.
The PNC Financial Services Group, Inc.
- Similar U.S.-centric focus, but larger institutional banking segment could increase indirect exposure.
Which company shows a better risk-adjusted profile?
U.S. Bancorp’s most impactful risk is its elevated leverage, indicated by a debt-to-equity ratio of 1.2 and low interest coverage. PNC’s key concern lies in operational complexity from its larger branch network and slightly lower liquidity ratios. Despite this, PNC’s lower leverage and stronger Piotroski score suggest a more balanced, risk-adjusted profile. The recent data point of USB’s Altman Z-Score deep in the distress zone demands cautious scrutiny, while PNC’s stronger financial health metrics provide a safer investment stance.
Final Verdict: Which stock to choose?
U.S. Bancorp’s superpower lies in its robust liquidity and efficiency, reflected in a strong current ratio and solid dividend yield. However, its value creation is hindered by a ROIC slightly below its WACC, signaling a point of vigilance. This stock suits portfolios targeting steady income with moderate growth ambitions.
The PNC Financial Services Group boasts a strategic moat through its higher net margin and consistent profitability growth, supported by a solid recurring revenue model. While it exhibits a slightly weaker liquidity profile than U.S. Bancorp, it offers better stability for risk-conscious investors. PNC fits well within GARP portfolios balancing growth and valuation.
If you prioritize liquidity and income generation, U.S. Bancorp is the compelling choice due to its operational efficiency and dividend strength. However, if you seek growth coupled with strategic profitability, PNC outshines by delivering superior margin expansion and a stronger earnings trajectory. Both face value creation challenges, so careful risk assessment is essential.
Disclaimer: Investment carries a risk of loss of initial capital. The past performance is not a reliable indicator of future results. Be sure to understand risks before making an investment decision.
Go Further
I encourage you to read the complete analyses of U.S. Bancorp and The PNC Financial Services Group, Inc. to enhance your investment decisions: