Home > Comparison > Financial Services > PNC vs TFC
The strategic rivalry between The PNC Financial Services Group, Inc. and Truist Financial Corporation shapes the regional banking landscape in the U.S. PNC operates as a diversified financial services powerhouse with a broad national footprint. Truist focuses on targeted banking and insurance services primarily across the Southeast and Mid-Atlantic regions. This analysis examines which company’s business model and growth strategy deliver superior risk-adjusted returns for a diversified portfolio in today’s evolving financial sector.
Table of contents
Companies Overview
The PNC Financial Services Group and Truist Financial Corporation anchor the US regional banking landscape with substantial market influence.
The PNC Financial Services Group, Inc.: Diverse Financial Services Leader
PNC dominates as a diversified financial services company focused on retail, corporate, and asset management segments. It generates revenue through a broad array of banking products including mortgages, loans, brokerage, and wealth management. In 2026, PNC emphasizes expanding digital banking channels alongside strengthening its corporate and institutional banking offerings.
Truist Financial Corporation: Southeastern Banking Powerhouse
Truist stands as a regional bank holding company serving the Southeastern and Mid-Atlantic US markets. Its revenue stems from deposit products, consumer and commercial lending, insurance, and wealth management services. The company prioritizes integrated banking and insurance solutions, targeting growth via enhanced mobile platforms and diversified financial products in 2026.
Strategic Collision: Similarities & Divergences
Both banks operate regional models but diverge in strategic focus: PNC pursues a broad service mix with strong institutional banking, while Truist leverages an insurance-banking hybrid. Their primary battleground is expanding customer reach through digital innovation and wealth management. Investment profiles split between PNC’s diversified scale and Truist’s concentrated regional presence with insurance integration.
Income Statement Comparison
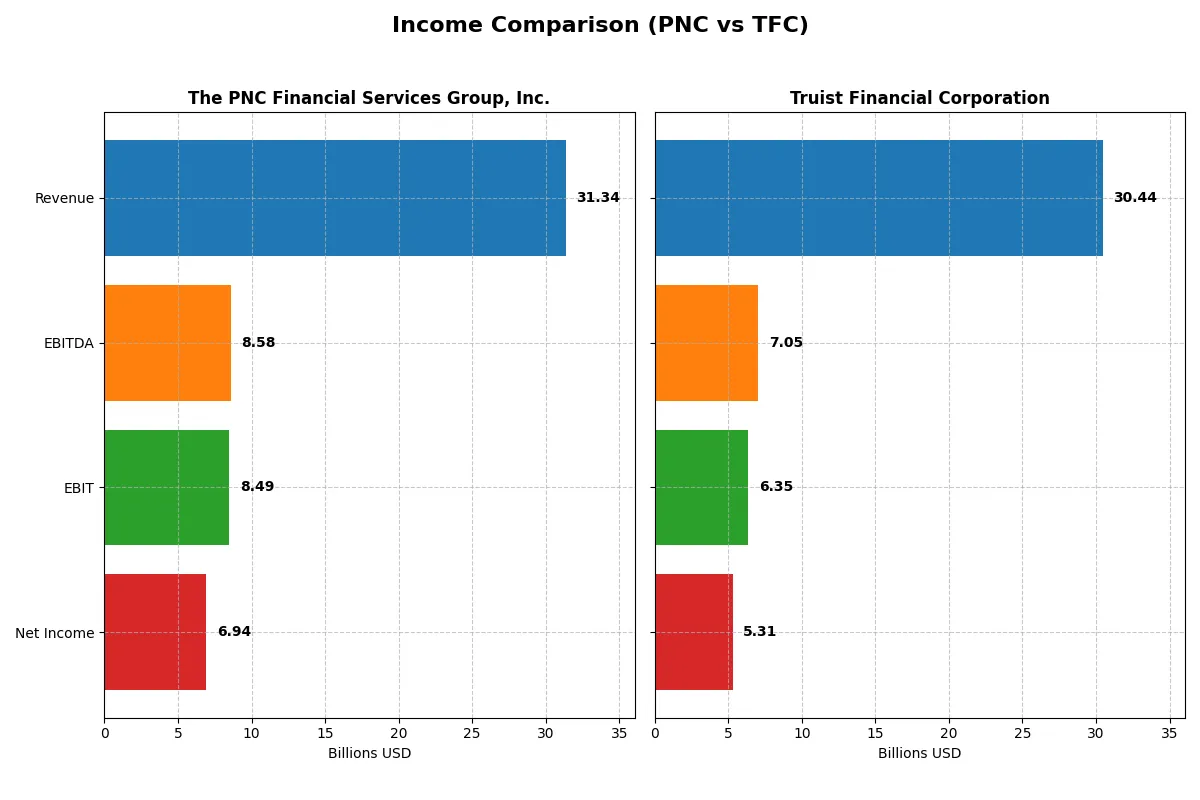
This data dissects the core profitability and scalability of both corporate engines to reveal who dominates the bottom line:
| Metric | The PNC Financial Services Group, Inc. (PNC) | Truist Financial Corporation (TFC) |
|---|---|---|
| Revenue | 31.3B | 30.4B |
| Cost of Revenue | 8.9B | 11.5B |
| Operating Expenses | 13.97B | 12.59B |
| Gross Profit | 22.5B | 18.9B |
| EBITDA | 8.58B | 7.05B |
| EBIT | 8.49B | 6.35B |
| Interest Expense | 10.9B | 10.1B |
| Net Income | 6.94B | 5.31B |
| EPS | 16.62 | 3.86 |
| Fiscal Year | 2025 | 2025 |
Income Statement Analysis: The Bottom-Line Duel
This income statement comparison reveals which company operates with greater efficiency and profitability in a competitive financial sector.
The PNC Financial Services Group, Inc. Analysis
PNC’s revenue grew from 20B in 2021 to a peak of 33.7B in 2024 before slipping to 31.3B in 2025. Net income steadily increased, reaching 6.9B in 2025. The firm maintains strong gross margins at 71.7% and net margins at 22.1%. In 2025, PNC’s operational efficiency improved, with a 17% rise in EBIT and 21% jump in EPS, signaling solid momentum.
Truist Financial Corporation Analysis
Truist posted revenue growth from 23B in 2021 to 30.4B in 2025, with a notable 25.5% increase in the last year. However, net income declined overall, standing at 5.3B in 2025 after a loss in 2023. Gross margin remains healthy at 62.2%, though net margin slipped to 17.4%. The latest year showed a remarkable 1156% EBIT surge, reflecting a rebound from prior losses but with net margin pressure.
Margin Strength vs. Growth Volatility
PNC delivers a more consistent profitability profile, with higher margins and steady earnings growth, despite a slight revenue dip. Truist shows higher recent revenue growth and a sharp EBIT recovery but struggles with net income volatility and margin contraction. PNC’s stable profit margins make it more attractive for risk-conscious investors seeking dependable earnings quality.
Financial Ratios Comparison
These vital ratios act as a diagnostic tool to expose the underlying fiscal health, valuation premiums, and capital efficiency of these two financial institutions:
| Ratios | The PNC Financial Services Group, Inc. (PNC) | Truist Financial Corporation (TFC) |
|---|---|---|
| ROE | 11.4% | 8.1% |
| ROIC | 7.6% | 3.6% |
| P/E | 11.9x | 11.8x |
| P/B | 1.36x | 0.96x |
| Current Ratio | 0.81 | 0.87 |
| Quick Ratio | 0.81 | 0.87 |
| D/E | 0.94 | 1.07 |
| Debt-to-Assets | 9.96% | 12.7% |
| Interest Coverage | 0.78x | 0.63x |
| Asset Turnover | 0.055 | 0.056 |
| Fixed Asset Turnover | 0.0 | 9.6 |
| Payout Ratio | 37.5% | 49.7% |
| Dividend Yield | 3.16% | 4.23% |
| Fiscal Year | 2025 | 2025 |
Efficiency & Valuation Duel: The Vital Signs
Financial ratios act as a company’s DNA, exposing underlying risks and operational strengths hidden within the numbers.
The PNC Financial Services Group, Inc.
PNC demonstrates solid profitability with an 11.45% ROE and a strong 22.13% net margin, signaling operational efficiency. Its valuation appears reasonable, with a favorable P/E of 11.86 and P/B of 1.36. The 3.16% dividend yield rewards shareholders, balancing returns with reinvestment in growth and stability.
Truist Financial Corporation
Truist posts a lower ROE of 8.14% and a 17.44% net margin, reflecting moderate profitability. Its valuation remains attractive, with a P/E of 11.75 and a P/B below 1 at 0.96, indicating a potentially undervalued stock. A higher 4.23% dividend yield highlights a strong commitment to shareholder returns despite some operational softness.
Balanced Profitability vs. Dividend Yield Showdown
PNC offers a better blend of profitability and valuation discipline, while Truist provides a higher dividend yield with slightly weaker returns. Investors seeking stable operational efficiency might lean toward PNC; those favoring income could find Truist’s profile more suitable.
Which one offers the Superior Shareholder Reward?
I compare The PNC Financial Services Group, Inc. (PNC) and Truist Financial Corporation (TFC) based on dividends and buybacks. PNC yields 3.16% with a 37% payout ratio, balancing dividends and buybacks sustainably. TFC yields higher at 4.23% but pays out nearly 50% of earnings. PNC’s buyback program is more consistent, enhancing total return over time. TFC’s higher yield comes with elevated payout risk and weaker coverage ratios. I conclude PNC offers a superior, more sustainable shareholder reward in 2026.
Comparative Score Analysis: The Strategic Profile
The radar chart reveals the fundamental DNA and trade-offs of The PNC Financial Services Group, Inc. and Truist Financial Corporation:
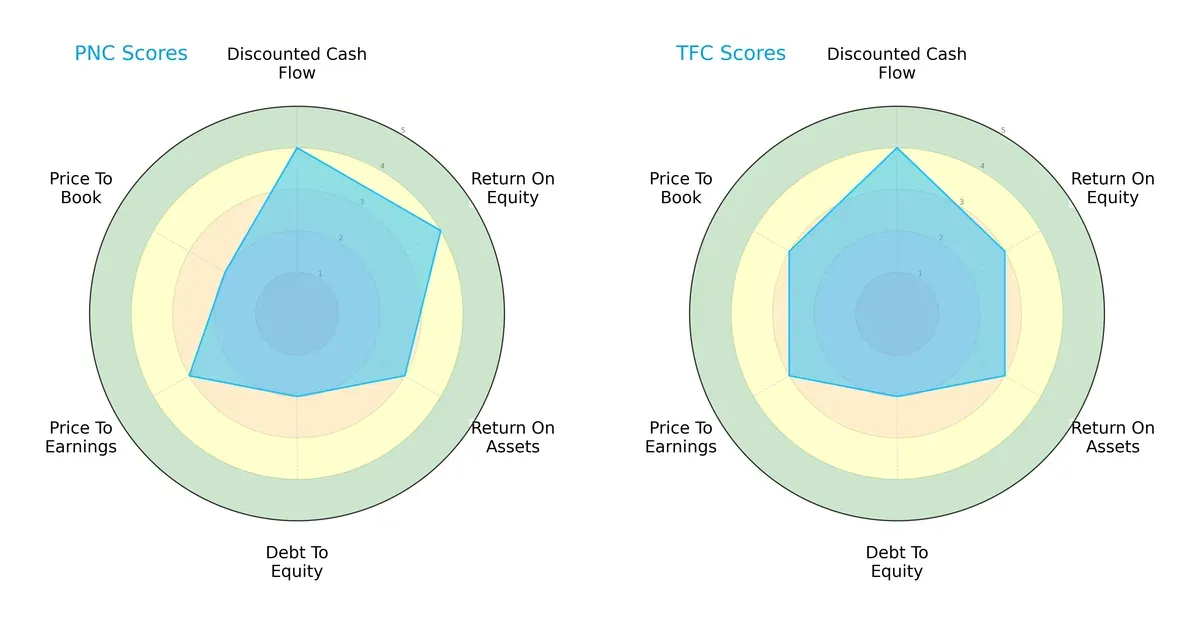
PNC demonstrates a stronger return on equity and slightly better discounted cash flow metrics than Truist. Both firms score equally on return on assets and debt-to-equity, indicating similar asset efficiency and leverage profiles. Truist edges PNC on price-to-book valuation, suggesting a marginally more attractive market price relative to book value. Overall, PNC shows a more balanced profile with higher profitability scores, while Truist relies more on valuation appeal.
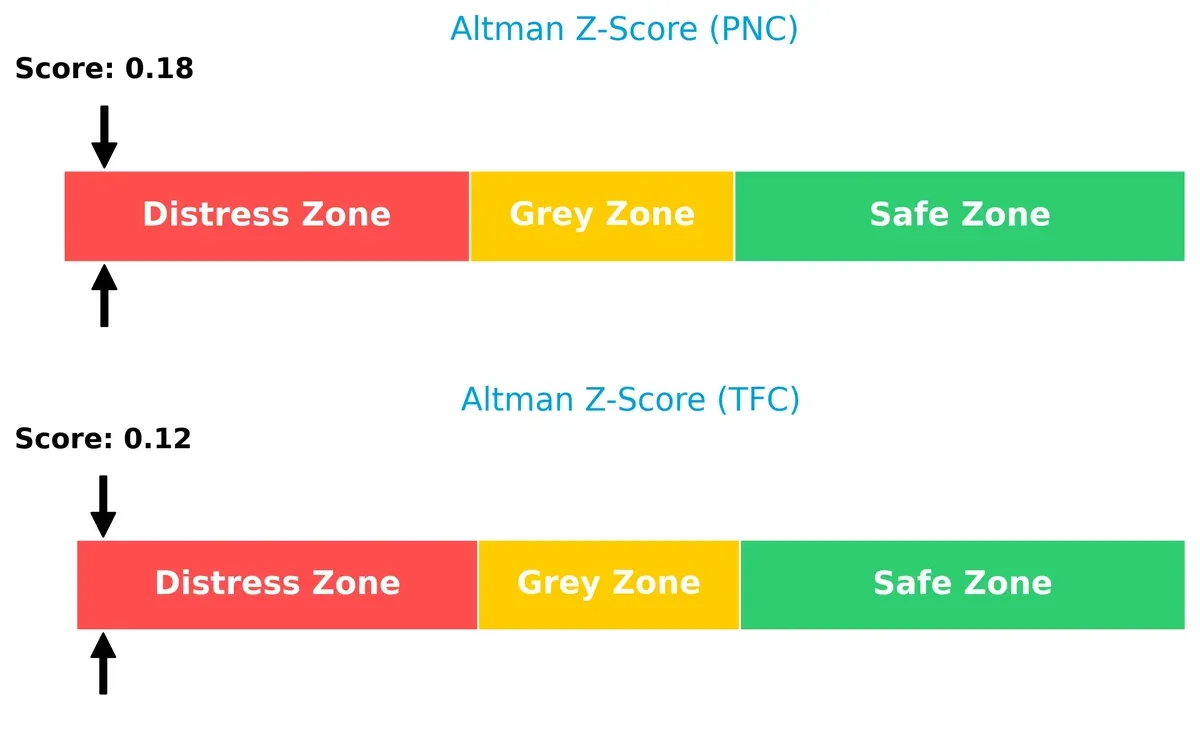
Bankruptcy Risk: Solvency Showdown
The Altman Z-Scores place both PNC and Truist firmly in the distress zone, signaling elevated bankruptcy risk and financial instability in the current market cycle:
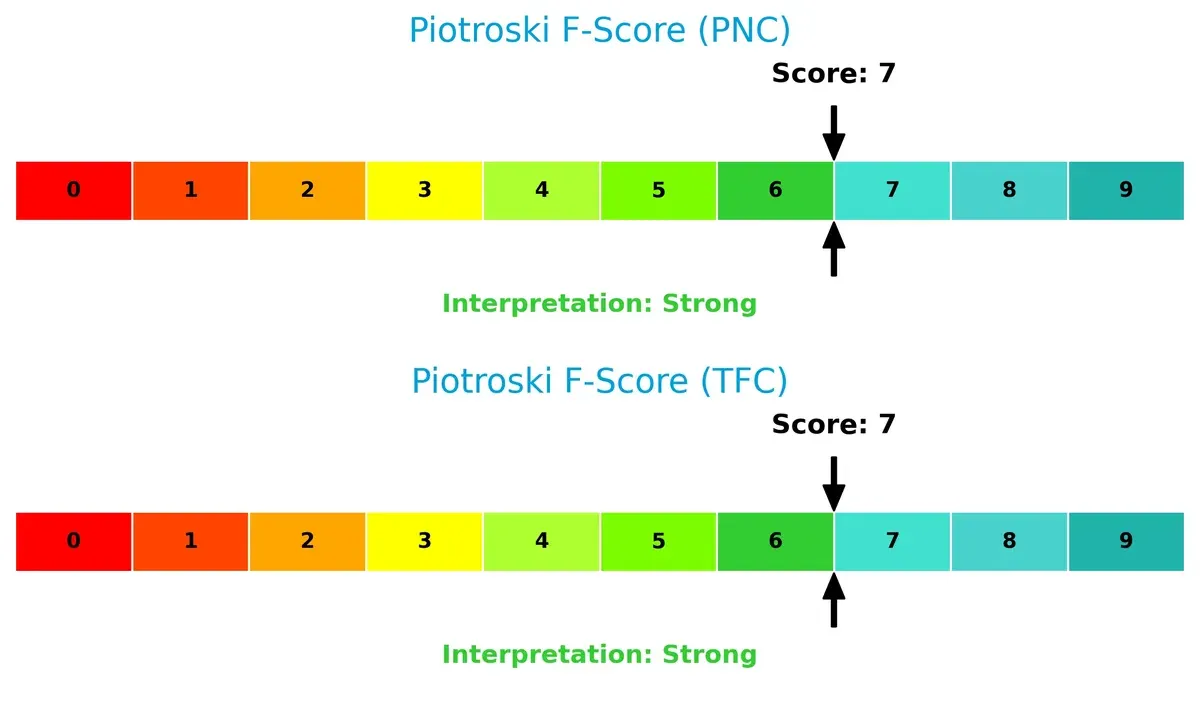
Financial Health: Quality of Operations
Both PNC and Truist score a robust 7 on the Piotroski F-Score, reflecting strong financial health and operational quality with no immediate red flags in their internal metrics:
How are the two companies positioned?
This section dissects the operational DNA of PNC and TFC by comparing their revenue distribution by segment alongside their strengths and weaknesses. The final aim is to confront their economic moats to identify which business model offers the most resilient and sustainable competitive advantage today.
Revenue Segmentation: The Strategic Mix
The following visual comparison dissects how The PNC Financial Services Group and Truist Financial diversify their income streams and where their primary sector bets lie:
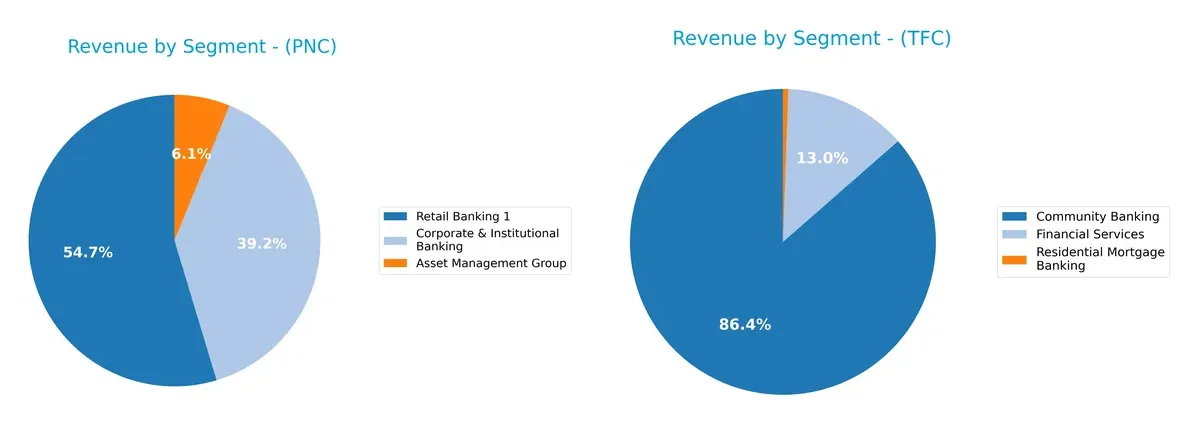
PNC dwarfs Truist with a broad mix anchored by Retail Banking at $12.9B and Corporate & Institutional Banking at $9.3B in 2023. Truist’s Community Banking revenue, capped around $180M in prior years, pales in comparison, signaling a concentrated and smaller scale. PNC’s diversified streams reduce concentration risk and support ecosystem lock-in, while Truist’s limited segment breadth and negative “Other, Treasury & Corporate” figures reveal structural challenges and reliance on fewer income sources.
Strengths and Weaknesses Comparison
This table compares the Strengths and Weaknesses of PNC and TFC based on diversification, profitability, financial statement, innovation, global presence, and market share:
PNC Strengths
- Strong net margin at 22.13%
- Favorable PE at 11.86
- Favorable PB at 1.36
- Low debt to assets at 9.96%
- Consistent revenue growth in multiple banking segments
TFC Strengths
- Favorable net margin at 17.44%
- Favorable PE at 11.75
- Favorable PB at 0.96
- Strong fixed asset turnover at 9.6
- Higher dividend yield at 4.23%
PNC Weaknesses
- Unfavorable WACC at 11.11% vs ROIC 7.65%
- Low current ratio at 0.81
- Weak interest coverage at 0.78
- Low asset turnover at 0.05
- Neutral ROE at 11.45%
TFC Weaknesses
- Unfavorable ROE at 8.14% and ROIC at 3.61%
- Unfavorable debt to equity at 1.07
- Low current ratio at 0.87
- Weak interest coverage at 0.63
- Higher unfavorable ratios percentage
Both firms show solid profitability but face liquidity and efficiency challenges. PNC’s stronger asset control contrasts with TFC’s higher operational turnover, influencing their strategic flexibility.
The Moat Duel: Analyzing Competitive Defensibility
A structural moat shields long-term profits from relentless competition and market pressure. Without it, gains erode quickly. Let’s examine how these banks defend their turf:
The PNC Financial Services Group, Inc.: Growing Profitability Despite Value Challenges
PNC’s moat stems from intangible assets and scale, reflected in stable margins and a growing ROIC trend despite negative spread to WACC. New products and digital expansion could deepen this advantage in 2026.
Truist Financial Corporation: Struggling Value Creation Amidst Regional Footprint
Truist relies on regional scale and diversified services but shows a declining ROIC trend and below-cost capital returns. Its recent strong revenue growth offers opportunities, yet profitability erosion threatens moat sustainability.
Economic Moat Standoff: Intangible Assets Growth vs. Regional Scale Compression
PNC exhibits a slightly unfavorable moat but improves profitability, while Truist faces a very unfavorable moat with declining returns. PNC’s deeper moat positions it better to defend and grow market share in 2026.
Which stock offers better returns?
Over the past year, both stocks showed strong upward momentum, with notable acceleration in price gains and dominant buyer activity shaping trading dynamics.
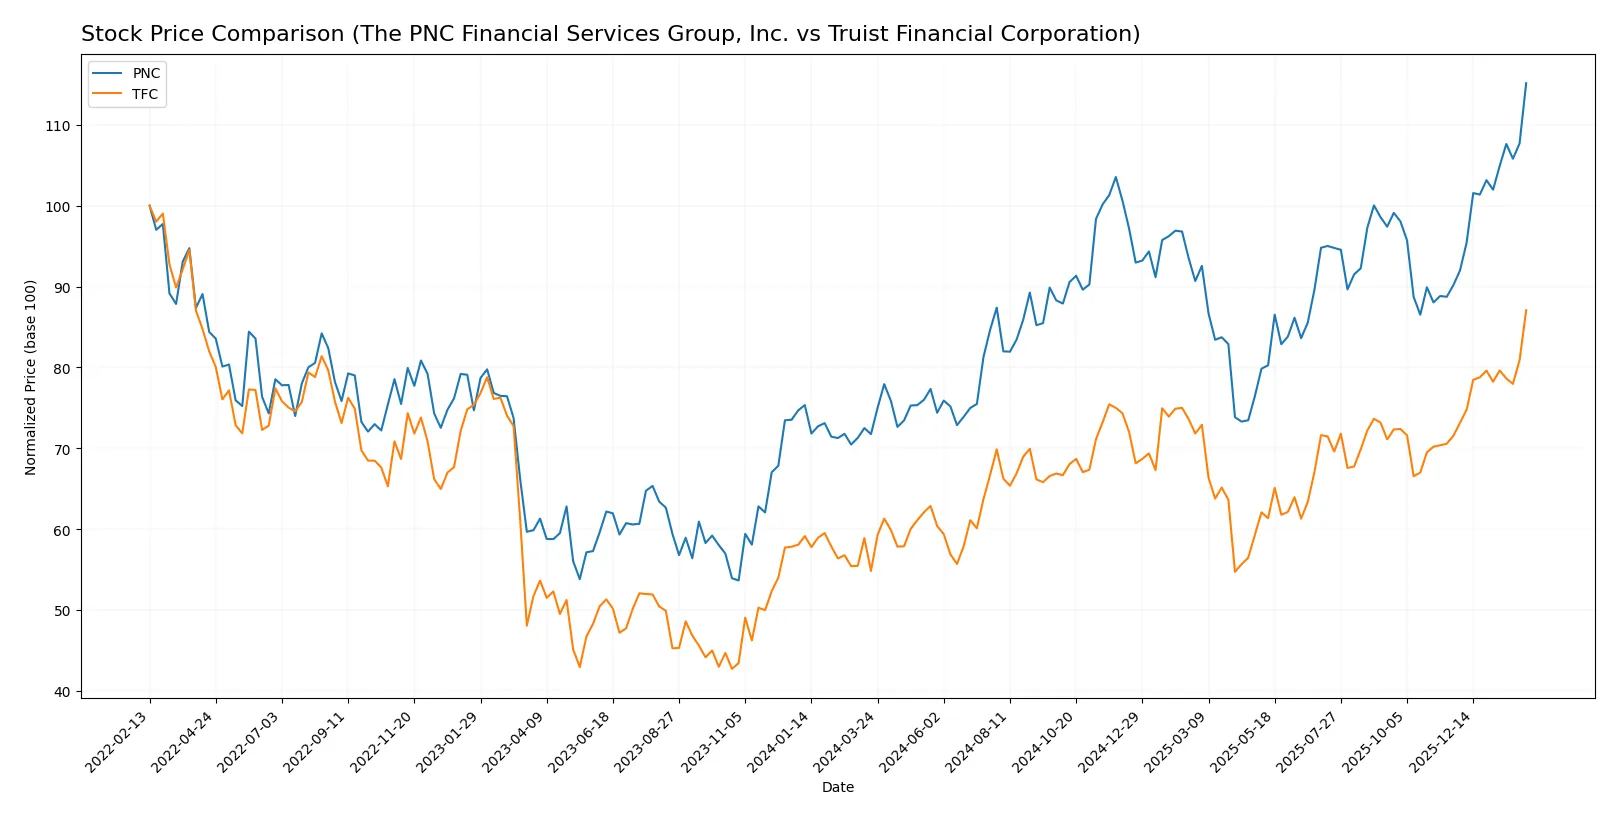
Trend Comparison
The PNC Financial Services Group, Inc. stock rose 60.49% over the past year, showing a bullish trend with accelerating gains and a high volatility of 20.13%. It peaked at 238.77 and bottomed at 148.78.
Truist Financial Corporation stock increased 58.81% over the same period, also bullish with accelerating momentum. Its volatility was significantly lower at 4.18%, with prices ranging from 34.79 to 55.36.
PNC slightly outperformed TFC with a higher price increase and volatility, indicating stronger market performance but with more pronounced price swings.
Target Prices
Analysts present a moderate upside for both PNC and Truist Financial, reflecting cautious optimism in regional banking.
| Company | Target Low | Target High | Consensus |
|---|---|---|---|
| The PNC Financial Services Group, Inc. | 206 | 284 | 242.5 |
| Truist Financial Corporation | 50 | 58 | 54.38 |
The consensus target for PNC stands slightly above the current price of 238.11, suggesting modest growth potential. Truist’s consensus target of 54.38 lies just below its current price of 55.27, indicating limited upside or possible near-term volatility.

Don’t Let Luck Decide Your Entry Point
Optimize your entry points with our advanced ProRealTime indicators. You’ll get efficient buy signals with precise price targets for maximum performance. Start outperforming now!
How do institutions grade them?
Here is a summary of recent institutional grades for The PNC Financial Services Group, Inc. and Truist Financial Corporation:
The PNC Financial Services Group, Inc. Grades
The following table shows recent grades assigned by reputable grading companies for PNC:
| Grading Company | Action | New Grade | Date |
|---|---|---|---|
| RBC Capital | Maintain | Outperform | 2026-01-20 |
| TD Cowen | Maintain | Buy | 2026-01-20 |
| Wells Fargo | Maintain | Overweight | 2026-01-20 |
| Morgan Stanley | Maintain | Underweight | 2026-01-20 |
| Keefe, Bruyette & Woods | Maintain | Market Perform | 2026-01-20 |
| Oppenheimer | Maintain | Outperform | 2026-01-20 |
| TD Cowen | Maintain | Buy | 2026-01-07 |
| Barclays | Maintain | Overweight | 2026-01-05 |
| Truist Securities | Maintain | Hold | 2025-12-18 |
| Keefe, Bruyette & Woods | Maintain | Market Perform | 2025-12-17 |
Truist Financial Corporation Grades
The following table presents recent grades assigned by established grading firms for Truist:
| Grading Company | Action | New Grade | Date |
|---|---|---|---|
| Argus Research | Maintain | Buy | 2026-01-23 |
| Piper Sandler | Maintain | Neutral | 2026-01-22 |
| TD Cowen | Maintain | Buy | 2026-01-22 |
| Raymond James | Maintain | Outperform | 2026-01-07 |
| TD Cowen | Maintain | Buy | 2026-01-07 |
| Evercore ISI Group | Upgrade | Outperform | 2026-01-06 |
| Barclays | Downgrade | Underweight | 2026-01-05 |
| Citigroup | Maintain | Buy | 2025-12-31 |
| Keefe, Bruyette & Woods | Maintain | Market Perform | 2025-12-17 |
| Morgan Stanley | Maintain | Equal Weight | 2025-12-17 |
Which company has the best grades?
PNC generally receives stronger consensus grades, including multiple “Outperform” and “Buy” ratings with few downgrades. Truist shows a mixed picture, with several “Buy” and “Outperform” grades but also a recent downgrade to “Underweight” by Barclays. Investors may view PNC’s steadier positive sentiment as a sign of more consistent institutional confidence.
Risks specific to each company
The following categories identify the critical pressure points and systemic threats facing both firms in the 2026 market environment:
1. Market & Competition
The PNC Financial Services Group, Inc.
- Faces intense regional banking competition with a strong retail and corporate focus.
Truist Financial Corporation
- Competes in Southeastern and Mid-Atlantic markets with diversified banking and insurance offerings.
2. Capital Structure & Debt
The PNC Financial Services Group, Inc.
- Debt-to-equity ratio is moderate at 0.94, with interest coverage weak at 0.78, signaling caution on debt servicing.
Truist Financial Corporation
- Higher debt-to-equity at 1.07 and lower interest coverage of 0.63 raise concerns on financial leverage risks.
3. Stock Volatility
The PNC Financial Services Group, Inc.
- Beta near 0.97 indicates market volatility in line with the overall financial sector.
Truist Financial Corporation
- Lower beta of 0.86 suggests slightly reduced volatility and less sensitivity to market swings.
4. Regulatory & Legal
The PNC Financial Services Group, Inc.
- Subject to standard US banking regulations; no recent regulatory issues reported.
Truist Financial Corporation
- Similarly regulated, with no publicized legal risks but must manage compliance in insurance and banking sectors.
5. Supply Chain & Operations
The PNC Financial Services Group, Inc.
- Operates 2,591 branches and 9,502 ATMs, exposing it to operational risks in physical and digital infrastructure.
Truist Financial Corporation
- Runs 2,517 banking offices; operational complexity increased by insurance and capital market services.
6. ESG & Climate Transition
The PNC Financial Services Group, Inc.
- ESG risks not explicitly detailed; exposure to climate transition risks inherent in lending portfolios.
Truist Financial Corporation
- Faces similar ESG challenges; insurance segment adds complexity to climate-related underwriting risks.
7. Geopolitical Exposure
The PNC Financial Services Group, Inc.
- Primarily US-focused, limiting direct geopolitical risk but vulnerable to domestic economic shifts.
Truist Financial Corporation
- Also US-centric with regional economic dependencies; geopolitical risks remain moderate and indirect.
Which company shows a better risk-adjusted profile?
PNC’s primary risk lies in its strained interest coverage amid moderate debt, while Truist’s greater leverage and weaker interest coverage heighten financial risk. Both firms share distress-level Altman Z-scores, but Truist’s higher operational complexity and debt weigh heavier. I see PNC as having a marginally better risk-adjusted profile, supported by its stronger net margin and slightly better interest coverage. The persistently low interest coverage ratios for both warn investors to tread carefully amid tightening credit conditions.
Final Verdict: Which stock to choose?
PNC’s superpower lies in its improving profitability amid a challenging environment. It steadily grows returns on capital, signaling operational resilience. However, its weak liquidity ratio remains a point of vigilance. This stock suits investors targeting aggressive growth with a tolerance for cyclical risks.
Truist Financial’s moat is its solid asset base coupled with a more conservative leverage profile. It offers a safer income stream with a higher dividend yield, appealing to more risk-averse investors. Its slower ROIC decline suggests better stability, fitting a GARP strategy focused on value and steady growth.
If you prioritize operational momentum and growth potential, PNC outshines due to its rising profitability and market traction. However, if you seek better stability and income reliability, Truist offers a more defensive profile despite its value erosion. Each scenario fits distinct investor appetites amid financial sector volatility.
Disclaimer: Investment carries a risk of loss of initial capital. The past performance is not a reliable indicator of future results. Be sure to understand risks before making an investment decision.
Go Further
I encourage you to read the complete analyses of The PNC Financial Services Group, Inc. and Truist Financial Corporation to enhance your investment decisions: