The Kraft Heinz Company (KHC) and The J. M. Smucker Company (SJM) are two major players in the packaged foods industry, each with a rich history and strong market presence. Both companies compete in overlapping segments, from condiments to snacks, and pursue innovation to capture evolving consumer tastes. In this analysis, I will compare their strategies and financial health to help you decide which stock deserves a place in your investment portfolio.
Table of contents
Companies Overview
I will begin the comparison between The Kraft Heinz Company and The J. M. Smucker Company by providing an overview of these two companies and their main differences.
The Kraft Heinz Company Overview
The Kraft Heinz Company is a major player in the packaged foods industry, manufacturing and marketing a wide range of food and beverage products across the US, Canada, the UK, and internationally. Its product portfolio includes condiments, cheese, meals, meats, coffee, and snacks. Founded in 1869 and headquartered in Pittsburgh, PA, Kraft Heinz distributes through various retail channels and foodservice institutions, employing around 36K people.
The J. M. Smucker Company Overview
The J. M. Smucker Company operates globally in the packaged foods sector, focusing on three segments: U.S. Retail Pet Foods, Coffee, and Consumer Foods. Its branded products include coffee, peanut butter, pet foods, fruit spreads, and snacks. Headquartered in Orrville, OH, with 9K employees, Smucker sells through direct and broker channels to diverse retail outlets including club stores, specialty stores, and online platforms. The company was founded in 1897.
Key similarities and differences
Both companies operate in the consumer defensive sector, specializing in branded packaged foods with broad product lines and multi-channel distribution strategies. Kraft Heinz has a larger workforce and broader geographic footprint, while Smucker focuses more on segmented markets such as pet foods and coffee. Kraft Heinz’s market cap is significantly higher than Smucker’s, reflecting differences in scale and market presence.
Income Statement Comparison
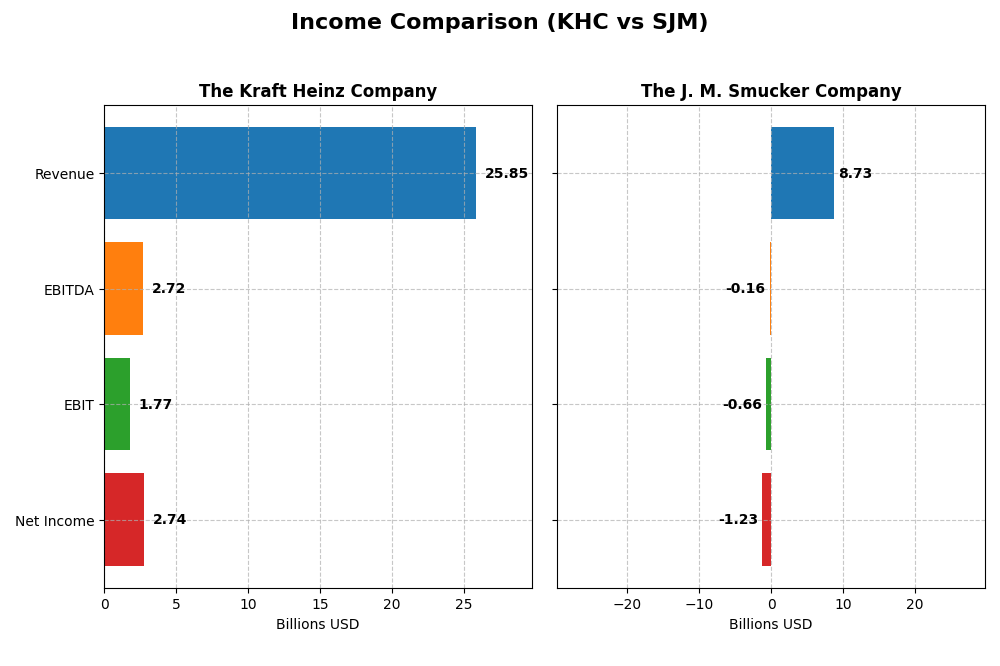
This table summarizes the key income statement metrics for The Kraft Heinz Company and The J. M. Smucker Company for their most recent fiscal years, providing a clear view of each company’s financial performance.
| Metric | The Kraft Heinz Company (KHC) | The J. M. Smucker Company (SJM) |
|---|---|---|
| Market Cap | 27.7B | 10.7B |
| Revenue | 25.8B | 8.7B |
| EBITDA | 2.72B | -156M |
| EBIT | 1.77B | -658M |
| Net Income | 2.74B | -1.23B |
| EPS | 2.27 | -11.57 |
| Fiscal Year | 2024 | 2025 |
Income Statement Interpretations
The Kraft Heinz Company
From 2020 to 2024, Kraft Heinz experienced a slight revenue decline of -1.29%, while net income grew substantially by 671%. The gross margin remained favorable at 34.7%, with net margin at a positive 10.62%. However, in 2024, revenue decreased by nearly 3%, EBIT dropped significantly by 61%, and net margin slightly contracted, indicating recent pressure on profitability despite stable margins overall.
The J. M. Smucker Company
Smucker’s revenue showed a favorable 9% growth over 2021-2025 but net income deteriorated sharply by -240%. The gross margin was strong at 38.8%, but EBIT and net margin were negative at -7.5% and -14.1%, respectively. The latest year reflected a 6.7% revenue increase but steep declines in EBIT (-152%) and net margin growth, signaling worsening profitability despite top-line gains.
Which one has the stronger fundamentals?
Kraft Heinz displays stronger fundamentals with positive net income growth and favorable margins, despite a recent revenue dip and EBIT decline. Smucker’s revenue growth is overshadowed by consistent net income losses and negative EBIT margins, indicating weaker profitability. Overall, Kraft Heinz holds a more balanced income statement profile, while Smucker faces greater challenges in turning revenue gains into profits.
Financial Ratios Comparison
The following table presents the most recent financial ratios for The Kraft Heinz Company (KHC) and The J. M. Smucker Company (SJM), enabling a straightforward comparison of key performance indicators as of their latest fiscal years.
| Ratios | The Kraft Heinz Company (2024) | The J. M. Smucker Company (2025) |
|---|---|---|
| ROE | 5.58% | -20.23% |
| ROIC | 6.61% | -5.09% |
| P/E | 13.53 | -10.05 |
| P/B | 0.75 | 2.03 |
| Current Ratio | 1.06 | 0.81 |
| Quick Ratio | 0.59 | 0.35 |
| D/E (Debt-to-Equity) | 0.40 | 1.28 |
| Debt-to-Assets | 22.5% | 44.2% |
| Interest Coverage | 1.85 | -1.88 |
| Asset Turnover | 0.29 | 0.50 |
| Fixed Asset Turnover | 3.61 | 2.73 |
| Payout Ratio | 70.4% | -37.0% |
| Dividend Yield | 5.20% | 3.68% |
Interpretation of the Ratios
The Kraft Heinz Company
The Kraft Heinz Company shows a mixed ratio profile with 50% favorable and 28.57% unfavorable ratios, leading to a slightly favorable overall assessment. Strengths include a low price-to-book ratio (0.75) and a solid dividend yield at 5.2%. However, concerns arise from weak return on equity (5.58%) and interest coverage (1.94). The company pays dividends with a stable payout, supported by moderate free cash flow, though some risk exists in coverage sustainability.
The J. M. Smucker Company
The J. M. Smucker Company’s ratios lean unfavorable, with 57.14% of key metrics negative, including net margin (-14.1%) and return on equity (-20.23%). Their debt-to-equity ratio at 1.28 and negative interest coverage (-1.84) also raise concerns. Despite this, it maintains a favorable dividend yield of 3.68%, reflecting a commitment to shareholder returns amid challenging profitability and liquidity ratios.
Which one has the best ratios?
Between the two, The Kraft Heinz Company exhibits a generally stronger ratio profile, marked by more favorable profitability, leverage, and valuation metrics. The J. M. Smucker Company faces significant profitability and solvency challenges, reflecting in its predominantly unfavorable ratios. Thus, Kraft Heinz presents a relatively healthier financial position based on the analyzed ratios.
Strategic Positioning
This section compares the strategic positioning of The Kraft Heinz Company and The J. M. Smucker Company, including market position, key segments, and exposure to technological disruption:
The Kraft Heinz Company
- Large market cap of 27.7B with low beta, facing steady competitive pressure in packaged foods.
- Diverse product portfolio including condiments, cheese, meals, beverages, snacks, and more.
- No explicit data on technological disruption exposure provided.
The J. M. Smucker Company
- Smaller market cap of 10.7B with moderate beta, competing mainly in U.S. retail food segments.
- Concentrated in pet foods, coffee, consumer foods, and baked snacks in U.S. retail.
- No explicit data on technological disruption exposure provided.
The Kraft Heinz Company vs The J. M. Smucker Company Positioning
KHC presents a diversified product mix across many food categories, offering broad market reach. SJM focuses on fewer segments, mainly U.S. retail pet foods and coffee, which may limit growth but enhance specialization. Both operate in packaged foods but differ in scale and scope.
Which has the best competitive advantage?
KHC demonstrates a very favorable moat with growing ROIC above WACC, indicating durable competitive advantage. SJM shows a very unfavorable moat with declining ROIC below WACC, reflecting value destruction and weaker competitive positioning.
Stock Comparison
The stock prices of The Kraft Heinz Company and The J. M. Smucker Company have both exhibited bearish trends over the past 12 months, with notable declines and differing volatility patterns shaping their trading dynamics.
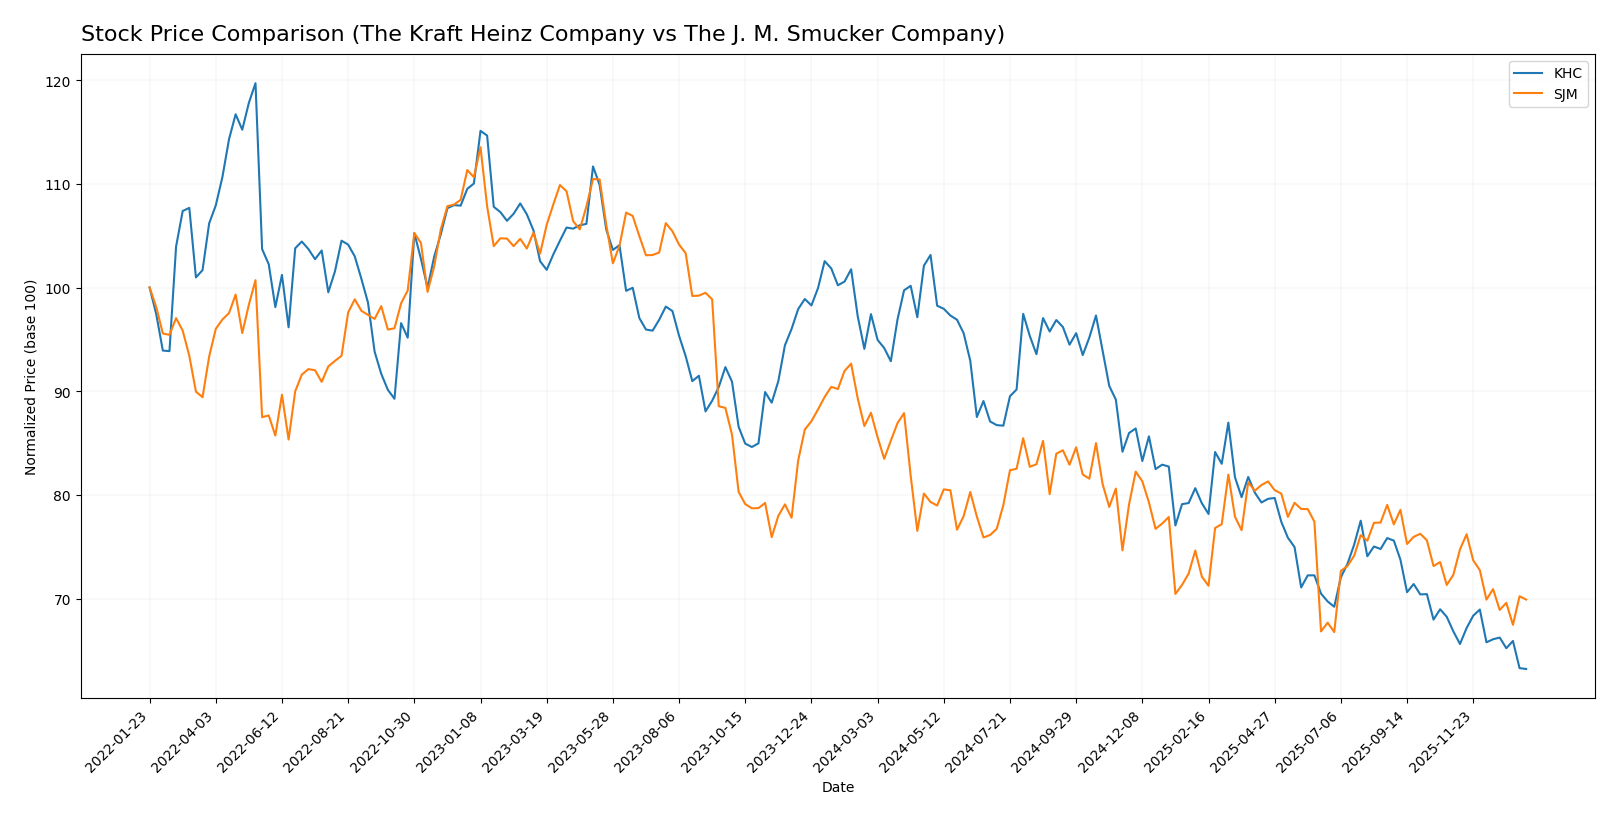
Trend Analysis
The Kraft Heinz Company’s stock price fell by 35.12% over the past year, showing an accelerating bearish trend with a standard deviation of 4.13, reaching a high of 38.16 and a low of 23.39.
The J. M. Smucker Company’s stock declined by 20.49% over the same period, displaying a decelerating bearish trend and higher volatility with a standard deviation of 6.98, peaking at 125.92 and bottoming at 95.63.
Comparing both, The Kraft Heinz Company experienced a sharper decline and a more pronounced acceleration in its downtrend, resulting in a weaker market performance than The J. M. Smucker Company.
Target Prices
Analysts present a clear target price consensus for The Kraft Heinz Company and The J. M. Smucker Company, reflecting moderate upside potential.
| Company | Target High | Target Low | Consensus |
|---|---|---|---|
| The Kraft Heinz Company | 28 | 24 | 26.29 |
| The J. M. Smucker Company | 117 | 110 | 113.4 |
The Kraft Heinz Company’s consensus target of 26.29 USD suggests roughly 12% upside from the current 23.39 USD price. The J. M. Smucker Company’s target consensus at 113.4 USD implies about 13% potential gain from its 100.12 USD price.
Analyst Opinions Comparison
This section compares analysts’ ratings and financial grades for The Kraft Heinz Company and The J. M. Smucker Company:
Rating Comparison
KHC Rating
- Rating: B-, considered Very Favorable overall rating.
- Discounted Cash Flow Score: 5, rated Very Favorable, indicating strong valuation.
- ROE Score: 1, Very Unfavorable, showing weak profitability from equity.
- ROA Score: 1, Very Unfavorable, indicating poor asset utilization.
- Debt To Equity Score: 3, Moderate risk level on financial leverage.
SJM Rating
- Rating: C+, also considered Very Favorable overall rating.
- Discounted Cash Flow Score: 5, rated Very Favorable, indicating strong valuation.
- ROE Score: 1, Very Unfavorable, showing weak profitability from equity.
- ROA Score: 1, Very Unfavorable, indicating poor asset utilization.
- Debt To Equity Score: 1, Very Unfavorable, indicating higher financial risk.
Which one is the best rated?
Based strictly on provided data, KHC holds a higher overall rating (B- vs. C+) and a better debt-to-equity score, while both share identical weak profitability scores. KHC is therefore slightly better rated overall.
Scores Comparison
Here is a comparison of the Altman Z-Score and Piotroski Score for the two companies:
KHC Scores
- Altman Z-Score: 0.44, indicating financial distress.
- Piotroski Score: 6, classified as average financial strength.
SJM Scores
- Altman Z-Score: 0.90, also indicating financial distress.
- Piotroski Score: 4, classified as average financial strength.
Which company has the best scores?
Both KHC and SJM are in the distress zone based on their Altman Z-Scores, with KHC scoring slightly lower. KHC has a higher Piotroski Score (6) compared to SJM (4), indicating relatively better financial strength by that measure.
Grades Comparison
Here is the comparison of recent reliable grades assigned to The Kraft Heinz Company and The J. M. Smucker Company:
The Kraft Heinz Company Grades
The following table summarizes recent grades from reputable financial institutions for Kraft Heinz:
| Grading Company | Action | New Grade | Date |
|---|---|---|---|
| Piper Sandler | Maintain | Neutral | 2025-12-15 |
| Barclays | Maintain | Equal Weight | 2025-10-31 |
| JP Morgan | Maintain | Neutral | 2025-10-30 |
| UBS | Maintain | Neutral | 2025-10-30 |
| TD Cowen | Maintain | Hold | 2025-10-30 |
| Evercore ISI Group | Maintain | In Line | 2025-10-30 |
| Piper Sandler | Maintain | Neutral | 2025-10-30 |
| Wells Fargo | Maintain | Equal Weight | 2025-10-30 |
| Mizuho | Maintain | Neutral | 2025-10-28 |
| UBS | Maintain | Neutral | 2025-10-08 |
Grades for Kraft Heinz show a consistent neutral to hold position across multiple analysts, reflecting a cautious outlook with no upgrades or downgrades recently.
The J. M. Smucker Company Grades
The following table summarizes recent grades from reputable financial institutions for J. M. Smucker:
| Grading Company | Action | New Grade | Date |
|---|---|---|---|
| TD Cowen | Maintain | Hold | 2026-01-08 |
| Bernstein | Maintain | Market Perform | 2025-11-26 |
| Stifel | Maintain | Hold | 2025-11-26 |
| UBS | Maintain | Buy | 2025-11-26 |
| Morgan Stanley | Maintain | Overweight | 2025-11-26 |
| JP Morgan | Maintain | Overweight | 2025-11-26 |
| Stifel | Maintain | Hold | 2025-10-24 |
| Argus Research | Downgrade | Hold | 2025-09-12 |
| Barclays | Maintain | Equal Weight | 2025-08-29 |
| JP Morgan | Maintain | Overweight | 2025-08-28 |
J. M. Smucker’s grades indicate a generally more positive stance, with multiple buy and overweight ratings alongside holds, though one recent downgrade from buy to hold was noted.
Which company has the best grades?
J. M. Smucker has received comparatively stronger grades overall, including buy and overweight ratings from several major firms, indicating slightly more favorable analyst sentiment than The Kraft Heinz Company’s predominantly neutral and hold recommendations. This difference may affect investor confidence and potential portfolio positioning depending on risk tolerance and market outlook.
Strengths and Weaknesses
Below is a comparison of The Kraft Heinz Company (KHC) and The J. M. Smucker Company (SJM) based on key financial and strategic criteria as of 2026.
| Criterion | The Kraft Heinz Company (KHC) | The J. M. Smucker Company (SJM) |
|---|---|---|
| Diversification | Highly diversified product portfolio across multiple food categories including dairy, meats, snacks, and beverages with revenues exceeding $11B in “Taste Elevation” segment. | Moderate diversification with focus on pet foods, coffee, and consumer foods, but less breadth compared to KHC. |
| Profitability | Positive net margin at 10.62%, ROIC of 6.61% slightly above WACC, indicating value creation with growing ROIC trend. | Negative net margin (-14.1%) and declining ROIC (-5.09%), signaling value destruction and profitability challenges. |
| Innovation | Demonstrates strong innovation capabilities reflected in sustained revenue growth in multiple segments and increasing ROIC trend. | Innovation appears limited with declining ROIC and profitability, indicating challenges in maintaining competitive edge. |
| Global presence | Strong global footprint with extensive product distribution and revenue streams from various international markets. | Primarily focused on U.S. retail markets with limited international diversification. |
| Market Share | Significant market share in multiple food categories, supported by a durable competitive moat and stable financial ratios. | Smaller market share with pressure on margins and weaker financial metrics, reflecting competitive challenges. |
Key takeaways: Kraft Heinz shows a durable competitive advantage with diversified revenue streams and improving profitability, making it a more attractive investment. In contrast, Smucker faces profitability and growth headwinds, raising caution for investors.
Risk Analysis
Below is a comparison table of key risks for The Kraft Heinz Company (KHC) and The J. M. Smucker Company (SJM) based on the most recent data available.
| Metric | The Kraft Heinz Company (KHC) | The J. M. Smucker Company (SJM) |
|---|---|---|
| Market Risk | Low beta (0.065) indicates low market volatility exposure | Moderate beta (0.22), somewhat more sensitive to market swings |
| Debt level | Moderate debt-to-equity (0.4), favorable leverage | High debt-to-equity (1.28), unfavorable leverage and higher financial risk |
| Regulatory Risk | Moderate, food industry regulations apply | Similar regulatory exposure, including pet food and coffee sectors |
| Operational Risk | Challenges with asset turnover (0.29 unfavorable) | Lower asset turnover (0.5 unfavorable), operational efficiency concerns |
| Environmental Risk | Industry-wide pressures on sustainability, moderate impact | Similar environmental challenges, especially in agricultural sourcing |
| Geopolitical Risk | Moderate, with international markets exposure | Moderate, with diversified product lines and international sales |
Synthesizing these risks, the most impactful and likely risks for both companies are financial leverage and operational efficiency. SJM faces higher financial risk with a debt-to-equity ratio above 1 and negative interest coverage, indicating stress in debt servicing. KHC’s operational inefficiencies, reflected in low asset turnover and interest coverage below 2, also warrant caution. Both companies operate in regulated food sectors with environmental sustainability pressures, which could affect costs and reputation. Market risk is comparatively low for both, with KHC showing particularly low beta, indicating defensive characteristics.
Which Stock to Choose?
The Kraft Heinz Company (KHC) shows mixed income evolution with a declining revenue trend but strong net income growth overall. Its financial ratios are slightly favorable, with solid debt management and a moderate profitability profile. The company holds a very favorable rating supported by a durable competitive advantage and a growing ROIC.
The J. M. Smucker Company (SJM) presents a favorable revenue growth but suffers from significant net income decline and negative profitability ratios. Financial ratios are mostly unfavorable, reflecting high debt and weak coverage metrics. Despite a very favorable rating on some aspects, its overall financial health and value creation are very unfavorable with a declining ROIC.
For investors prioritizing durable competitive advantage and value creation, KHC might appear more favorable due to its growing ROIC and balanced financial profile. Conversely, investors focused on recent revenue growth but accepting higher risk could interpret SJM’s metrics as a potential turnaround candidate, though with caution given its financial challenges.
Disclaimer: Investment carries a risk of loss of initial capital. The past performance is not a reliable indicator of future results. Be sure to understand risks before making an investment decision.
Go Further
I encourage you to read the complete analyses of The Kraft Heinz Company and The J. M. Smucker Company to enhance your investment decisions: