Unilever PLC and The Estée Lauder Companies Inc. are two giants in the household and personal products industry, each boasting strong global brands and innovative product lines. Unilever’s broad portfolio spans beauty, food, and home care, while Estée Lauder focuses on premium skincare and cosmetics. Their market overlap and differing strategies make them compelling investment candidates. In this article, I will help you decide which company deserves a place in your portfolio.

Table of contents
Companies Overview
I will begin the comparison between Unilever PLC and The Estée Lauder Companies Inc. by providing an overview of these two companies and their main differences.
Unilever PLC Overview
Unilever PLC operates as a fast-moving consumer goods company offering products across Beauty & Personal Care, Foods & Refreshment, and Home Care segments. Its portfolio includes well-known brands like Dove, Ben & Jerry’s, and Knorr. Headquartered in London, Unilever serves a broad market with a focus on household and personal products, maintaining a strong global presence since its incorporation in 1894.
The Estée Lauder Companies Inc. Overview
The Estée Lauder Companies Inc. manufactures and markets a diverse range of skin care, makeup, fragrance, and hair care products worldwide. Founded in 1946 and based in New York City, it operates various luxury and prestige brands such as Estée Lauder, Clinique, and MAC. The company targets upscale retail channels and specialty stores, emphasizing premium beauty and personal care segments.
Key similarities and differences
Both companies operate in the consumer defensive sector focusing on personal care products, yet Unilever offers a broader product mix including foods and home care, while Estée Lauder concentrates exclusively on beauty and cosmetics. Unilever has a larger market cap and workforce, reflecting its more diversified portfolio and global scale. Estée Lauder’s business model emphasizes premium brand positioning and specialty retail distribution, contrasting with Unilever’s mass-market approach.
Income Statement Comparison
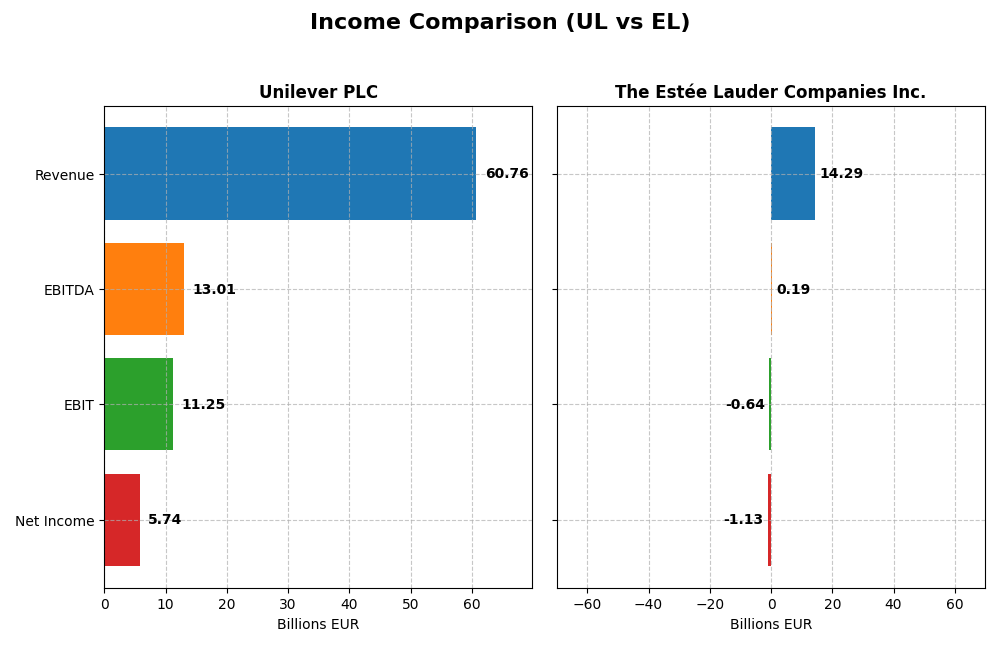
The table below compares the latest fiscal year income statement metrics for Unilever PLC and The Estée Lauder Companies Inc., reflecting their financial performance in 2024 and 2025 respectively.
| Metric | Unilever PLC (2024, EUR) | The Estée Lauder Companies Inc. (2025, USD) |
|---|---|---|
| Market Cap | 141B | 41B |
| Revenue | 60.8B | 14.3B |
| EBITDA | 13.0B | 0.19B |
| EBIT | 11.3B | -0.64B |
| Net Income | 5.7B | -1.1B |
| EPS | 2.3 | -3.15 |
| Fiscal Year | 2024 | 2025 |
Income Statement Interpretations
Unilever PLC
Unilever’s revenue increased moderately from 50.7B in 2020 to 60.8B EUR in 2024, showing a 19.8% growth over the period. Net income displayed more modest growth, rising from 5.6B to 5.7B EUR, with net margin contracting slightly. In 2024, revenue growth slowed to 1.9%, while EBIT margin improved and net income dipped, reflecting mixed margin trends amid stable earnings.
The Estée Lauder Companies Inc.
Estée Lauder experienced a decline in revenue from 17.7B USD in 2022 to 14.3B USD in 2025, a drop of nearly 12%. Net income sharply fell from 2.4B to a negative 1.1B USD in 2025, with net margin turning negative. The latest year saw revenue and gross profit decrease, significant EBIT losses, and deteriorating margins, indicating challenging operating conditions.
Which one has the stronger fundamentals?
Unilever demonstrates stronger fundamentals with generally favorable margin profiles, steady revenue growth, and positive EBIT margins despite some net income softness. Conversely, Estée Lauder’s declining revenue, negative net income, and unfavorable margin trends over recent years highlight weaker financial health. Overall, Unilever’s income statement presents a more stable and favorable performance.
Financial Ratios Comparison
The table below compares key financial ratios for Unilever PLC and The Estée Lauder Companies Inc. using their most recent fiscal year data available.
| Ratios | Unilever PLC (2024 FY) | The Estée Lauder Companies Inc. (2025 FY) |
|---|---|---|
| ROE | 28.7% | -29.3% |
| ROIC | 11.1% | 6.4% |
| P/E | 23.9 | -25.7 |
| P/B | 6.87 | 7.53 |
| Current Ratio | 0.76 | 1.30 |
| Quick Ratio | 0.56 | 0.92 |
| D/E (Debt-to-Equity) | 1.53 | 2.44 |
| Debt-to-Assets | 38.4% | 47.5% |
| Interest Coverage | 8.41 | 2.37 |
| Asset Turnover | 0.76 | 0.72 |
| Fixed Asset Turnover | 5.21 | 2.79 |
| Payout Ratio | 75.2% | -54.5% |
| Dividend Yield | 3.14% | 2.12% |
Interpretation of the Ratios
Unilever PLC
Unilever’s financial ratios show a generally solid profile, with favorable returns on equity (28.73%) and invested capital (11.12%), and a low weighted average cost of capital at 4.42%. However, liquidity ratios such as the current ratio (0.76) and quick ratio (0.56) are weak, as is its debt-to-equity ratio (1.53). The dividend yield is attractive at 3.14%, supported by a stable payout and good free cash flow coverage, though some leverage and liquidity concerns persist.
The Estée Lauder Companies Inc.
Estée Lauder’s ratios reveal challenges, including negative net margin (-7.93%) and return on equity (-29.31%), signaling profitability issues, while the price-to-earnings ratio is favorable due to negative earnings. Liquidity ratios hover around neutral levels, but the high debt-to-equity ratio (2.44) and negative interest coverage indicate financial stress. The company pays a 2.12% dividend yield, despite operating losses, suggesting a focus on shareholder returns amid ongoing investments.
Which one has the best ratios?
Comparing both, Unilever exhibits stronger profitability and a more favorable overall ratio profile despite some liquidity weaknesses. Estée Lauder faces significant profitability and coverage challenges, with higher financial leverage and negative earnings. Thus, Unilever’s ratios are overall more favorable, while Estée Lauder’s show more cautionary signals for investors.
Strategic Positioning
This section compares the strategic positioning of Unilever PLC and The Estée Lauder Companies Inc., focusing on Market position, Key segments, and exposure to disruption:
Unilever PLC
- Large market cap (140.6B USD) with low beta, facing broad competitive pressure in consumer goods.
- Diversified segments: Beauty & Personal Care, Foods & Refreshment, Home Care driving revenues.
- Exposure mainly to evolving consumer preferences; no specific technological disruption indicated.
The Estée Lauder Companies Inc.
- Smaller market cap (40.7B USD) with higher beta, competing in premium beauty and personal care markets.
- Concentrated in skin care, makeup, fragrance, and hair care, with skin care as largest revenue driver.
- Faces disruption risks in beauty tech and e-commerce innovations impacting customer engagement.
Unilever PLC vs The Estée Lauder Companies Inc. Positioning
Unilever adopts a diversified market approach across multiple product categories, offering risk spread but requiring complex management. Estée Lauder focuses on premium beauty segments, enabling brand specialization but with concentrated market exposure.
Which has the best competitive advantage?
Unilever demonstrates a slightly favorable moat with value creation despite declining profitability, while Estée Lauder’s very unfavorable moat reflects value destruction and steep profitability decline, indicating weaker competitive advantage.
Stock Comparison
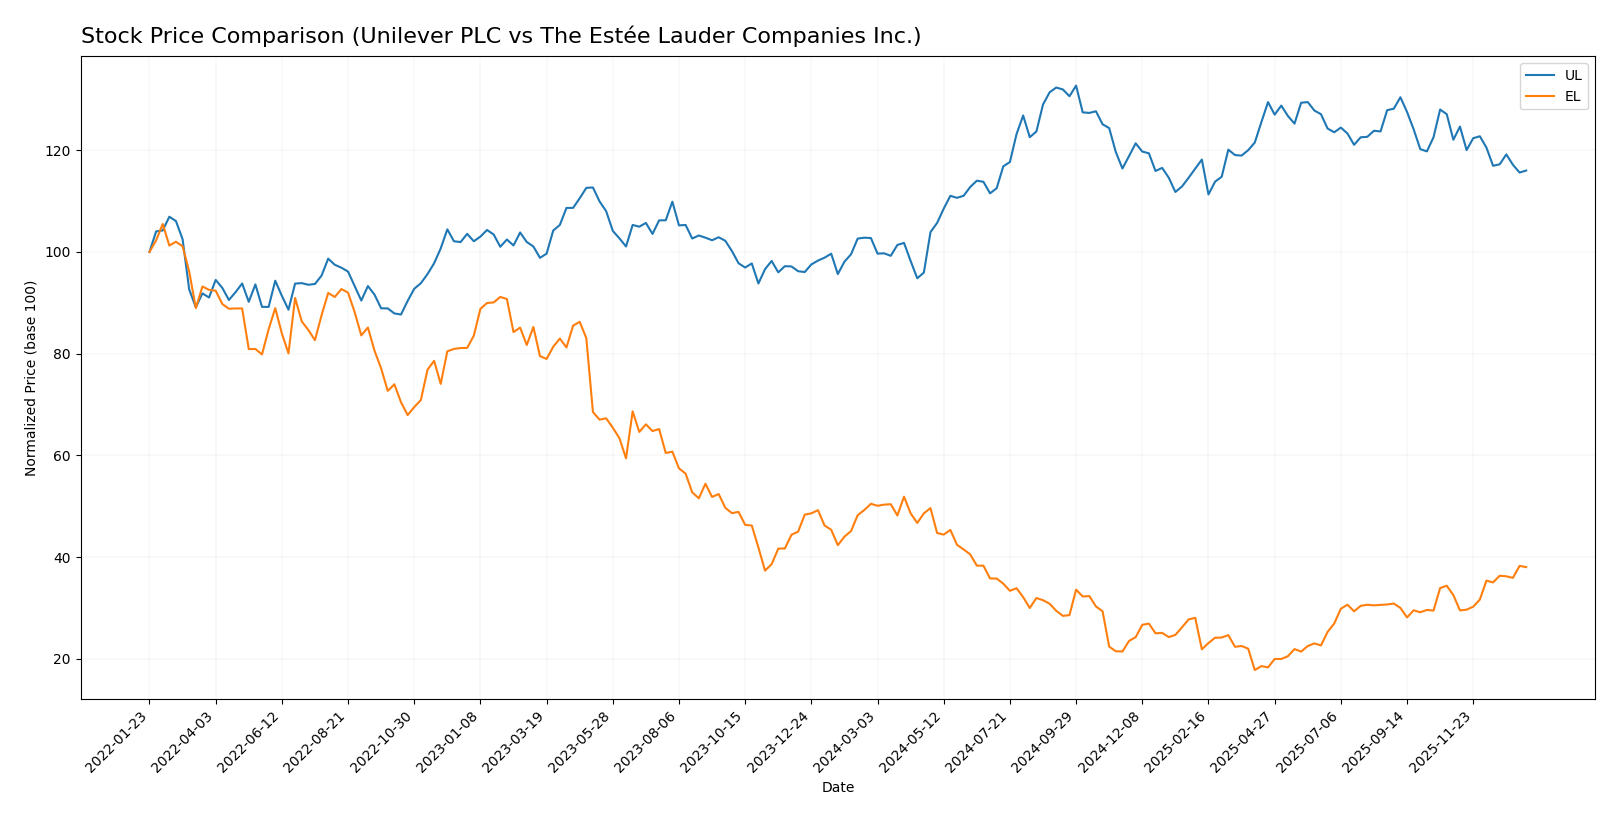
The stock price movements of Unilever PLC and The Estée Lauder Companies Inc. over the past 12 months reveal contrasting dynamics, with Unilever showing overall gains amid decelerating momentum, while Estée Lauder experiences a broader decline but recent recovery signs.
Trend Analysis
Unilever PLC’s stock posted a 12.92% increase over the past year, indicating a bullish trend with decelerating growth. The highest price reached 73.69, and the lowest was 52.66, with recent weeks showing a slight downward adjustment of -4.96%.
The Estée Lauder Companies Inc. experienced a bearish trend with a -24.65% price change over the year, marked by accelerating decline and high volatility. However, recent trading shows a 16.89% rebound, suggesting a positive short-term shift.
Comparing the two, Unilever delivered higher overall market performance with steady gains, while Estée Lauder faced significant losses despite a recent upturn.
Target Prices
Analysts present a clear consensus on target prices for both Unilever PLC and The Estée Lauder Companies Inc.
| Company | Target High | Target Low | Consensus |
|---|---|---|---|
| Unilever PLC | 71 | 60.1 | 65.55 |
| The Estée Lauder Companies Inc. | 130 | 70 | 106.67 |
The consensus target prices for Unilever slightly exceed its current price of 64.42 USD, indicating moderate upside potential. Estée Lauder’s consensus target is notably higher than its current 113.02 USD, suggesting stronger expected growth.
Analyst Opinions Comparison
This section compares analysts’ ratings and grades for Unilever PLC and The Estée Lauder Companies Inc.:
Rating Comparison
Unilever PLC Rating
- Rating: B+, indicating a very favorable overall status.
- Discounted Cash Flow Score: 5, very favorable valuation.
- ROE Score: 5, very favorable efficiency in equity use.
- ROA Score: 4, favorable asset utilization.
- Debt To Equity Score: 1, very unfavorable financial risk.
- Overall Score: 3, moderate overall financial standing.
The Estée Lauder Companies Inc. Rating
- Rating: D+, also noted as very favorable overall status.
- Discounted Cash Flow Score: 2, moderate valuation.
- ROE Score: 1, very unfavorable equity efficiency.
- ROA Score: 1, very unfavorable asset utilization.
- Debt To Equity Score: 1, very unfavorable financial risk.
- Overall Score: 1, very unfavorable overall financial standing.
Which one is the best rated?
Based on the provided data, Unilever PLC is better rated with higher scores in discounted cash flow, return on equity, return on assets, and a moderate overall score, compared to Estée Lauder’s consistently low scores.
Scores Comparison
The scores comparison between Unilever PLC and The Estée Lauder Companies Inc. is as follows:
Unilever PLC Scores
- Altman Z-Score: 4.85, indicating a safe zone with low bankruptcy risk.
- Piotroski Score: 6, representing an average financial strength.
The Estée Lauder Companies Inc. Scores
- Altman Z-Score: 3.11, also in the safe zone but closer to the grey zone threshold.
- Piotroski Score: 5, showing slightly lower average financial strength.
Which company has the best scores?
Unilever PLC has higher scores in both Altman Z-Score and Piotroski Score compared to Estée Lauder, indicating stronger financial stability and slightly better financial health based on these metrics.
Grades Comparison
The following sections present the recent grades for Unilever PLC and The Estée Lauder Companies Inc. from recognized grading firms:
Unilever PLC Grades
This table summarizes Unilever’s grades and rating changes by established financial institutions:
| Grading Company | Action | New Grade | Date |
|---|---|---|---|
| Erste Group | Downgrade | Hold | 2024-11-19 |
| B of A Securities | Upgrade | Buy | 2024-08-22 |
| JP Morgan | Upgrade | Overweight | 2024-05-23 |
| Argus Research | Maintain | Buy | 2024-05-08 |
| Morgan Stanley | Downgrade | Underweight | 2024-02-27 |
| Bernstein | Upgrade | Market Perform | 2022-03-14 |
| Bernstein | Upgrade | Market Perform | 2022-03-13 |
| Bernstein | Upgrade | Market Perform | 2021-11-01 |
| Bernstein | Upgrade | Market Perform | 2021-10-31 |
| Deutsche Bank | Downgrade | Hold | 2021-09-16 |
Unilever’s grades reflect a mixed trend with recent downgrades balanced by multiple upgrades earlier, resulting in a consensus Hold rating.
The Estée Lauder Companies Inc. Grades
Below is the recent grade activity for The Estée Lauder Companies by credible graders:
| Grading Company | Action | New Grade | Date |
|---|---|---|---|
| Wells Fargo | Maintain | Equal Weight | 2026-01-05 |
| Raymond James | Upgrade | Strong Buy | 2026-01-05 |
| Citigroup | Maintain | Neutral | 2025-12-17 |
| Evercore ISI Group | Maintain | Outperform | 2025-12-16 |
| Rothschild & Co | Downgrade | Sell | 2025-11-25 |
| Argus Research | Upgrade | Buy | 2025-11-11 |
| JP Morgan | Maintain | Overweight | 2025-10-31 |
| Telsey Advisory Group | Maintain | Market Perform | 2025-10-31 |
| UBS | Maintain | Neutral | 2025-10-31 |
| RBC Capital | Maintain | Outperform | 2025-10-31 |
Estée Lauder’s grades show a predominantly positive trend with several upgrades and strong Buy ratings, though a recent Sell downgrade indicates some caution; the consensus remains Hold.
Which company has the best grades?
The Estée Lauder Companies have received comparatively stronger grades, including multiple Buy and Outperform ratings and a Strong Buy upgrade, while Unilever’s grades are more mixed with several downgrades and a Hold consensus. This suggests Estée Lauder may exhibit higher analyst confidence, potentially impacting investor sentiment and portfolio positioning accordingly.
Strengths and Weaknesses
Below is a comparative overview of key strengths and weaknesses for Unilever PLC and The Estée Lauder Companies Inc. based on the latest financial and market data.
| Criterion | Unilever PLC (UL) | The Estée Lauder Companies Inc. (EL) |
|---|---|---|
| Diversification | Broad product portfolio across food, home, and personal care segments | Focused on beauty and cosmetics with strong segment specialization |
| Profitability | ROIC 11.12% with positive value creation; net margin 9.45%, ROE 28.73% (favorable) | ROIC 6.44% but negative net margin -7.93%, ROE -29.31%, value destroying |
| Innovation | Moderate innovation; stable but slightly declining ROIC trend | Innovation-driven but profitability declining sharply; ROIC trend -51% |
| Global presence | Extensive global footprint with stable market reach | Strong global beauty brand presence with growth in skincare segment |
| Market Share | Well-established with a diversified market base | Leading in prestige beauty but facing margin pressure and higher debt |
Key takeaway: Unilever shows stronger value creation and more diversified stability, though profitability is slightly declining. Estée Lauder’s focused beauty portfolio has growth potential but currently suffers from deteriorating profitability and financial health, requiring cautious risk management.
Risk Analysis
Below is a comparative table of key risks for Unilever PLC and The Estée Lauder Companies Inc. based on the most recent data available:
| Metric | Unilever PLC | The Estée Lauder Companies Inc. |
|---|---|---|
| Market Risk | Low beta (0.22) indicating lower market volatility risk | Higher beta (1.15) suggesting higher market sensitivity |
| Debt level | Moderate debt-to-assets at 38.4%, DE ratio 1.53 (unfavorable) | Higher debt-to-assets at 47.5%, DE ratio 2.44 (unfavorable) |
| Regulatory Risk | Moderate, global FMCG exposure with compliance requirements | Moderate, cosmetics industry faces evolving regulations |
| Operational Risk | Large global operations with supply chain resilience | Complex product range with reliance on innovation |
| Environmental Risk | Increasing pressure on sustainability; active in green initiatives | Growing focus on eco-friendly products and packaging |
| Geopolitical Risk | Exposure to multiple regions but diversified | US-based with global exposure, sensitive to trade tensions |
The most impactful risks center on Estée Lauder’s higher leverage and negative profitability signals, increasing financial vulnerability. Unilever’s low market volatility and strong Altman Z-Score (4.85, safe zone) suggest more stability, though its debt levels and liquidity ratios warrant caution. Estée Lauder’s Altman Z-Score (3.11) is in the safe zone but closer to moderate risk, with net margin and ROE negative in 2025, highlighting operational and financial challenges ahead.
Which Stock to Choose?
Unilever PLC shows a generally favorable income evolution with strong profitability metrics, including a 28.7% ROE and an 11.1% ROIC above WACC, indicating value creation despite a slight decline in ROIC. Its debt levels and liquidity ratios are less favorable, but the overall rating is very favorable (B+).
The Estée Lauder Companies Inc. displays an unfavorable income trend marked by negative net margin (-7.93%) and ROE (-29.3%), with ROIC below WACC signaling value destruction. Debt ratios and coverage metrics are weak, reflected in a very unfavorable overall rating (D+).
For risk-averse investors prioritizing stability and consistent value creation, Unilever might appear more favorable given its strong profitability and rating. Conversely, risk-tolerant investors focused on potential turnaround opportunities may find Estée Lauder’s recent price rebound and growth prospects worth monitoring cautiously.
Disclaimer: Investment carries a risk of loss of initial capital. The past performance is not a reliable indicator of future results. Be sure to understand risks before making an investment decision.
Go Further
I encourage you to read the complete analyses of Unilever PLC and The Estée Lauder Companies Inc. to enhance your investment decisions: