Home > Comparison > Consumer Defensive > PG vs EL
The strategic rivalry between The Procter & Gamble Company and The Estée Lauder Companies defines the current trajectory of the consumer defensive sector. P&G operates as a diversified, capital-intensive giant with broad household product lines. Estée Lauder focuses on high-margin, premium beauty and skincare brands. This analysis will assess which business model offers a superior risk-adjusted return, guiding investors seeking durable growth and resilience in their portfolios.

Table of contents
Companies Overview
The Procter & Gamble Company and The Estée Lauder Companies Inc. shape the global household and personal products market with distinct strategies.
The Procter & Gamble Company: Global Consumer Goods Powerhouse
The Procter & Gamble Company dominates household and personal care with a vast portfolio spanning beauty, grooming, health, fabric, and family care. Its core revenue engine hinges on trusted branded consumer packaged goods sold worldwide through diversified retail channels. In 2026, P&G focuses strategically on expanding e-commerce and enhancing sustainability across its product lines.
The Estée Lauder Companies Inc.: Luxury Beauty Innovator
The Estée Lauder Companies Inc. leads the luxury skin care, makeup, fragrance, and hair care sectors. It generates revenue through premium branded products sold via department stores, specialty retailers, and direct-to-consumer platforms. In 2026, Estée Lauder prioritizes digital innovation and market penetration in emerging luxury segments to drive growth.
Strategic Collision: Similarities & Divergences
Both firms thrive in household and personal products but diverge sharply in market positioning—P&G targets mass-market ubiquity, while Estée Lauder pursues luxury exclusivity. They compete primarily on brand loyalty and channel innovation, especially in digital sales. Their investment profiles differ distinctly: P&G offers broad stability; Estée Lauder presents growth with higher volatility.
Income Statement Comparison
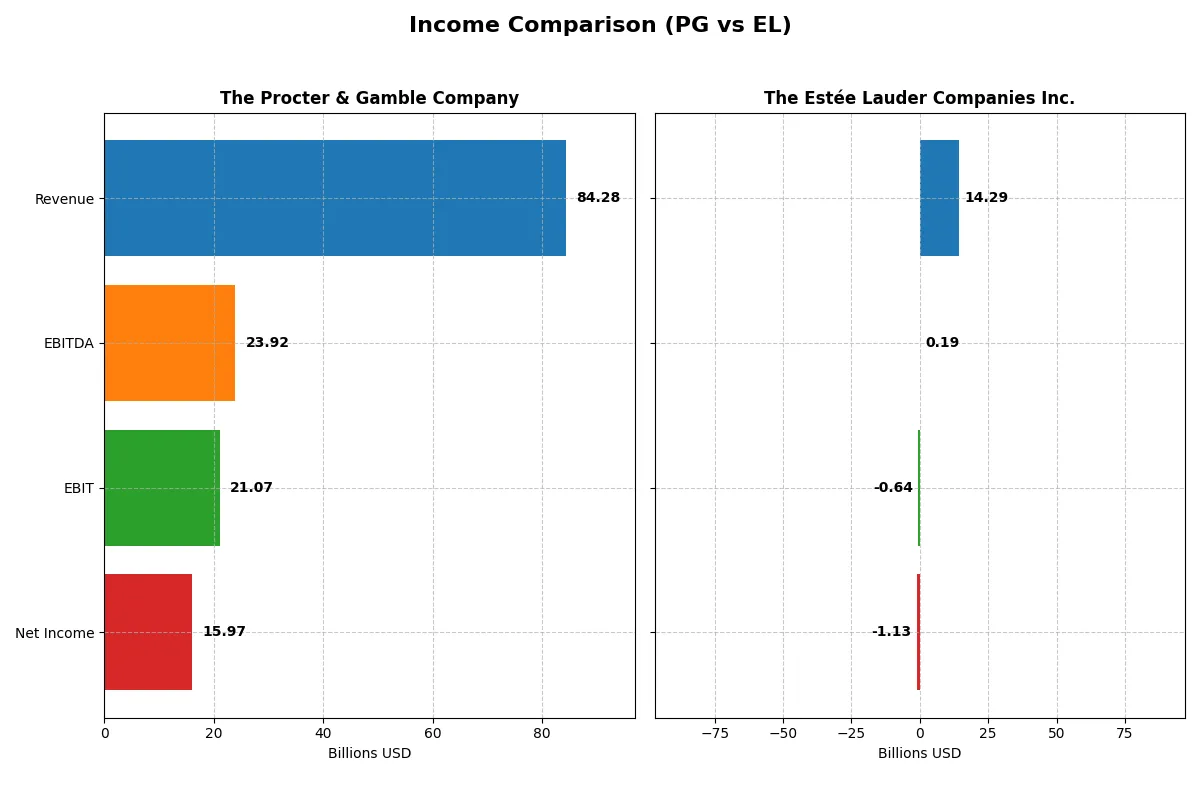
This data dissects the core profitability and scalability of both corporate engines to reveal who dominates the bottom line:
| Metric | The Procter & Gamble Company (PG) | The Estée Lauder Companies Inc. (EL) |
|---|---|---|
| Revenue | 84.3B | 14.3B |
| Cost of Revenue | 41.2B | 3.7B |
| Operating Expenses | 22.7B | 9.6B |
| Gross Profit | 43.1B | 10.6B |
| EBITDA | 23.9B | 0.2B |
| EBIT | 21.1B | -0.6B |
| Interest Expense | 0.9B | 0.4B |
| Net Income | 16.0B | -1.1B |
| EPS | 6.67 | -3.15 |
| Fiscal Year | 2025 | 2025 |
Income Statement Analysis: The Bottom-Line Duel
This comparison unveils which company runs its financial engine with superior efficiency and sustainable profitability.
The Procter & Gamble Company Analysis
Procter & Gamble’s revenue grew steadily from 76B in 2021 to 84B in 2025, with net income rising from 14.3B to 16B. Its gross margin remains robust above 50%, while the net margin at nearly 19% signals strong cost control. In 2025, P&G improved EBIT by 7%, demonstrating efficient scaling despite a marginal revenue increase.
The Estée Lauder Companies Inc. Analysis
Estée Lauder’s revenue declined from 16.2B in 2021 to 14.3B in 2025, dragging net income into negative territory at -1.13B. Its premium gross margin near 74% contrasts sharply with a negative EBIT margin of -4.5%, reflecting weak operational leverage. The 2025 results show deep margin erosion and a steep net loss, signaling operational challenges.
Sustainable Profitability vs. Margin Pressure
Procter & Gamble clearly outperforms with stable revenue growth, favorable margins, and positive net income momentum. Estée Lauder’s shrinking top line and negative profitability highlight significant financial stress. Investors seeking resilient earnings will find P&G’s stable, efficient profile more attractive than Estée Lauder’s current volatility and losses.
Financial Ratios Comparison
These vital ratios act as a diagnostic tool to expose the underlying fiscal health, valuation premiums, and capital efficiency of the companies compared below:
| Ratios | The Procter & Gamble Company (PG) | The Estée Lauder Companies Inc. (EL) |
|---|---|---|
| ROE | 30.7% | -29.3% |
| ROIC | 16.5% | 6.4% |
| P/E | 24.5 | -25.7 |
| P/B | 7.52 | 7.53 |
| Current Ratio | 0.70 | 1.30 |
| Quick Ratio | 0.49 | 0.92 |
| D/E | 0.68 | 2.44 |
| Debt-to-Assets | 28.3% | 47.5% |
| Interest Coverage | 22.5x | 2.4x |
| Asset Turnover | 0.67 | 0.72 |
| Fixed Asset Turnover | 3.53 | 2.79 |
| Payout Ratio | 61.8% | -54.5% |
| Dividend Yield | 2.52% | 2.12% |
| Fiscal Year | 2025 | 2025 |
Efficiency & Valuation Duel: The Vital Signs
Financial ratios serve as a company’s DNA, exposing hidden risks and highlighting operational prowess essential for investor insight.
The Procter & Gamble Company
Procter & Gamble demonstrates robust profitability with a 30.7% ROE and an 18.95% net margin, signaling strong operational efficiency. Its P/E ratio of 24.48 suggests a fairly valued stock, though a high P/B ratio of 7.52 is less favorable. The company returns value via a 2.52% dividend yield, reflecting steady shareholder rewards amid prudent capital allocation.
The Estée Lauder Companies Inc.
Estée Lauder faces challenges with a negative 29.3% ROE and a -7.93% net margin, indicating profitability pressures. The negative P/E ratio stems from losses, yet the stock’s P/B ratio of 7.53 signals valuation concerns. The 2.12% dividend yield offers some income, but elevated debt and weak interest coverage raise caution about financial stability.
Valuation Stability vs. Profitability Struggles
Procter & Gamble offers a balanced risk-reward profile with strong profitability and reasonable valuation metrics. Estée Lauder’s ratios reflect operational difficulties and financial strain despite a modest dividend. Investors seeking stability may prefer Procter & Gamble, while those tolerating higher risk face Estée Lauder’s uneven performance.
Which one offers the Superior Shareholder Reward?
I see that Procter & Gamble (PG) maintains a consistent dividend yield around 2.5%, supported by a solid payout ratio near 62%, well-covered by free cash flow (~79%). PG pairs this with steady buybacks, enhancing total shareholder returns sustainably. In contrast, Estée Lauder (EL) yields slightly less (~2.1–2.5%) but shows volatile profits and weaker free cash flow coverage, with a higher payout ratio sometimes exceeding 100%, signaling risk. EL’s buybacks are less consistent and its debt load heavier. I conclude PG offers a more attractive and sustainable total return profile for 2026 investors.
Comparative Score Analysis: The Strategic Profile
The radar chart reveals the fundamental DNA and trade-offs of The Procter & Gamble Company and The Estée Lauder Companies Inc.:
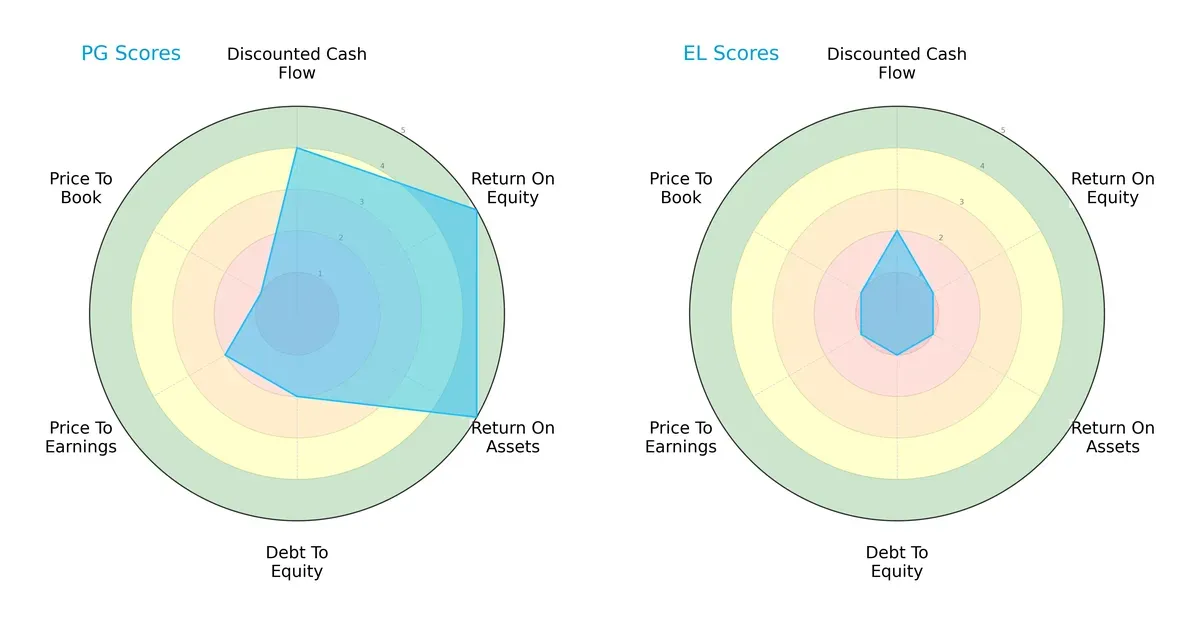
The Procter & Gamble Company shows strength in ROE (5) and ROA (5), indicating efficient profit and asset use. It also scores well on DCF (4) but suffers on valuation metrics, especially Price-to-Book (1). Estée Lauder lags with uniformly low scores, reflecting weaker operational efficiency and higher financial risk. P&G’s profile is more balanced, while Estée Lauder relies on a single moderate DCF score without core operational strength.
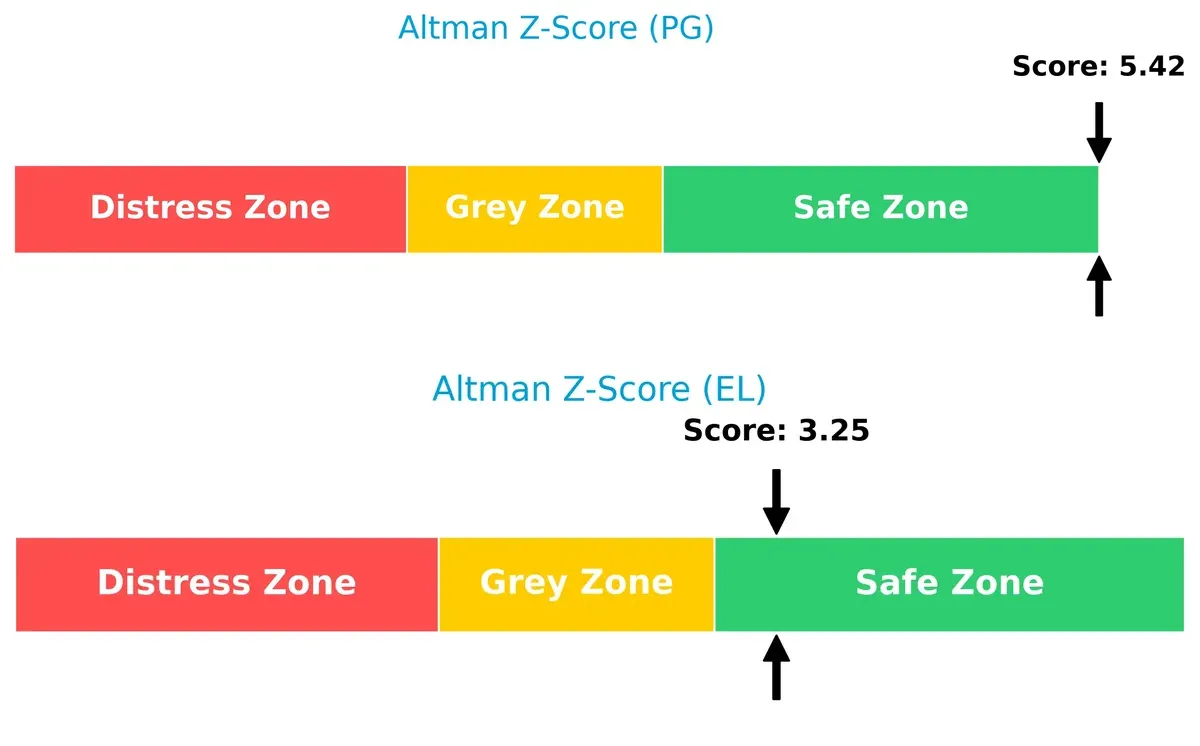
Bankruptcy Risk: Solvency Showdown
The Procter & Gamble Company’s Altman Z-Score of 5.42 versus Estée Lauder’s 3.25 places both firms in the safe zone, but P&G’s higher score signals stronger long-term solvency and resilience in the current cycle:
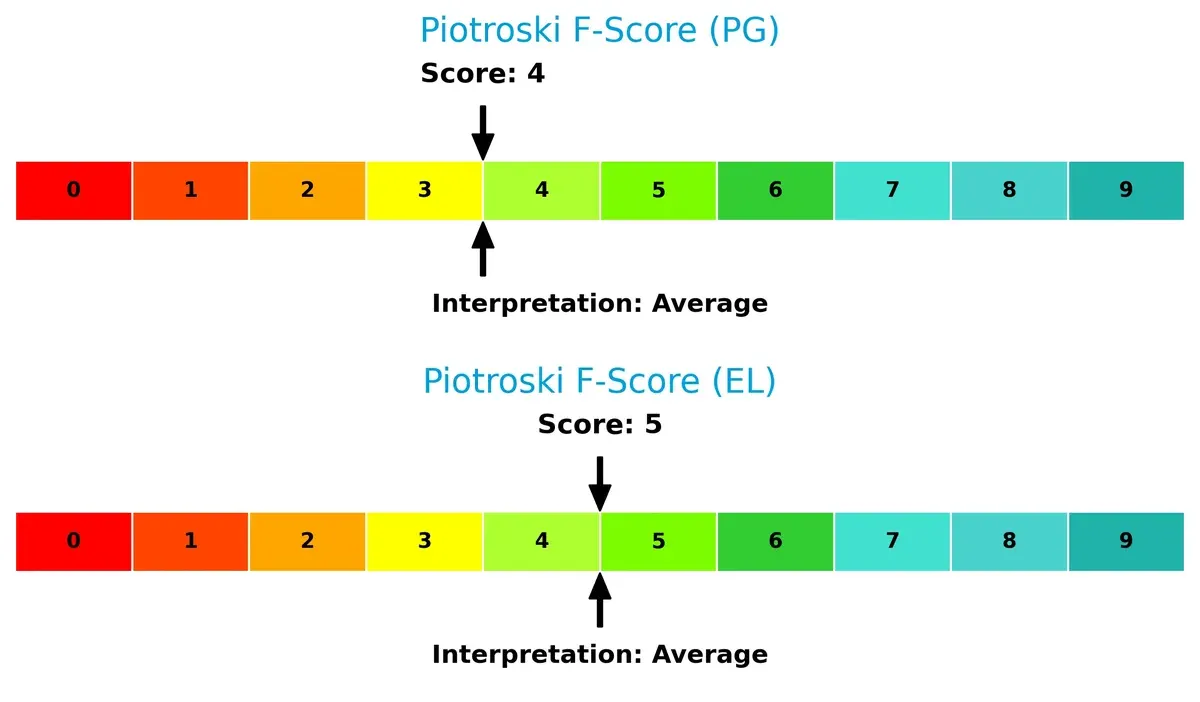
Financial Health: Quality of Operations
The Piotroski F-Score comparison shows P&G at 4 and Estée Lauder at 5, both indicating average financial health. Neither company demonstrates peak operational quality, but Estée Lauder slightly outperforms P&G on internal financial metrics:
How are the two companies positioned?
This section dissects the operational DNA of PG and EL by comparing their revenue distribution and internal dynamics. The goal is to confront their economic moats to reveal which model offers the most resilient competitive advantage today.
Revenue Segmentation: The Strategic Mix
This comparison dissects how The Procter & Gamble Company and The Estée Lauder Companies Inc. diversify their income streams and where their primary sector bets lie:
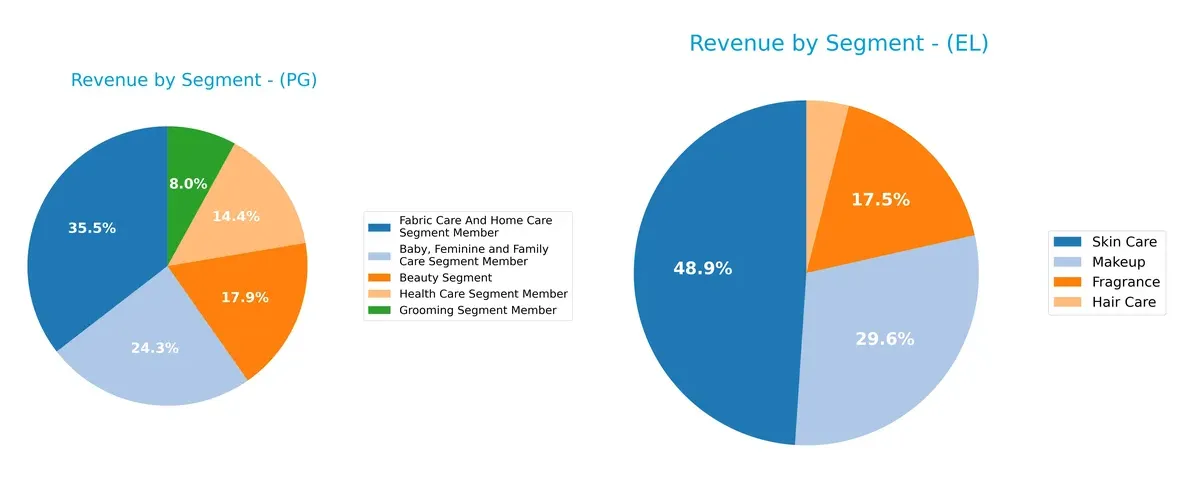
Procter & Gamble anchors revenue in Fabric Care & Home Care at $29.6B, with Baby, Feminine & Family Care close behind at $20.2B. This mix shows a broad consumer staples ecosystem. Estée Lauder pivots heavily on Skin Care at $6.96B, dwarfing its other segments. P&G’s diversified model reduces risk, while Estée Lauder’s concentration in Skin Care signals reliance on beauty trends and brand strength.
Strengths and Weaknesses Comparison
This table compares the Strengths and Weaknesses of The Procter & Gamble Company (PG) and The Estée Lauder Companies Inc. (EL):
PG Strengths
- Diversified revenue across six major segments
- Strong profitability with 18.95% net margin and 30.71% ROE
- Favorable ROIC (16.47%) well above WACC (5.4%)
- Balanced US and Non-US sales near $42.7B each
- Solid dividend yield of 2.52%
- Robust interest coverage at 23.23
EL Strengths
- Diversified product portfolio with skin care, makeup, fragrance, and hair care
- Positive dividend yield of 2.12%
- Neutral asset turnover indicating operational efficiency
- Global presence across US, Asia Pacific, and EMEA with balanced regional sales
- Favorable P/E ratio (despite negative value, rated favorable)
PG Weaknesses
- Low liquidity ratios: current ratio 0.7 and quick ratio 0.49 flagged as unfavorable
- High price-to-book ratio at 7.52
- Moderate debt to equity ratio (0.68) with neutral status
- Neutral price-to-earnings ratio at 24.48
- Asset turnover moderate at 0.67
EL Weaknesses
- Negative net margin (-7.93%) and negative ROE (-29.31%) signal profitability issues
- High debt-to-equity ratio of 2.44 and unfavorable interest coverage (-1.57)
- High price-to-book ratio at 7.53
- Slightly unfavorable global ratio profile with 35.71% unfavorable ratios
- Current and quick ratios neutral but lower than ideal
Overall, PG displays strong profitability and balanced global reach but faces liquidity concerns and valuation pressures. EL struggles with profitability and leverage but maintains diversified products and global exposure. These factors shape their strategic challenges and opportunities going forward.
The Moat Duel: Analyzing Competitive Defensibility
A structural moat shields long-term profits from relentless competition erosion. It is the cornerstone of sustainable advantage:
The Procter & Gamble Company: Cost Advantage with Scale and Brand Power
P&G’s moat stems from unmatched scale and brand portfolio, enabling superior cost efficiency and stable 25% EBIT margins. Growing ROIC (+7%) signals deepening advantage in 2026.
The Estée Lauder Companies Inc.: Intangible Assets with Premium Branding
Estée Lauder relies on powerful brand equity and product innovation, but declining ROIC (-51%) and negative margins reveal vulnerability. Expansion into emerging markets may offer some relief.
Scale and Efficiency vs. Brand Premiums in Decline
P&G’s wider moat outperforms Estée Lauder’s shrinking competitive edge. Its durable cost advantage and rising profitability better defend market share against disruption.
Which stock offers better returns?
Over the past 12 months, both stocks experienced significant price shifts, with distinct bearish trends and recent periods showing varied recovery patterns and buyer dominance.
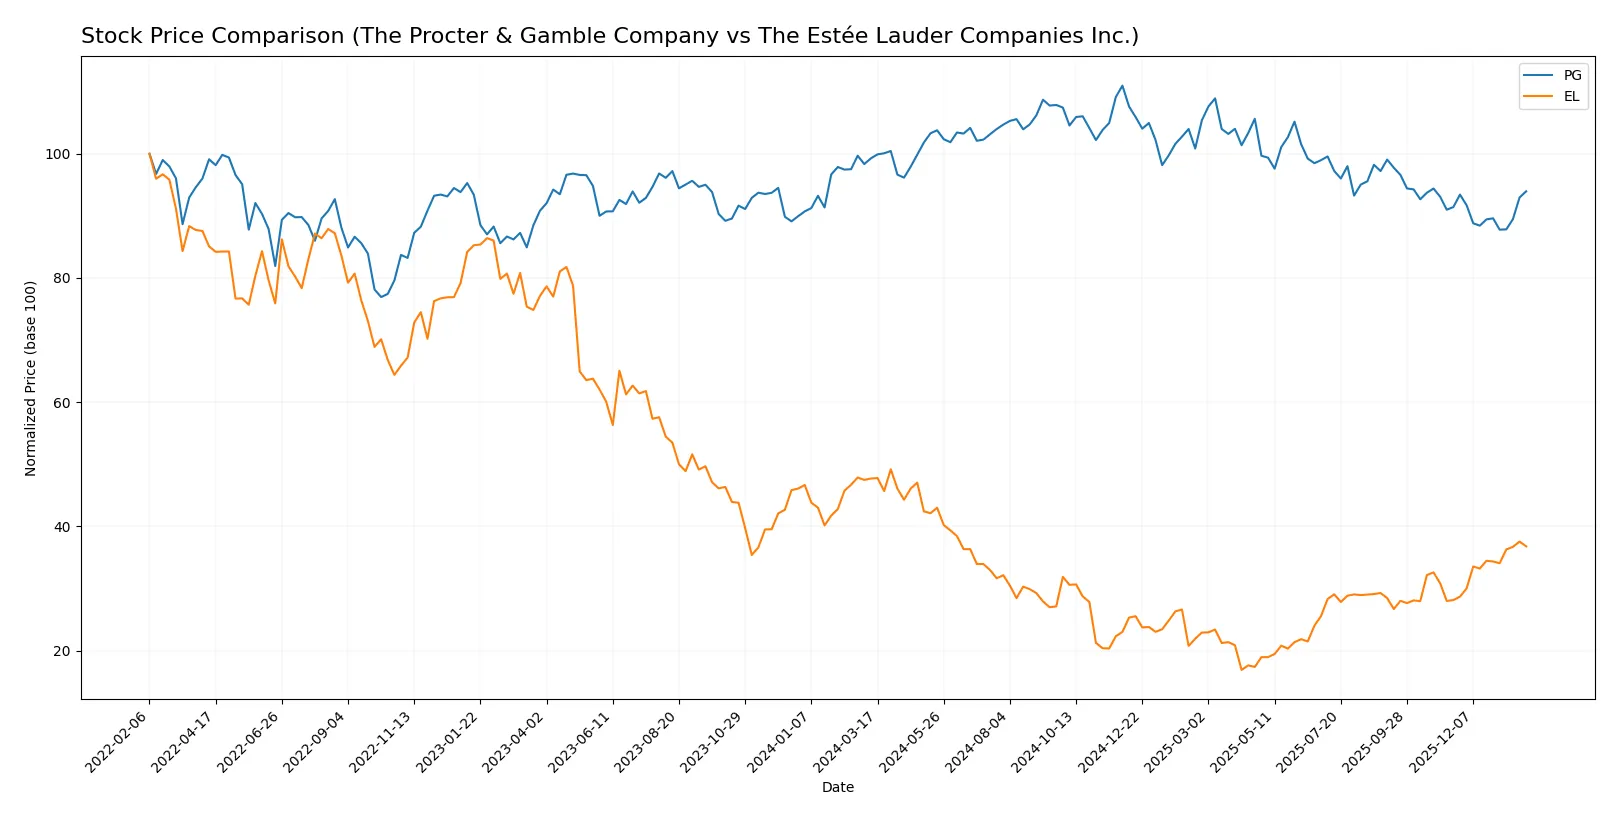
Trend Comparison
The Procter & Gamble Company’s stock declined 5.35% over the past year, showing a bearish trend with accelerating downward momentum and moderate volatility (std dev 8.85). Recent months reveal a mild 2.78% rebound.
The Estée Lauder Companies Inc. suffered a steeper 22.89% drop in the same period, marked by higher volatility (std dev 24.11) and accelerating decline. However, recent weeks delivered a strong 30.73% gain with steep upward slope.
Estée Lauder’s stock showed the highest market performance recently, outperforming Procter & Gamble in both recovery speed and magnitude despite a deeper annual loss.
Target Prices
Analysts present a wide but bullish consensus on target prices for these consumer defensive leaders.
| Company | Target Low | Target High | Consensus |
|---|---|---|---|
| The Procter & Gamble Company | 150 | 179 | 165.67 |
| The Estée Lauder Companies Inc. | 70 | 140 | 113.42 |
The Procter & Gamble consensus target exceeds the current price of 151.77, indicating moderate upside. Estée Lauder’s consensus target also surpasses its current 115.28 price, suggesting positive growth expectations despite a larger target range.

Don’t Let Luck Decide Your Entry Point
Optimize your entry points with our advanced ProRealTime indicators. You’ll get efficient buy signals with precise price targets for maximum performance. Start outperforming now!
How do institutions grade them?
The Procter & Gamble Company Grades
The following table summarizes recent institutional grades for The Procter & Gamble Company:
| Grading Company | Action | New Grade | Date |
|---|---|---|---|
| TD Cowen | Downgrade | Hold | 2026-01-27 |
| UBS | Maintain | Buy | 2026-01-23 |
| JP Morgan | Upgrade | Overweight | 2026-01-23 |
| Wells Fargo | Maintain | Overweight | 2026-01-23 |
| UBS | Maintain | Buy | 2026-01-14 |
| TD Cowen | Maintain | Buy | 2026-01-08 |
| Wells Fargo | Maintain | Overweight | 2026-01-05 |
| JP Morgan | Maintain | Neutral | 2025-12-18 |
| Jefferies | Upgrade | Buy | 2025-12-17 |
| JP Morgan | Maintain | Neutral | 2025-10-27 |
The Estée Lauder Companies Inc. Grades
The following table summarizes recent institutional grades for The Estée Lauder Companies Inc.:
| Grading Company | Action | New Grade | Date |
|---|---|---|---|
| Telsey Advisory Group | Maintain | Market Perform | 2026-01-30 |
| Deutsche Bank | Maintain | Buy | 2026-01-29 |
| TD Cowen | Maintain | Hold | 2026-01-21 |
| JP Morgan | Maintain | Overweight | 2026-01-16 |
| Citigroup | Maintain | Neutral | 2026-01-14 |
| UBS | Maintain | Neutral | 2026-01-14 |
| Raymond James | Upgrade | Strong Buy | 2026-01-05 |
| Wells Fargo | Maintain | Equal Weight | 2026-01-05 |
| Citigroup | Maintain | Neutral | 2025-12-17 |
| Evercore ISI Group | Maintain | Outperform | 2025-12-16 |
Which company has the best grades?
The Procter & Gamble Company generally holds stable Buy to Overweight ratings, while Estée Lauder features more varied grades, including a Strong Buy upgrade. Investors may perceive Estée Lauder’s mixed but occasionally higher grades as a signal of potential upside, whereas Procter & Gamble’s consistent ratings suggest steady confidence.
Risks specific to each company
The following categories identify the critical pressure points and systemic threats facing both firms in the 2026 market environment:
1. Market & Competition
The Procter & Gamble Company
- Dominates mass-market branded consumer goods with diversified segments; intense competition but strong brand moat.
The Estée Lauder Companies Inc.
- Faces fierce competition in premium beauty and cosmetics; high dependency on brand prestige and innovation.
2. Capital Structure & Debt
The Procter & Gamble Company
- Maintains moderate debt-to-equity ratio (0.68) with strong interest coverage (23.23), indicating manageable leverage.
The Estée Lauder Companies Inc.
- High debt-to-equity (2.44) and negative interest coverage (-1.57) signal elevated financial risk and refinancing pressure.
3. Stock Volatility
The Procter & Gamble Company
- Low beta (0.388) suggests stock stability and lower market volatility.
The Estée Lauder Companies Inc.
- High beta (1.146) exposes stock to significant market swings and investor sentiment shifts.
4. Regulatory & Legal
The Procter & Gamble Company
- Operates globally with compliance frameworks; regulatory risks from consumer safety and environmental laws.
The Estée Lauder Companies Inc.
- Faces regulatory scrutiny in cosmetic product safety and international trade policies affecting luxury goods.
5. Supply Chain & Operations
The Procter & Gamble Company
- Complex global supply chain with diversified sourcing; operational resilience but exposed to raw material price volatility.
The Estée Lauder Companies Inc.
- Supply chain sensitive to premium ingredient sourcing and distribution through upscale channels; potential bottlenecks.
6. ESG & Climate Transition
The Procter & Gamble Company
- Strong ESG initiatives supporting sustainability; pressure to reduce environmental footprint in mass production.
The Estée Lauder Companies Inc.
- Increasing ESG focus required to meet luxury consumer expectations and regulatory demands on sustainability.
7. Geopolitical Exposure
The Procter & Gamble Company
- Broad geographic footprint reduces geopolitical risk; exposure to trade tensions impacts input costs and market access.
The Estée Lauder Companies Inc.
- High exposure to volatile emerging markets and luxury consumer trends affected by geopolitical instability.
Which company shows a better risk-adjusted profile?
The Procter & Gamble Company exhibits a stronger risk-adjusted profile. Its moderate leverage, low stock volatility, and resilient market position mitigate major risks. In contrast, Estée Lauder’s high debt, negative interest coverage, and elevated stock volatility heighten financial and market risks. P&G’s robust interest coverage ratio (23.23) versus EL’s negative (-1.57) underlines my concern about EL’s financial stability.
Final Verdict: Which stock to choose?
The Procter & Gamble Company (PG) shines as a cash-generating powerhouse with a durable competitive moat, evidenced by its strong ROIC comfortably above WACC. Its main point of vigilance is a low current ratio, signaling liquidity constraints that require monitoring. PG suits investors targeting steady, long-term growth with moderate risk tolerance.
The Estée Lauder Companies Inc. (EL) leverages a strategic moat rooted in premium brand equity and recurring revenue streams. Its higher liquidity ratios offer a safety cushion compared to PG, but persistent profitability challenges and declining ROIC raise caution flags. EL fits portfolios seeking potential turnaround stories with a higher risk appetite.
If you prioritize capital efficiency and sustainable value creation, PG is the compelling choice due to its consistent profitability and robust economic moat. However, if you seek growth opportunities with exposure to premium consumer brands and can tolerate volatility, EL offers superior upside potential despite its financial headwinds. Each scenario demands careful risk assessment aligned with the investor’s strategy.
Disclaimer: Investment carries a risk of loss of initial capital. The past performance is not a reliable indicator of future results. Be sure to understand risks before making an investment decision.
Go Further
I encourage you to read the complete analyses of The Procter & Gamble Company and The Estée Lauder Companies Inc. to enhance your investment decisions: