The Estée Lauder Companies Inc. (EL) and e.l.f. Beauty, Inc. (ELF) are two key players in the household and personal products industry, each with distinct approaches to beauty innovation and market presence. While Estée Lauder boasts a diverse luxury brand portfolio and global reach, e.l.f. Beauty focuses on affordable, trend-savvy cosmetics with a strong digital footprint. In this article, I will analyze both companies to help you decide which one holds the most promise for your investment portfolio.

Table of contents
Companies Overview
I will begin the comparison between The Estée Lauder Companies Inc. and e.l.f. Beauty, Inc. by providing an overview of these two companies and their main differences.
The Estée Lauder Companies Inc. Overview
The Estée Lauder Companies Inc. is a global leader in the household and personal products sector, offering a broad range of skin care, makeup, fragrance, and hair care products. Founded in 1946 and headquartered in New York City, it markets products under numerous prestigious brands and distributes through diverse channels including department stores, specialty retailers, and e-commerce. The company employs over 44K people and holds a market cap of approximately 40.7B USD.
e.l.f. Beauty, Inc. Overview
e.l.f. Beauty, Inc. operates in the same consumer defensive sector, focusing on cosmetic and skin care products under its e.l.f. Cosmetics, e.l.f. Skin, Well People, and Keys Soulcare brands. Founded in 2004 and based in Oakland, California, it sells primarily through national and international retailers and direct-to-consumer e-commerce channels. The company has a market cap of about 4.9B USD and employs around 630 people.
Key similarities and differences
Both companies operate within the household and personal products industry and offer skin care and cosmetic products worldwide. However, Estée Lauder has a significantly larger market capitalization and employee base, reflecting its broader product portfolio and distribution network. e.l.f. Beauty leans more on direct-to-consumer and retail partnerships with a smaller scale and younger brand presence, while Estée Lauder emphasizes a multi-brand strategy with global reach and diversified sales channels.
Income Statement Comparison
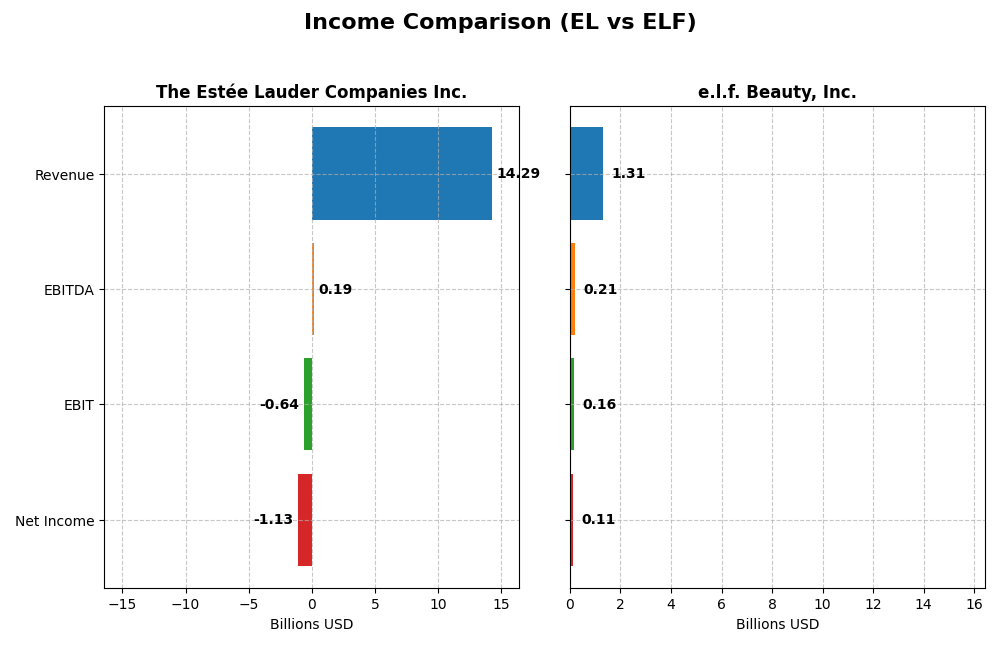
This table compares key income statement metrics for The Estée Lauder Companies Inc. and e.l.f. Beauty, Inc. for their most recent fiscal years, providing a snapshot of their financial performance.
| Metric | The Estée Lauder Companies Inc. | e.l.f. Beauty, Inc. |
|---|---|---|
| Market Cap | 40.7B | 4.9B |
| Revenue | 14.3B | 1.3B |
| EBITDA | 193M | 206M |
| EBIT | -636M | 162M |
| Net Income | -1.13B | 112M |
| EPS | -3.15 | 1.99 |
| Fiscal Year | 2025 | 2025 |
Income Statement Interpretations
The Estée Lauder Companies Inc.
From 2021 to 2025, Estée Lauder’s revenue declined from $16.2B to $14.3B, with net income turning negative in 2025 at -$1.13B. Gross margins remained robust near 74%, but EBIT and net margins worsened significantly, reflecting operational challenges. The latest fiscal year showed revenue contraction with deteriorating profitability, marking an unfavorable trend overall.
e.l.f. Beauty, Inc.
e.l.f. Beauty exhibited strong growth between 2021 and 2025, with revenue increasing from $318M to $1.31B and net income rising to $112M. Gross and EBIT margins improved, reaching 71% and 12.3% respectively in 2025. Despite a slight dip in net margin growth recently, the company’s overall income statement performance remained favorable, supported by consistent revenue and profit expansion.
Which one has the stronger fundamentals?
e.l.f. Beauty demonstrates stronger fundamentals with substantial revenue and net income growth, alongside favorable margin improvements and a positive income statement outlook. Conversely, Estée Lauder’s declining revenue, negative net income, and deteriorating profitability suggest weaker fundamentals. The contrast highlights e.l.f.’s superior income statement trajectory over the analyzed period.
Financial Ratios Comparison
The following table compares key financial ratios of The Estée Lauder Companies Inc. (EL) and e.l.f. Beauty, Inc. (ELF) for their most recent fiscal years, providing insight into profitability, liquidity, leverage, efficiency, and shareholder returns.
| Ratios | The Estée Lauder Companies Inc. (EL) FY 2025 | e.l.f. Beauty, Inc. (ELF) FY 2025 |
|---|---|---|
| ROE | -29.3% | 14.7% |
| ROIC | 6.4% | 11.2% |
| P/E | -25.7 | 31.5 |
| P/B | 7.53 | 4.64 |
| Current Ratio | 1.30 | 3.05 |
| Quick Ratio | 0.92 | 2.00 |
| D/E (Debt-to-Equity) | 2.44 | 0.41 |
| Debt-to-Assets | 47.5% | 25.1% |
| Interest Coverage | 2.37 | 9.20 |
| Asset Turnover | 0.72 | 1.05 |
| Fixed Asset Turnover | 2.79 | 45.6 |
| Payout Ratio | -54.5% | 0% |
| Dividend Yield | 2.12% | 0% |
Interpretation of the Ratios
The Estée Lauder Companies Inc.
The Estée Lauder shows mixed financial health with several unfavorable ratios like a negative net margin (-7.93%) and a deeply negative return on equity (-29.31%), signaling profitability and efficiency concerns. Its debt to equity ratio (2.44) and interest coverage (-1.57) highlight financial risk. The dividend yield is positive at 2.12%, supporting shareholder returns, though coverage by free cash flow is weak, posing sustainability risks.
e.l.f. Beauty, Inc.
e.l.f. Beauty presents a neutral outlook with a positive net margin (8.53%) and return on equity (14.73%), though its return on invested capital (11.21%) and weighted average cost of capital (11.49%) are unfavorable. The company pays no dividends, likely focusing on reinvestment and growth. Favorable liquidity and leverage ratios, including a strong quick ratio (2.0) and low debt to equity (0.41), suggest sound financial flexibility.
Which one has the best ratios?
e.l.f. Beauty exhibits a more balanced financial profile with a higher proportion of favorable ratios (42.86%) and neutral overall evaluation, despite no dividend payouts. The Estée Lauder Companies Inc. has more unfavorable ratios (35.71%) and a slightly unfavorable global opinion, reflecting challenges in profitability and debt management.
Strategic Positioning
This section compares the strategic positioning of The Estée Lauder Companies Inc. and e.l.f. Beauty, Inc. in terms of market position, key segments, and exposure to technological disruption:
The Estée Lauder Companies Inc.
- Large market cap of $40.7B, facing typical industry competition pressure.
- Diverse product portfolio: skin care, makeup, fragrance, hair care driving revenue.
- No explicit data on technological disruption exposure provided in the input.
e.l.f. Beauty, Inc.
- Smaller market cap $4.9B, higher beta indicating greater volatility and competitive pressure.
- Focused on cosmetic and skin care products under fewer brands through retail and e-commerce.
- No explicit data on technological disruption exposure provided in the input.
The Estée Lauder Companies Inc. vs e.l.f. Beauty, Inc. Positioning
The Estée Lauder exhibits a diversified product portfolio with multiple brands and global channels, while e.l.f. Beauty operates with a more concentrated brand and product focus. Estée Lauder’s scale offers broad market reach, whereas e.l.f. targets specific segments with fewer employees.
Which has the best competitive advantage?
Both companies are currently shedding value with ROIC below WACC; however, e.l.f. Beauty shows a growing ROIC trend, indicating improving profitability, while Estée Lauder’s declining ROIC suggests worsening value creation.
Stock Comparison
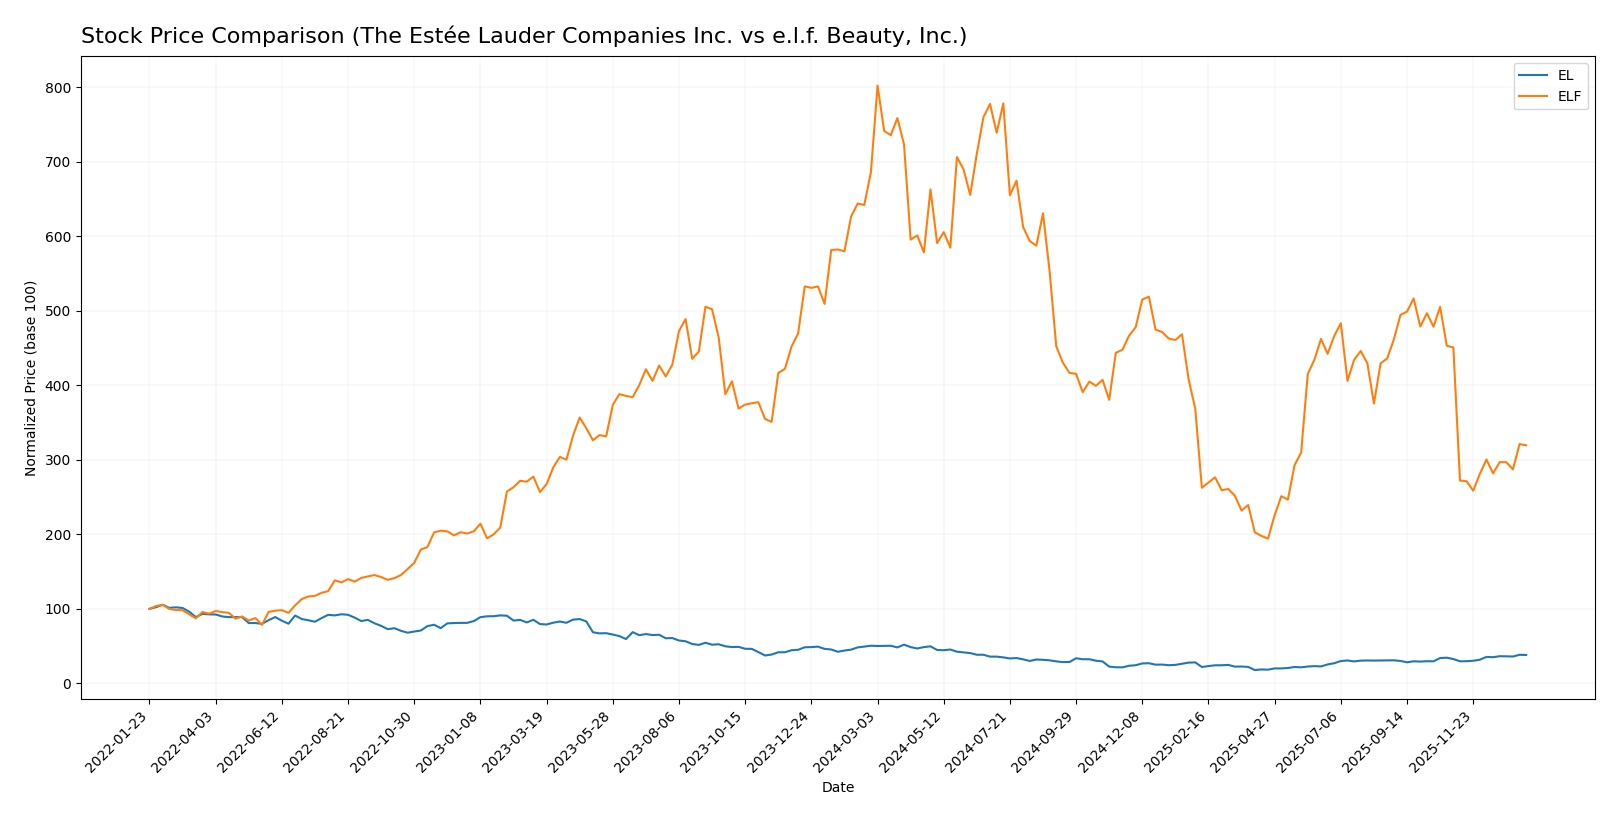
The stock price chart highlights significant bearish trends for both The Estée Lauder Companies Inc. and e.l.f. Beauty, Inc. over the past 12 months, with notable price declines and varying recent momentum in trading dynamics.
Trend Analysis
The Estée Lauder Companies Inc. (EL) experienced a 24.65% price decline over the past year, indicating a bearish trend with accelerating downward momentum. Recent weeks show a 16.89% price rebound with a positive slope and reduced volatility.
e.l.f. Beauty, Inc. (ELF) posted a 53.44% price drop over the same period, confirming an accelerated bearish trend with high volatility. Its recent trend worsened by 29.11%, reflecting continued negative momentum and seller dominance.
Comparing both stocks reveals EL has delivered a stronger market performance than ELF, with a less severe overall decline and a recent positive price reversal.
Target Prices
The consensus target prices from recognized analysts show positive upside potential for both The Estée Lauder Companies Inc. and e.l.f. Beauty, Inc.
| Company | Target High | Target Low | Consensus |
|---|---|---|---|
| The Estée Lauder Companies Inc. | 130 | 70 | 106.67 |
| e.l.f. Beauty, Inc. | 165 | 85 | 128.17 |
Analysts expect Estée Lauder to trade slightly below its consensus target, while e.l.f. Beauty’s target suggests a substantial upside from the current price, reflecting stronger growth expectations.
Analyst Opinions Comparison
This section compares analysts’ ratings and grades for The Estée Lauder Companies Inc. and e.l.f. Beauty, Inc.:
Rating Comparison
EL Rating
- Rating: D+, considered very favorable
- Discounted Cash Flow Score: 2, interpreted as moderate
- ROE Score: 1, very unfavorable
- ROA Score: 1, very unfavorable
- Debt To Equity Score: 1, very unfavorable
- Overall Score: 1, very unfavorable
ELF Rating
- Rating: C+, considered very favorable
- Discounted Cash Flow Score: 3, interpreted as moderate
- ROE Score: 3, moderate
- ROA Score: 3, moderate
- Debt To Equity Score: 2, moderate
- Overall Score: 2, moderate
Which one is the best rated?
Based exclusively on the provided data, e.l.f. Beauty, Inc. holds a higher rating and better scores across most financial metrics compared to The Estée Lauder Companies Inc., indicating a comparatively stronger analyst evaluation.
Scores Comparison
Here is a comparison of the Altman Z-Score and Piotroski Score for both companies:
EL Scores
- Altman Z-Score: 3.11, indicating a safe zone status
- Piotroski Score: 5, considered average strength
ELF Scores
- Altman Z-Score: 3.44, indicating a safe zone status
- Piotroski Score: 5, considered average strength
Which company has the best scores?
Both EL and ELF are in the safe zone for the Altman Z-Score, with ELF slightly higher. They share the same average Piotroski Score of 5, indicating similar financial strength based on these metrics.
Grades Comparison
Here is a detailed comparison of the recent grades assigned to The Estée Lauder Companies Inc. and e.l.f. Beauty, Inc.:
The Estée Lauder Companies Inc. Grades
The following table summarizes the latest grades from major financial institutions for The Estée Lauder Companies Inc.:
| Grading Company | Action | New Grade | Date |
|---|---|---|---|
| Wells Fargo | Maintain | Equal Weight | 2026-01-05 |
| Raymond James | Upgrade | Strong Buy | 2026-01-05 |
| Citigroup | Maintain | Neutral | 2025-12-17 |
| Evercore ISI Group | Maintain | Outperform | 2025-12-16 |
| Rothschild & Co | Downgrade | Sell | 2025-11-25 |
| Argus Research | Upgrade | Buy | 2025-11-11 |
| JP Morgan | Maintain | Overweight | 2025-10-31 |
| Telsey Advisory Group | Maintain | Market Perform | 2025-10-31 |
| UBS | Maintain | Neutral | 2025-10-31 |
| RBC Capital | Maintain | Outperform | 2025-10-31 |
The grades for The Estée Lauder Companies Inc. show a mixed trend with upgrades to “Strong Buy” and “Buy” but also a notable downgrade to “Sell” by Rothschild & Co, indicating divergence in analyst opinions.
e.l.f. Beauty, Inc. Grades
The table below presents recent grades from reputable financial analysts for e.l.f. Beauty, Inc.:
| Grading Company | Action | New Grade | Date |
|---|---|---|---|
| Piper Sandler | Maintain | Neutral | 2025-12-22 |
| JP Morgan | Maintain | Overweight | 2025-12-18 |
| Goldman Sachs | Maintain | Buy | 2025-11-07 |
| Baird | Maintain | Outperform | 2025-11-06 |
| Jefferies | Maintain | Buy | 2025-11-06 |
| Piper Sandler | Downgrade | Neutral | 2025-11-06 |
| UBS | Maintain | Neutral | 2025-11-06 |
| Canaccord Genuity | Maintain | Buy | 2025-11-06 |
| JP Morgan | Maintain | Overweight | 2025-11-06 |
| Jefferies | Maintain | Buy | 2025-10-28 |
Grades for e.l.f. Beauty, Inc. predominantly indicate positive sentiment, with multiple “Buy” and “Outperform” ratings and fewer downgrades, reflecting a generally favorable analyst view.
Which company has the best grades?
e.l.f. Beauty, Inc. has received generally stronger and more consistent positive grades such as “Buy” and “Outperform” compared to The Estée Lauder Companies Inc., which shows more mixed signals. This difference could suggest varying analyst confidence levels that may influence investor sentiment and portfolio weighting decisions.
Strengths and Weaknesses
Below is a comparison table highlighting the strengths and weaknesses of The Estée Lauder Companies Inc. (EL) and e.l.f. Beauty, Inc. (ELF) based on recent financial and market data:
| Criterion | The Estée Lauder Companies Inc. (EL) | e.l.f. Beauty, Inc. (ELF) |
|---|---|---|
| Diversification | Highly diversified product portfolio: skin care $6.96B, makeup $4.21B, fragrance $2.49B, hair care $565M (2025) | Less diversified, focused mainly on affordable makeup and skincare products |
| Profitability | Currently shedding value, negative net margin (-7.93%), negative ROE (-29.31%), but neutral ROIC (6.44%) | Also shedding value, but improving profitability with positive net margin (8.53%) and ROE (14.73%) |
| Innovation | Established brand with extensive R&D; however, profitability decline suggests challenges in innovation payoff | Growing ROIC trend and improving margins suggest effective innovation and market adaptation |
| Global presence | Strong global footprint with established distribution and brand recognition worldwide | More limited global presence, focused on North America with growing expansion efforts |
| Market Share | Large market share in premium beauty segments but facing margin pressure and declining profitability | Smaller market share but capturing value-conscious consumers and showing growth potential |
Key takeaways: Estée Lauder benefits from strong diversification and global reach but struggles with profitability and value creation. e.l.f. Beauty, while less diversified and smaller, shows promising profitability trends and efficient capital use, signaling potential for future growth despite current challenges. Investors should weigh EL’s stability against ELF’s growth trajectory and improving returns.
Risk Analysis
Below is a comparative risk table for The Estée Lauder Companies Inc. (EL) and e.l.f. Beauty, Inc. (ELF) based on the most recent 2025 data.
| Metric | The Estée Lauder Companies Inc. (EL) | e.l.f. Beauty, Inc. (ELF) |
|---|---|---|
| Market Risk | Moderate (Beta 1.15, wide price range 48.37-113.86) | Higher (Beta 1.72, wider price range 49.4-150.99) |
| Debt level | High (D/E ratio 2.44, interest coverage -1.57) | Low (D/E ratio 0.41, interest coverage 9.44) |
| Regulatory Risk | Moderate (Global operations in cosmetics sector) | Moderate (Focus on e-commerce and retail) |
| Operational Risk | Moderate (Large global supply chain and brand portfolio) | Moderate (Smaller scale but reliant on DTC and distributors) |
| Environmental Risk | Moderate (Industry pressure on sustainability) | Moderate (Growing emphasis on clean and ethical products) |
| Geopolitical Risk | Moderate (Exposure to global markets, currency fluctuations) | Moderate (International presence but smaller scale) |
In summary, Estée Lauder faces significant debt and profitability challenges, raising financial risk despite its market strength. e.l.f. Beauty shows healthier balance sheet metrics but higher market volatility and valuation concerns. Debt levels and interest coverage are the most impactful risks for Estée Lauder, while market risk and valuation pose greater concerns for e.l.f. Beauty.
Which Stock to Choose?
The Estée Lauder Companies Inc. (EL) shows a declining income evolution with unfavorable net margin and ROE, and a slightly unfavorable global ratios evaluation. The company carries significant debt levels and a very unfavorable rating, indicating value destruction and declining profitability.
e.l.f. Beauty, Inc. (ELF) presents a favorable income evolution with positive gross and EBIT margins, though net margin growth is negative short-term. Its financial ratios are neutral overall, with a moderate rating and improving profitability despite some unfavorable valuation metrics.
For risk-averse investors seeking improving profitability and moderate financial stability, ELF might appear more favorable, while risk-tolerant investors focusing on established scale but facing declining returns may view EL with caution given its very unfavorable rating and value destruction trend.
Disclaimer: Investment carries a risk of loss of initial capital. The past performance is not a reliable indicator of future results. Be sure to understand risks before making an investment decision.
Go Further
I encourage you to read the complete analyses of The Estée Lauder Companies Inc. and e.l.f. Beauty, Inc. to enhance your investment decisions: