Home > Comparison > Consumer Defensive > KO vs PEP
The strategic rivalry between The Coca-Cola Company and PepsiCo, Inc. shapes the consumer defensive beverages sector. Coca-Cola operates as a focused beverage manufacturer with a global bottling network. PepsiCo combines beverage production with a diversified food portfolio, leveraging scale across snacks and drinks. This analysis contrasts their operational models to identify which company offers superior risk-adjusted returns for diversified investors navigating sector leadership and growth dynamics.
Table of contents
Companies Overview
The Coca-Cola Company and PepsiCo, Inc. dominate the global non-alcoholic beverages sector with expansive portfolios and strong brand recognition.
The Coca-Cola Company: Iconic Beverage Leader
The Coca-Cola Company commands the non-alcoholic beverage market worldwide. It generates revenue primarily through sparkling soft drinks and a broad range of beverages including water, coffee, tea, and plant-based options. In 2026, its strategic focus remains on expanding its product diversity and refining distribution via independent bottlers and distributors to maintain its strong global footprint.
PepsiCo, Inc.: Diversified Food and Beverage Giant
PepsiCo, Inc. leads as a global beverages and convenient foods manufacturer, blending snack foods with beverages. Its core revenue streams span seven segments covering drinks, snacks, and packaged foods. The company emphasizes integrated distribution networks and e-commerce platforms, aiming to synergize its extensive product lines and geographic reach in 2026 for sustained growth.
Strategic Collision: Similarities & Divergences
Both firms excel in consumer defensive products but diverge in scope: Coca-Cola focuses predominantly on beverages, while PepsiCo integrates snacks and foods for broader market penetration. Their primary battleground is global beverage sales, leveraging brand loyalty and distribution channels. Investors face contrasting profiles: Coca-Cola’s focused beverage moat versus PepsiCo’s diversified portfolio and multi-segment exposure.
Income Statement Comparison
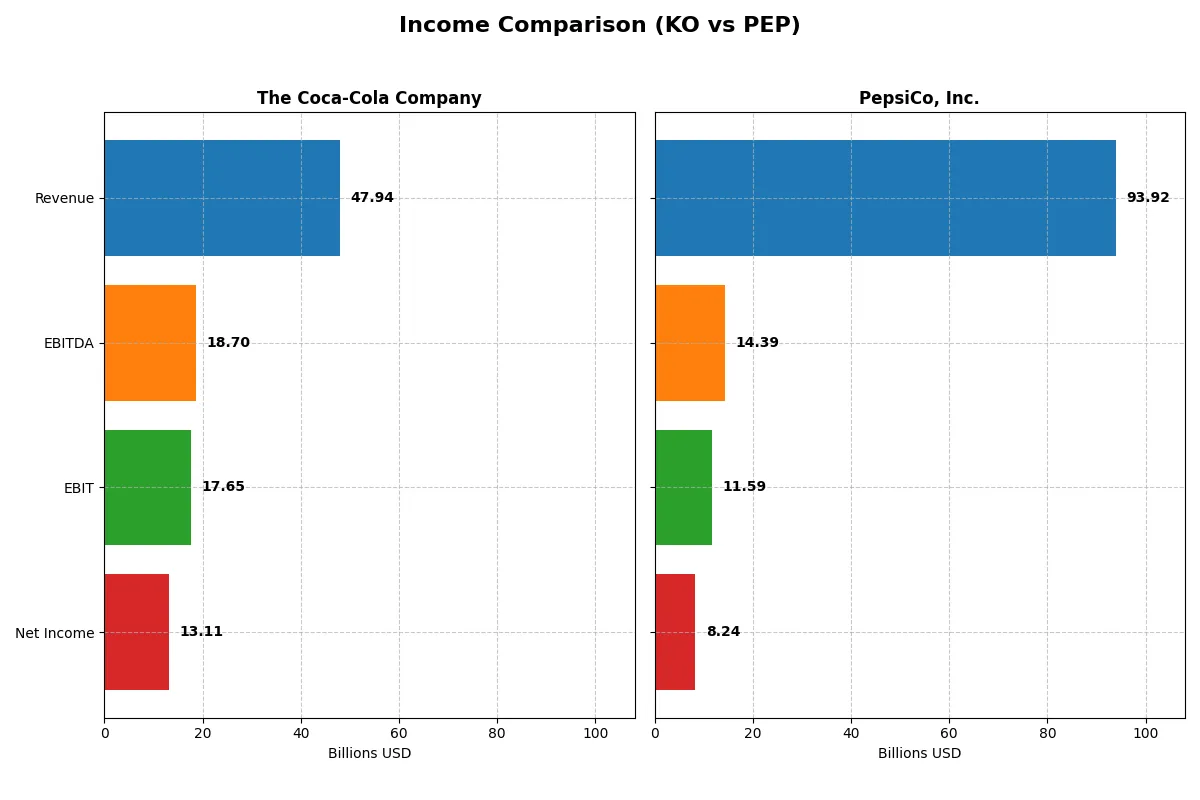
This data dissects the core profitability and scalability of both corporate engines to reveal who dominates the bottom line:
| Metric | The Coca-Cola Company (KO) | PepsiCo, Inc. (PEP) |
|---|---|---|
| Revenue | 47.9B | 93.9B |
| Cost of Revenue | 18.4B | 43.1B |
| Operating Expenses | 15.8B | 39.4B |
| Gross Profit | 29.5B | 50.9B |
| EBITDA | 18.7B | 14.4B |
| EBIT | 17.7B | 11.6B |
| Interest Expense | 1.7B | 1.1B |
| Net Income | 13.1B | 8.2B |
| EPS | 3.05 | 6.01 |
| Fiscal Year | 2025 | 2025 |
Income Statement Analysis: The Bottom-Line Duel
The following income statement comparison reveals which company drives greater efficiency and profitability in their core operations over recent years.
The Coca-Cola Company Analysis
Coca-Cola’s revenue rose steadily from $38.7B in 2021 to $47.9B in 2025, marking a 24% increase. Net income climbed even faster, growing 34% to $13.1B. Its gross margin remains robust at 61.6%, while net margin expanded to 27.3%. The 2025 surge in EBIT by nearly 20% signals strong operational momentum and disciplined cost control.
PepsiCo, Inc. Analysis
PepsiCo’s revenue expanded from $79.5B in 2021 to $93.9B in 2025, up 18%. However, net income growth lagged, rising only 8% to $8.24B, with a compressed net margin of 8.8%. Gross margin is solid at 54.2%, but EBIT shrank nearly 10% last year, reflecting margin pressure and rising expenses. The 2025 results show less operational leverage compared to Coca-Cola.
Margin Power vs. Revenue Scale
Coca-Cola outperforms PepsiCo on profitability metrics, boasting superior gross and net margins alongside stronger net income growth. PepsiCo offers larger top-line scale but struggles with margin erosion and declining EBIT. Investors seeking efficient profit generation might favor Coca-Cola’s disciplined earnings expansion over PepsiCo’s volume-driven but margin-challenged profile.
Financial Ratios Comparison
These vital ratios act as a diagnostic tool to expose the underlying fiscal health, valuation premiums, and capital efficiency of the companies compared below:
| Ratios | The Coca-Cola Company (KO) | PepsiCo, Inc. (PEP) |
|---|---|---|
| ROE | 40.7% | 40.4% |
| ROIC | 14.2% | 11.3% |
| P/E | 23.0 | 23.9 |
| P/B | 9.35 | 9.66 |
| Current Ratio | 1.46 | 0.85 |
| Quick Ratio | 1.25 | 0.67 |
| D/E | 1.41 | 2.45 |
| Debt-to-Assets | 43.4% | 46.5% |
| Interest Coverage | 9.08 | 10.26 |
| Asset Turnover | 0.46 | 0.87 |
| Fixed Asset Turnover | 4.99 | 2.79 |
| Payout Ratio | 67.0% | 92.7% |
| Dividend Yield | 2.92% | 3.87% |
| Fiscal Year | 2025 | 2025 |
Efficiency & Valuation Duel: The Vital Signs
Financial ratios serve as a company’s DNA, exposing hidden risks and operational strengths that numbers alone can’t reveal.
The Coca-Cola Company
Coca-Cola delivers strong profitability with a 40.7% ROE and a robust 27.3% net margin, signaling operational excellence. The P/E ratio at 22.95 is fairly valued, though a high P/B of 9.35 suggests a stretched equity price. It rewards shareholders with a 2.92% dividend yield, reflecting steady capital return.
PepsiCo, Inc.
PepsiCo posts a solid 40.4% ROE but a more moderate 8.8% net margin, indicating less efficiency in converting sales to profit. The stock trades at a similar P/E near 23.9 but suffers from a weaker liquidity profile. Its 3.87% dividend yield offers attractive income, albeit amid higher leverage and less favorable current ratios.
Operational Strength vs. Income Appeal
Coca-Cola shows superior profitability and liquidity, offering a more stable operational platform. PepsiCo provides a higher dividend yield but carries greater financial risk. Investors seeking operational resilience may prefer Coca-Cola; those prioritizing income might lean toward PepsiCo.
Which one offers the Superior Shareholder Reward?
I compare The Coca-Cola Company (KO) and PepsiCo, Inc. (PEP) on their 2025 distribution strategies. KO yields 2.9% with a 67% payout ratio, backed by 71% free cash flow coverage and moderate buybacks. PEP delivers a higher 3.9% yield but pays out 93% of net income, with only 63% free cash flow coverage and heavier leverage. KO’s more conservative payout and steady buybacks offer sustainable long-term value. PEP’s aggressive dividend and debt raise risk despite higher immediate yield. I conclude KO provides a superior total shareholder return profile in 2026, balancing yield, buybacks, and financial prudence.
Comparative Score Analysis: The Strategic Profile
The radar chart reveals the fundamental DNA and trade-offs of The Coca-Cola Company and PepsiCo, Inc., highlighting their financial strengths and valuation nuances:
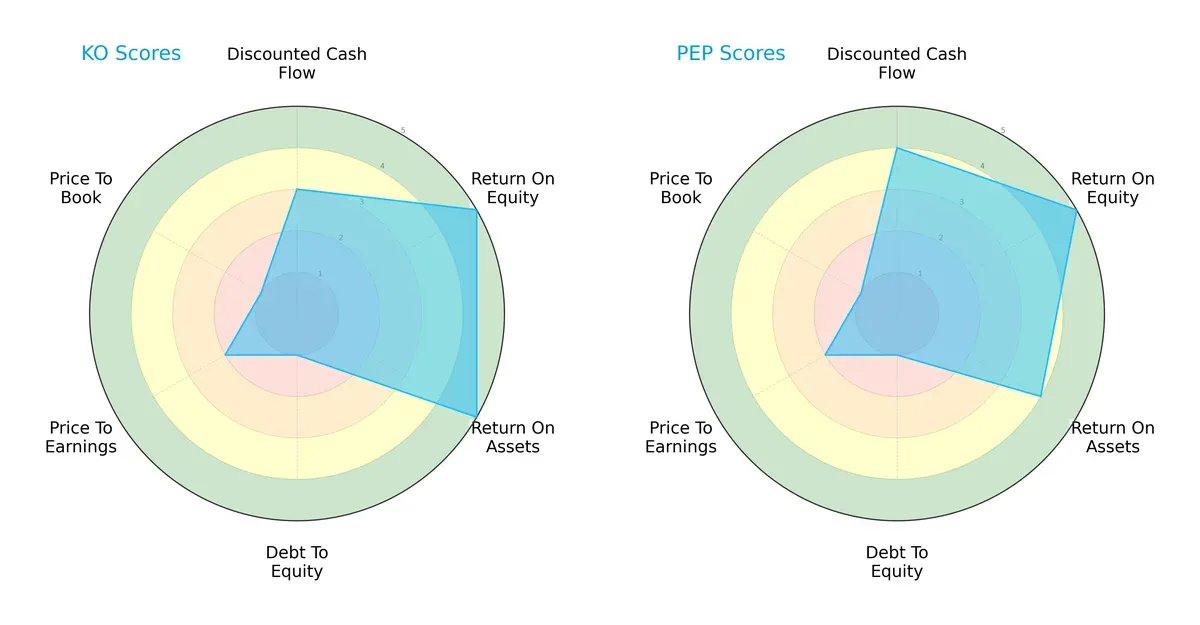
PepsiCo edges ahead with a stronger discounted cash flow score (4 vs. 3) and slightly better asset efficiency (ROA 4 vs. 5 for KO, but KO actually scores 5). Both share very favorable return on equity scores (5). However, both companies struggle with debt-to-equity and valuation metrics, scoring poorly on price-to-earnings and price-to-book ratios (both 1 or 2). Coca-Cola shows a more balanced profitability profile, but PepsiCo leverages a specific advantage in cash flow valuation.
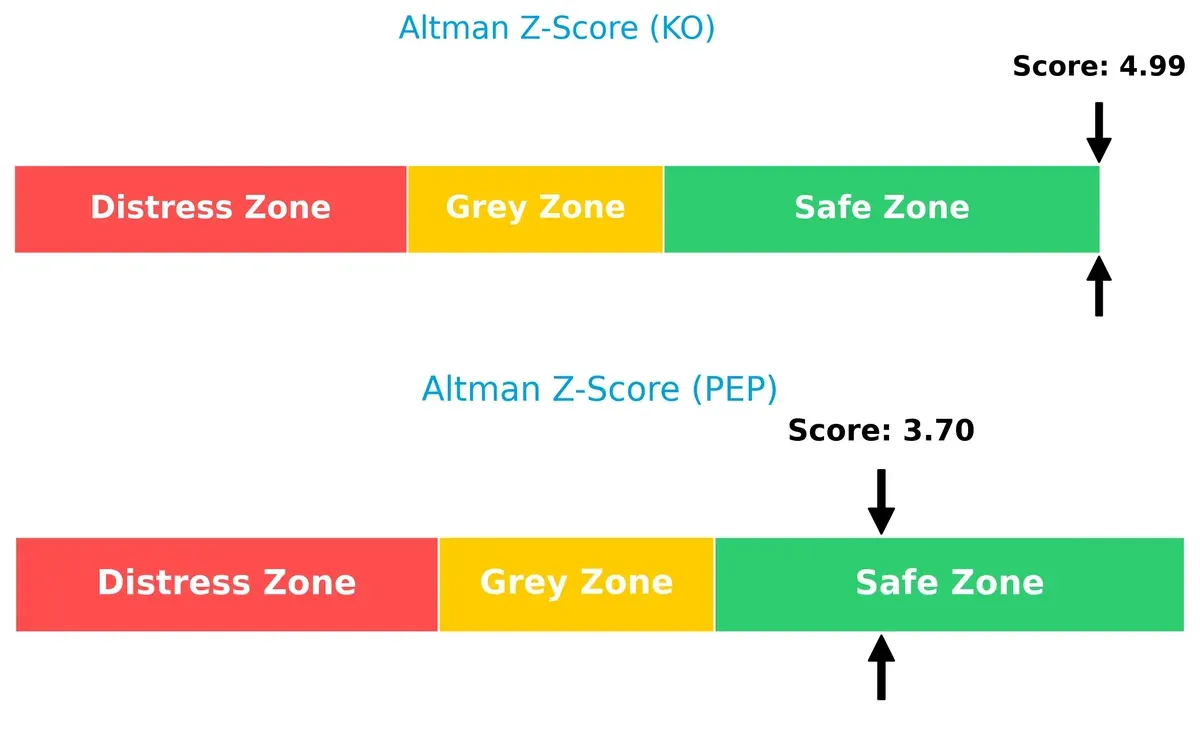
Bankruptcy Risk: Solvency Showdown
The Coca-Cola Company’s Altman Z-Score of 4.99 surpasses PepsiCo’s 3.70, signaling stronger solvency and lower bankruptcy risk in the current market cycle:
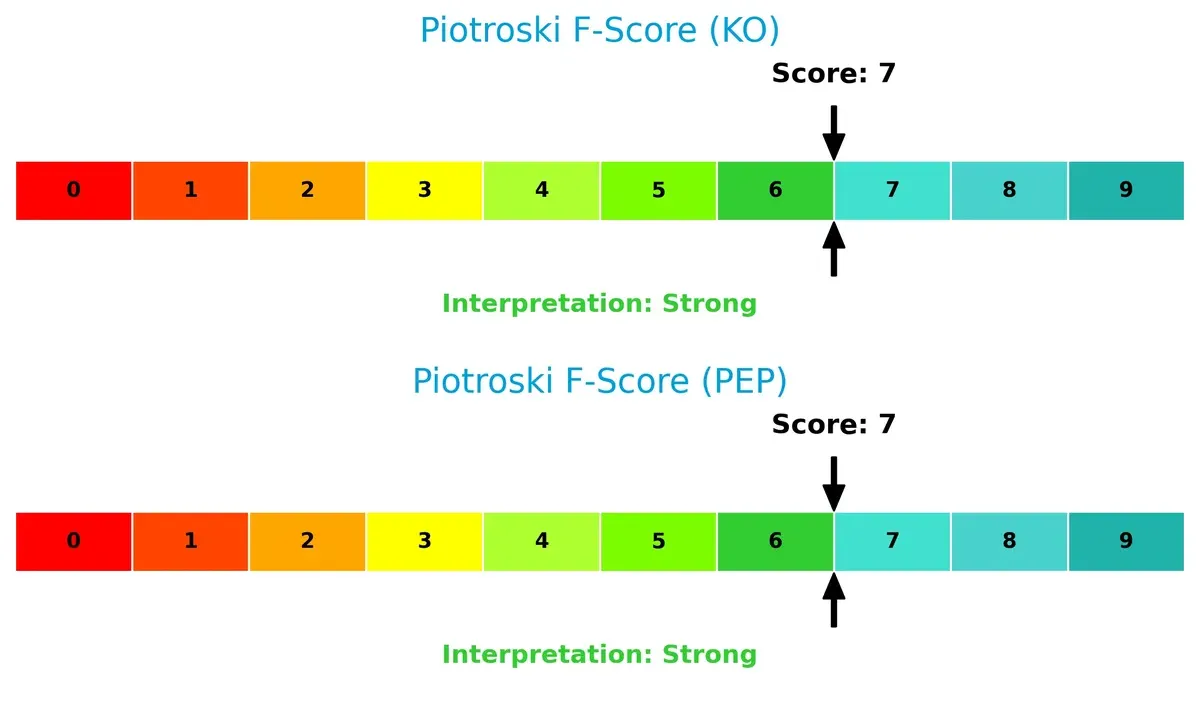
Financial Health: Quality of Operations
Both firms score a robust 7 on the Piotroski F-Score, indicating strong financial health with no immediate red flags in operational quality or internal metrics:
How are the two companies positioned?
This section dissects KO and PEP’s operational DNA by comparing revenue distribution and internal dynamics—strengths and weaknesses. The goal is to confront their economic moats and identify which model offers the most resilient, sustainable advantage today.
Revenue Segmentation: The Strategic Mix
This visual comparison dissects how The Coca-Cola Company and PepsiCo, Inc. diversify their income streams and where their primary sector bets lie:
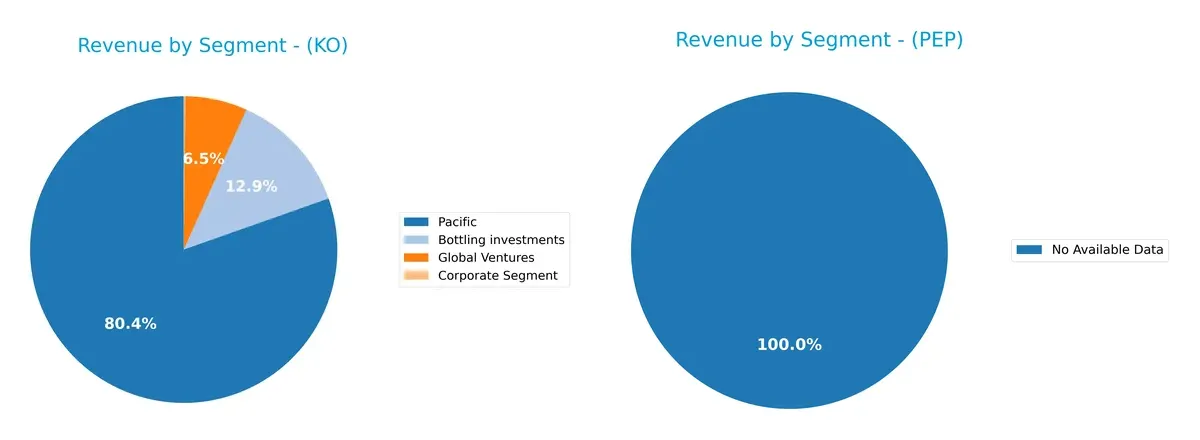
The Coca-Cola Company pivots heavily on its Pacific segment, generating roughly $38.8B in 2024, dwarfing its other streams like Bottling Investments at $6.2B. PepsiCo lacks available data for segmentation. Coca-Cola’s dependence on one dominant segment signals concentration risk but underscores infrastructure dominance. This focus contrasts with PepsiCo’s expected diversified portfolio, highlighting strategic trade-offs between ecosystem lock-in and revenue spread.
Strengths and Weaknesses Comparison
This table compares the strengths and weaknesses of The Coca-Cola Company and PepsiCo, Inc.:
The Coca-Cola Company Strengths
- High net margin at 27.34%
- Favorable ROE at 40.74%
- Strong ROIC (14.16%) above WACC
- Favorable quick ratio (1.25)
- High fixed asset turnover (4.99)
- Solid global revenue diversification across Pacific, Europe, North America, Latin America
PepsiCo, Inc. Strengths
- Favorable ROE (40.38%)
- Positive ROIC (11.3%) above WACC
- Higher dividend yield (3.87%)
- Large U.S. market share with $52B revenue
- Diverse geographic footprint including strong presence in emerging markets
The Coca-Cola Company Weaknesses
- High price-to-book ratio (9.35) unfavorable
- Elevated debt-to-equity ratio (1.41) unfavorable
- Asset turnover low at 0.46
- Moderate current ratio (1.46) neutral
- Some reliance on bottling investments with fluctuating contribution
PepsiCo, Inc. Weaknesses
- Low current ratio (0.85) and quick ratio (0.67) unfavorable
- High debt-to-equity ratio (2.45) unfavorable
- Net margin modest at 8.77% neutral
- Price-to-book ratio high at 9.66 unfavorable
- Asset turnover (0.87) and fixed asset turnover (2.79) only neutral
Both companies demonstrate strong profitability and capital efficiency with ROE above 40% and ROIC exceeding WACC, signaling effective capital allocation. Coca-Cola’s higher net margin and asset turnover reflect operational efficiency, while PepsiCo’s broader geographic and product diversification supports resilience. However, both face leverage concerns and elevated price-to-book ratios, indicating potential valuation risks. These dynamics shape their strategic priorities in balancing growth, financial health, and shareholder returns.
The Moat Duel: Analyzing Competitive Defensibility
A structural moat protects long-term profits from relentless competitive erosion. Without it, market share and margins quickly vanish:
The Coca-Cola Company: Iconic Brand & Global Distribution Moat
Coca-Cola’s moat stems from powerful brand recognition and an extensive bottling network. It sustains high ROIC (9.1% above WACC) with stable margins and growing profitability. New product innovations and expanding markets in emerging regions could deepen this moat further in 2026.
PepsiCo, Inc.: Diversified Portfolio & Scale Advantage
PepsiCo’s moat relies on a broad product mix blending beverages and snacks, contrasting Coca-Cola’s beverage focus. It generates value with a positive ROIC but faces a declining trend (-8%), pressuring margins. Growth opportunities lie in cross-category expansion and emerging markets, though execution risks remain.
Brand Strength vs. Diversification: Who Guards Their Turf Better?
Coca-Cola boasts a wider and deepening moat through brand power and distribution efficiency. PepsiCo creates value but sees eroding profitability, signaling weaker competitive durability. I view Coca-Cola as better equipped to defend market share in the evolving landscape.
Which stock offers better returns?
Over the past year, The Coca-Cola Company’s shares climbed steadily with accelerating gains, while PepsiCo, Inc. faced overall declines despite recent recovery signs.
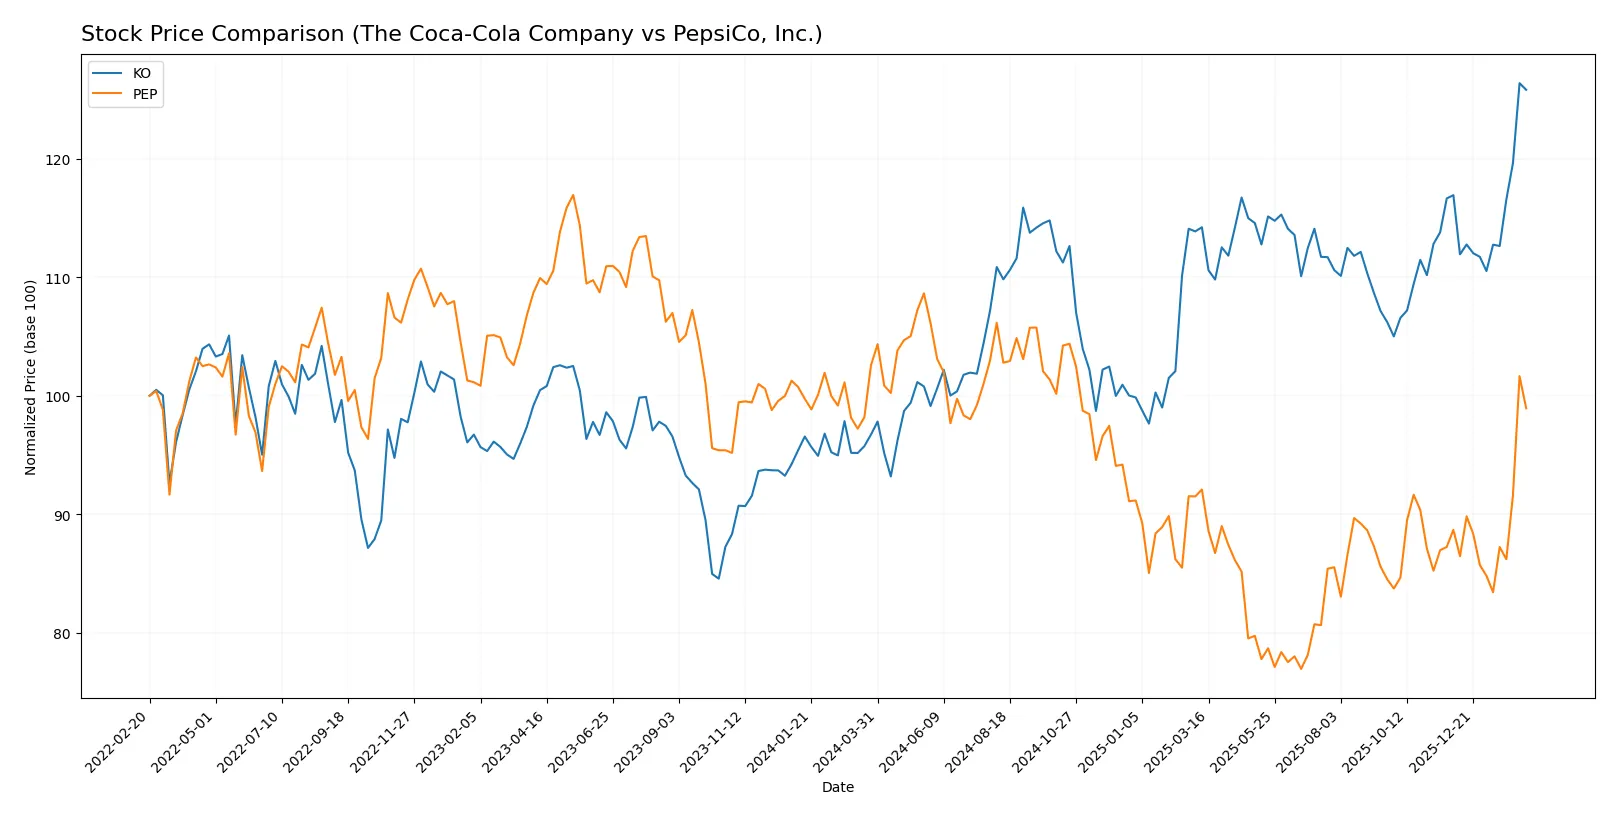
Trend Comparison
The Coca-Cola Company’s stock rose 30.07% over the past 12 months, showing a bullish trend with accelerating momentum and a moderate 4.22 volatility. It hit a high of 79.03 and a low of 58.28.
PepsiCo, Inc. experienced a 3.53% decline over the same period, marking a bearish trend with accelerating losses and higher volatility at 14.66. Its price ranged between 129.07 and 182.19.
Coca-Cola’s stock outperformed PepsiCo’s by delivering a stronger bullish trend and higher total return over the past year despite PepsiCo’s recent positive momentum.
Target Prices
The current analyst consensus shows moderate upside potential for both The Coca-Cola Company and PepsiCo, Inc.
| Company | Target Low | Target High | Consensus |
|---|---|---|---|
| The Coca-Cola Company | 81 | 87 | 84.75 |
| PepsiCo, Inc. | 144 | 191 | 167.75 |
Analysts expect Coca-Cola’s price to rise about 8% from its current 78.68, suggesting steady growth. PepsiCo’s consensus target exceeds its current 165.94 price by roughly 1.1%, signaling more limited near-term upside.

Don’t Let Luck Decide Your Entry Point
Optimize your entry points with our advanced ProRealTime indicators. You’ll get efficient buy signals with precise price targets for maximum performance. Start outperforming now!
How do institutions grade them?
The following tables summarize recent institutional grades for The Coca-Cola Company and PepsiCo, Inc.:
The Coca-Cola Company Grades
Here are the latest ratings from reputable grading firms for The Coca-Cola Company:
| Grading Company | Action | New Grade | Date |
|---|---|---|---|
| Barclays | Maintain | Overweight | 2026-02-12 |
| Jefferies | Maintain | Buy | 2026-02-11 |
| Evercore ISI Group | Maintain | Outperform | 2026-02-11 |
| RBC Capital | Maintain | Outperform | 2026-02-11 |
| UBS | Maintain | Buy | 2026-02-11 |
| JP Morgan | Maintain | Overweight | 2026-02-11 |
| Citigroup | Maintain | Buy | 2026-02-11 |
| Wells Fargo | Maintain | Overweight | 2026-02-09 |
| Jefferies | Maintain | Buy | 2026-02-04 |
| B of A Securities | Maintain | Buy | 2025-11-07 |
PepsiCo, Inc. Grades
Below are recent institutional grades for PepsiCo, Inc. from verified sources:
| Grading Company | Action | New Grade | Date |
|---|---|---|---|
| Citigroup | Maintain | Buy | 2026-02-04 |
| Wells Fargo | Maintain | Equal Weight | 2026-02-04 |
| JP Morgan | Maintain | Overweight | 2026-02-04 |
| UBS | Maintain | Buy | 2026-01-14 |
| Citigroup | Maintain | Buy | 2025-12-17 |
| Barclays | Maintain | Equal Weight | 2025-12-11 |
| JP Morgan | Upgrade | Overweight | 2025-12-10 |
| Piper Sandler | Maintain | Overweight | 2025-12-09 |
| Piper Sandler | Maintain | Overweight | 2025-11-21 |
| Freedom Capital Markets | Downgrade | Hold | 2025-10-23 |
Which company has the best grades?
The Coca-Cola Company consistently receives Buy, Overweight, and Outperform ratings from top institutions, indicating stronger analyst conviction. PepsiCo, Inc. shows more mixed grades, including Equal Weight and a recent Hold downgrade. This divergence may influence investor sentiment and portfolio positioning.
Risks specific to each company
The following categories identify the critical pressure points and systemic threats facing both firms in the 2026 market environment:
1. Market & Competition
The Coca-Cola Company
- Strong brand dominance but faces pressure from health trends and niche competitors.
PepsiCo, Inc.
- Diversified product portfolio offers resilience but intense competition in both beverages and snacks.
2. Capital Structure & Debt
The Coca-Cola Company
- Moderate leverage (D/E 1.41), interest coverage strong at 10.67, but debt-to-equity score very unfavorable.
PepsiCo, Inc.
- Higher leverage (D/E 2.45) with strong interest coverage 10.34, yet debt load remains a significant risk.
3. Stock Volatility
The Coca-Cola Company
- Beta 0.364 indicates lower volatility, offering defensive stability amid market swings.
PepsiCo, Inc.
- Slightly higher beta at 0.416, suggesting marginally greater sensitivity to market fluctuations.
4. Regulatory & Legal
The Coca-Cola Company
- Exposure to sugary drink regulations globally; potential litigation risks remain moderate.
PepsiCo, Inc.
- Broader regulatory exposure due to food segment, increasing complexity and legal scrutiny.
5. Supply Chain & Operations
The Coca-Cola Company
- Relies heavily on independent bottlers, which can create operational bottlenecks.
PepsiCo, Inc.
- Extensive global supply chain complexity across beverages and food increases operational risks.
6. ESG & Climate Transition
The Coca-Cola Company
- Faces pressure to reduce plastic waste and water usage; initiatives underway but costly.
PepsiCo, Inc.
- Must address sustainability in both agriculture and packaging, a broader challenge requiring capital.
7. Geopolitical Exposure
The Coca-Cola Company
- Global footprint with exposure to emerging markets risks but less diversified geographically.
PepsiCo, Inc.
- More diversified geographically but vulnerable to trade tensions affecting multiple regions.
Which company shows a better risk-adjusted profile?
The Coca-Cola Company’s strongest risk is its capital structure, with notable debt concerns despite solid interest coverage. PepsiCo’s greatest risk lies in its complex supply chain and higher leverage, which could amplify operational disruptions. I see Coca-Cola’s lower volatility and safer Altman Z-Score as advantages, but PepsiCo’s broader diversification offers a buffer. Overall, Coca-Cola presents a marginally better risk-adjusted profile, supported by its superior liquidity ratios and stable financial scores despite leverage worries.
Final Verdict: Which stock to choose?
The Coca-Cola Company’s superpower lies in its robust and growing economic moat, driven by superior capital efficiency and consistent value creation. Its point of vigilance is the relatively high leverage, which could pressure financial flexibility. This stock suits portfolios aiming for steady, long-term growth with resilience in competitive markets.
PepsiCo, Inc. commands a strategic moat through its diversified product mix and strong brand portfolio, offering steady cash flows and a slightly safer balance sheet than Coca-Cola. Despite modest recent profitability pressures, it fits well within GARP portfolios seeking balanced growth coupled with reasonable valuation discipline.
If you prioritize sustainable economic moats and strong capital returns, Coca-Cola outshines as a compelling choice due to its growing profitability and operational efficiency. However, if you seek diversification with a tilt toward stability and moderate growth, PepsiCo offers better stability amid market fluctuations despite a less pronounced moat. Both present nuanced scenarios depending on your risk tolerance and strategy.
Disclaimer: Investment carries a risk of loss of initial capital. The past performance is not a reliable indicator of future results. Be sure to understand risks before making an investment decision.
Go Further
I encourage you to read the complete analyses of The Coca-Cola Company and PepsiCo, Inc. to enhance your investment decisions: