Unilever PLC and The Clorox Company both operate in the Household & Personal Products industry, offering a wide range of consumer staples that shape daily life globally. While Unilever boasts a diversified portfolio across beauty, food, and home care, Clorox focuses on cleaning, health, and lifestyle products with strong brand recognition in North America. This comparison explores their market positions and innovation strategies to help you identify the most promising investment opportunity. Let’s discover which company stands out for your portfolio.
Table of contents
Companies Overview
I will begin the comparison between Unilever PLC and The Clorox Company by providing an overview of these two companies and their main differences.
Unilever PLC Overview
Unilever PLC is a global fast-moving consumer goods company headquartered in London, UK. It operates through three main segments: Beauty & Personal Care, Foods & Refreshment, and Home Care. The company offers a wide array of products including skin care, hair care, ice cream, soups, and cleaning products under well-known brands such as Dove, Ben & Jerry’s, and Domestos. Unilever’s mission focuses on sustainable living and innovation within the consumer defensive sector.
The Clorox Company Overview
The Clorox Company, based in Oakland, California, manufactures and markets consumer and professional products worldwide. It operates across four segments: Health and Wellness, Household, Lifestyle, and International. Clorox’s portfolio includes cleaning products, natural personal care, dressings, and water-filtration systems under brands like Clorox, Burt’s Bees, and Brita. The company emphasizes innovation and broad market reach through multiple retail channels in the consumer defensive industry.
Key similarities and differences
Both Unilever and Clorox operate in the consumer defensive sector, offering household and personal care products. While Unilever has a broader geographic and product segment diversification including food and refreshment, Clorox focuses more on cleaning, health, and lifestyle products with a strong presence in professional and international markets. Unilever’s larger scale is reflected in its market cap of 140.6B versus Clorox’s 13.0B, highlighting distinct market positioning and operational scope.
Income Statement Comparison
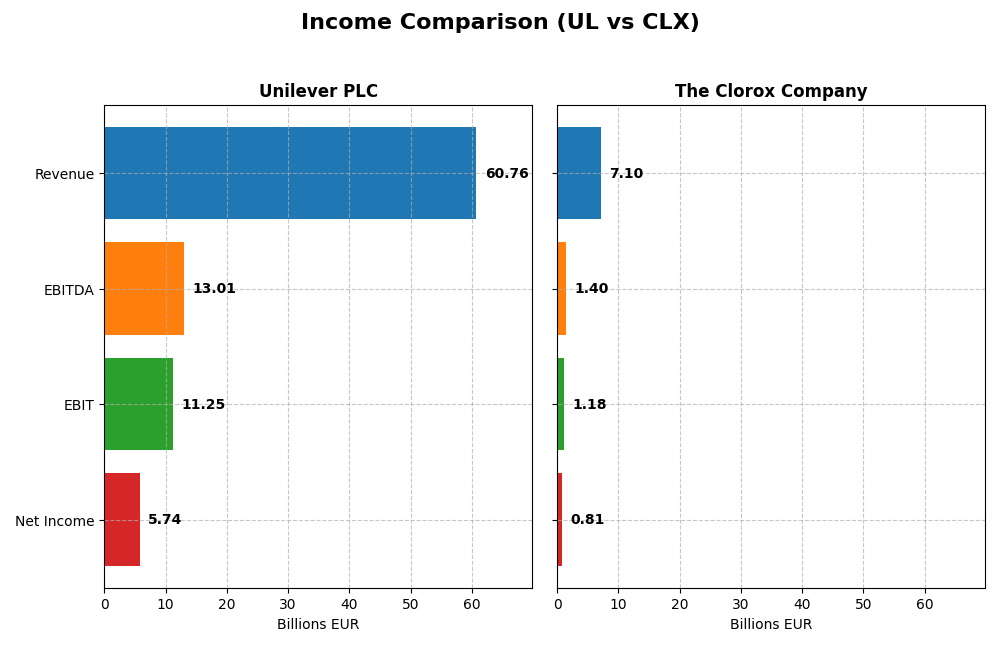
The table below compares the latest fiscal year income statement figures of Unilever PLC and The Clorox Company, providing a clear financial overview for investors.
| Metric | Unilever PLC (UL) | The Clorox Company (CLX) |
|---|---|---|
| Market Cap | 141B EUR | 13B USD |
| Revenue | 60.8B EUR | 7.1B USD |
| EBITDA | 13.0B EUR | 1.4B USD |
| EBIT | 11.3B EUR | 1.2B USD |
| Net Income | 5.7B EUR | 810M USD |
| EPS | 2.30 EUR | 6.56 USD |
| Fiscal Year | 2024 | 2025 |
Income Statement Interpretations
Unilever PLC
Unilever’s revenue rose steadily from €50.7B in 2020 to €60.8B in 2024, reflecting a 19.8% growth over five years. Net income showed a modest overall increase but declined in the latest year to €5.7B from €6.5B in 2023, with net margin contracting by 13.1%. Despite slower revenue growth recently, EBIT margin improved to 18.5%, indicating operational efficiency gains.
The Clorox Company
Clorox’s revenue remained nearly flat, moving from $7.3B in 2021 to $7.1B in 2025, marking a slight overall decline. However, net income increased significantly to $810M in 2025 from $280M in 2024, with net margin expanding strongly by 188.8%. EBIT margin rose to 16.6%, supported by a 135.3% jump in EBIT, signaling a notable turnaround in profitability.
Which one has the stronger fundamentals?
Both companies demonstrate favorable income statement metrics, but Clorox shows a more pronounced improvement in profitability and margins recently, alongside a strong net income growth of 14.1% over the period. Unilever benefits from higher absolute revenue and stable EBIT margins, yet faces margin pressure and slower net income growth. Clorox’s sharper margin expansion contrasts with Unilever’s scale advantage.
Financial Ratios Comparison
The table below presents a side-by-side comparison of key financial ratios for Unilever PLC and The Clorox Company, based on their most recent fiscal year data.
| Ratios | Unilever PLC (2024) | The Clorox Company (2025) |
|---|---|---|
| ROE | 28.7% | 252.3% |
| ROIC | 11.1% | 24.1% |
| P/E | 23.9 | 18.3 |
| P/B | 6.87 | 46.2 |
| Current Ratio | 0.76 | 0.84 |
| Quick Ratio | 0.56 | 0.57 |
| D/E (Debt-to-Equity) | 1.53 | 8.97 |
| Debt-to-Assets | 38.4% | 51.8% |
| Interest Coverage | 8.41 | 11.67 |
| Asset Turnover | 0.76 | 1.28 |
| Fixed Asset Turnover | 5.21 | 4.44 |
| Payout ratio | 75.2% | 74.3% |
| Dividend yield | 3.14% | 4.06% |
Interpretation of the Ratios
Unilever PLC
Unilever’s financial ratios present a mixed picture with favorable returns on equity (28.7%) and invested capital (11.1%), supported by a low WACC of 4.42%. However, liquidity ratios such as the current ratio (0.76) and quick ratio (0.56) are unfavorable, indicating potential short-term liquidity concerns. The company pays dividends with a 3.14% yield, reflecting a stable shareholder return supported by solid coverage.
The Clorox Company
Clorox exhibits strong profitability with a high return on equity (252.3%) and return on invested capital (24.1%), alongside a favorable net margin of 11.4%. Liquidity and leverage ratios, including a current ratio of 0.84 and debt-to-equity of 8.97, are unfavorable, suggesting elevated financial risk. Clorox pays a 4.06% dividend yield, indicating shareholder returns supported by operational cash flow despite higher leverage.
Which one has the best ratios?
Clorox shows a higher proportion of favorable ratios (57.14%) compared to Unilever (42.86%), mainly driven by superior profitability and asset turnover. However, Clorox faces more unfavorable liquidity and leverage metrics, increasing financial risk relative to Unilever. Overall, Clorox’s ratios are more favorable, though accompanied by greater financial leverage and liquidity challenges.
Strategic Positioning
This section compares the strategic positioning of Unilever PLC and The Clorox Company, focusing on market position, key segments, and exposure to technological disruption:
Unilever PLC
- Large market cap of 140.6B USD, low beta 0.223, facing stable competitive pressure in consumer goods industry.
- Operates in Beauty & Personal Care, Foods & Refreshment, and Home Care segments with broad brand portfolio.
- Exposure to disruption not explicitly detailed; operates in traditional fast-moving consumer goods sectors.
The Clorox Company
- Smaller market cap of 13.0B USD, moderate beta 0.575, competing in diverse consumer and professional product markets.
- Operates through Health and Wellness, Household, Lifestyle, and International segments with multiple brands.
- Exposure to disruption not explicitly detailed; operates across several consumer product categories globally.
Unilever PLC vs The Clorox Company Positioning
Unilever has a diversified segment approach across personal care, foods, and home care, whereas Clorox focuses on four specific segments including health and wellness. Unilever’s broader scale contrasts with Clorox’s concentrated yet international segment diversification.
Which has the best competitive advantage?
Clorox exhibits a very favorable moat with growing ROIC indicating durable competitive advantage, while Unilever shows a slightly favorable moat with declining ROIC, suggesting less sustainable profitability over recent years.
Stock Comparison
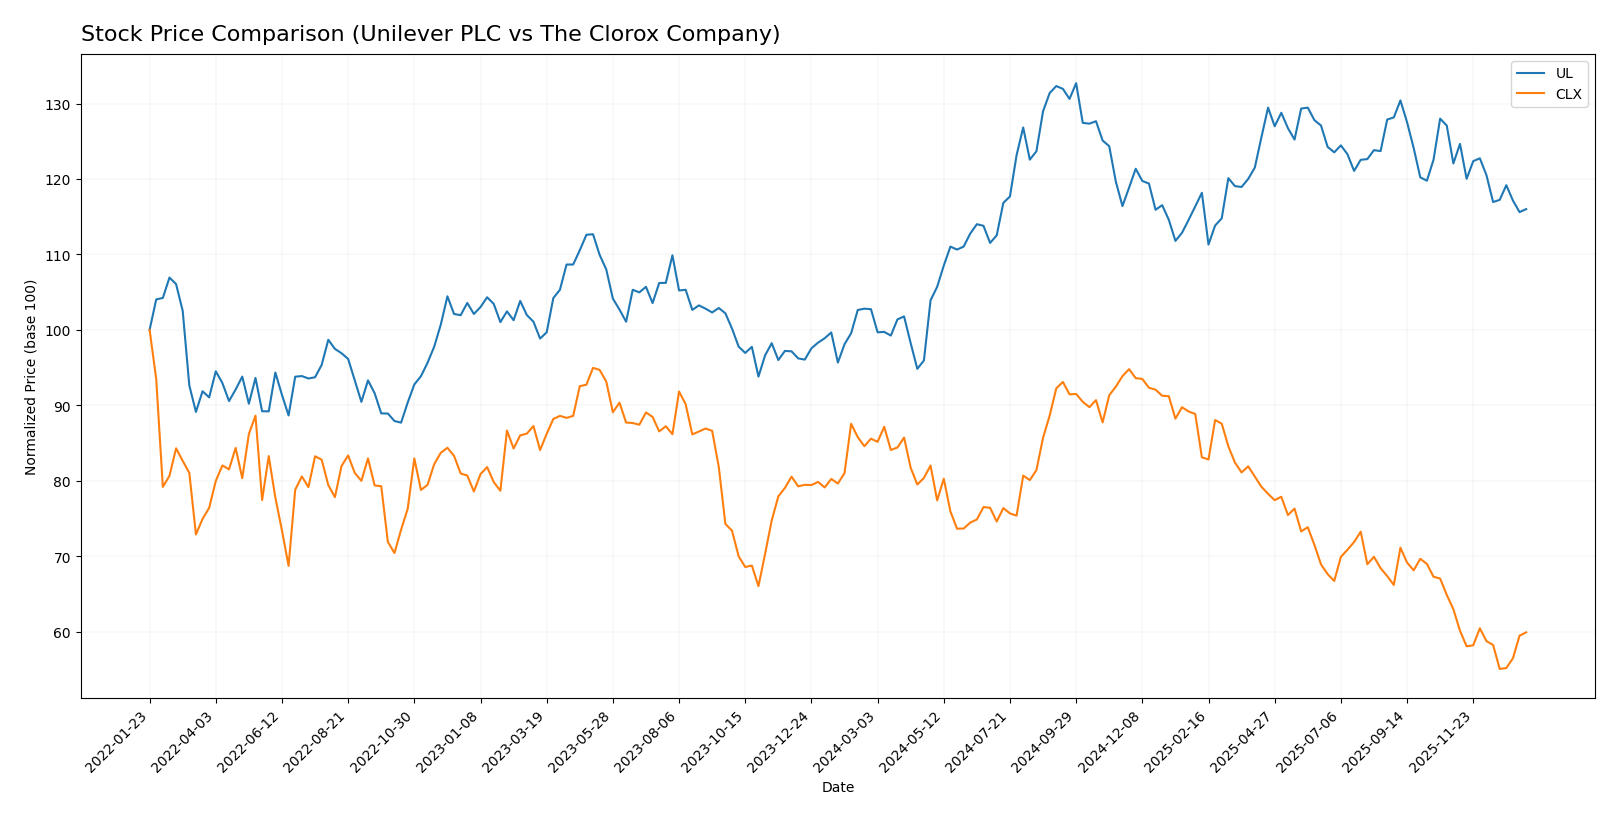
The stock price movements of Unilever PLC and The Clorox Company over the past 12 months reveal distinct trading dynamics and performance trajectories, with Unilever showing a positive trend while Clorox experienced a significant decline.
Trend Analysis
Unilever PLC’s stock exhibited a bullish trend over the past year with a 12.92% increase, accompanied by decelerating momentum and a price range between 52.66 and 73.69. Recent weeks show a slight negative slope of -4.96%.
The Clorox Company’s stock followed a bearish trend with a 30.01% decline over the year, high volatility at 19.09 std deviation, and decelerating trend. Recent trend continues downward at -4.87% with increased volatility.
Comparing these trends, Unilever delivered the highest market performance with a positive gain, while Clorox’s stock showed a significant loss in value over the same period.
Target Prices
Analyst consensus provides a clear outlook on target prices for Unilever PLC and The Clorox Company.
| Company | Target High | Target Low | Consensus |
|---|---|---|---|
| Unilever PLC | 71 | 60.1 | 65.55 |
| The Clorox Company | 152 | 94 | 118.33 |
The target consensus for Unilever PLC slightly exceeds its current price of 64.42 USD, suggesting modest upside potential. The Clorox Company’s consensus target of 118.33 USD is significantly above its current 106.98 USD, indicating stronger expected growth.
Analyst Opinions Comparison
This section compares analysts’ ratings and grades for Unilever PLC and The Clorox Company:
Rating Comparison
UL Rating
- Rating: B+, considered Very Favorable by analysts.
- Discounted Cash Flow Score: 5, indicating very favorable valuation outlook.
- ROE Score: 5, showing very efficient profit generation from equity.
- ROA Score: 4, a favorable rating on asset utilization.
- Debt To Equity Score: 1, classified as very unfavorable financial stability.
- Overall Score: 3, reflecting a moderate overall financial standing.
CLX Rating
- Rating: B-, also considered Very Favorable by analysts.
- Discounted Cash Flow Score: 5, indicating very favorable valuation outlook.
- ROE Score: 1, indicating very unfavorable efficiency in profit generation.
- ROA Score: 5, a very favorable rating on asset utilization.
- Debt To Equity Score: 1, also very unfavorable, indicating higher financial risk.
- Overall Score: 3, also reflecting a moderate overall financial standing.
Which one is the best rated?
Based strictly on the data, UL has a higher ROE score while CLX excels in ROA. Both share identical overall and discounted cash flow scores. UL’s rating is B+ versus CLX’s B-, making UL slightly better rated overall.
Scores Comparison
Here is a comparison of the Altman Z-Score and Piotroski Score for Unilever PLC and The Clorox Company:
Unilever PLC Scores
- Altman Z-Score: 4.85, indicating a safe zone status.
- Piotroski Score: 6, reflecting an average financial strength.
The Clorox Company Scores
- Altman Z-Score: 3.19, also within the safe zone.
- Piotroski Score: 5, showing an average financial strength.
Which company has the best scores?
Unilever PLC has a higher Altman Z-Score and Piotroski Score than The Clorox Company, indicating comparatively stronger financial stability and average financial health based on the provided data.
Grades Comparison
The following presents a detailed comparison of the recent grades assigned to Unilever PLC and The Clorox Company:
Unilever PLC Grades
This table summarizes the latest grades from recognized grading companies for Unilever PLC.
| Grading Company | Action | New Grade | Date |
|---|---|---|---|
| Erste Group | Hold | Hold | 2024-11-19 |
| B of A Securities | Upgrade | Buy | 2024-08-22 |
| JP Morgan | Upgrade | Overweight (Buy equivalent) | 2024-05-23 |
| Argus Research | Maintain | Buy | 2024-05-08 |
| Morgan Stanley | Downgrade | Underweight (Sell equivalent) | 2024-02-27 |
| Bernstein | Upgrade | Market Perform (Hold equivalent) | 2022-03-14 |
| Bernstein | Upgrade | Market Perform (Hold equivalent) | 2022-03-13 |
| Bernstein | Upgrade | Market Perform (Hold equivalent) | 2021-11-01 |
| Bernstein | Upgrade | Market Perform (Hold equivalent) | 2021-10-31 |
| Deutsche Bank | Downgrade | Hold | 2021-09-16 |
The grades for Unilever PLC show a mixed but generally stable trend clustered around Hold and Buy ratings, with some recent downgrades balanced by earlier upgrades.
The Clorox Company Grades
This table summarizes the latest grades from recognized grading companies for The Clorox Company.
| Grading Company | Action | New Grade | Date |
|---|---|---|---|
| TD Cowen | Maintain | Hold | 2026-01-08 |
| Goldman Sachs | Maintain | Sell | 2026-01-07 |
| Wells Fargo | Maintain | Equal Weight (Hold equivalent) | 2026-01-05 |
| Citigroup | Maintain | Neutral (Hold equivalent) | 2025-12-17 |
| Morgan Stanley | Maintain | Equal Weight (Hold equivalent) | 2025-11-04 |
| JP Morgan | Maintain | Neutral (Hold equivalent) | 2025-11-04 |
| Wells Fargo | Maintain | Equal Weight (Hold equivalent) | 2025-11-04 |
| Citigroup | Maintain | Neutral (Hold equivalent) | 2025-11-04 |
| JP Morgan | Maintain | Neutral (Hold equivalent) | 2025-10-10 |
| Citigroup | Maintain | Neutral (Hold equivalent) | 2025-10-09 |
The Clorox Company’s grades are consistently steady, predominantly reflecting Hold or equivalent ratings, with no recent upgrades or downgrades.
Which company has the best grades?
Unilever PLC has received a broader range of grades including several Buy upgrades, indicating slightly more favorable analyst sentiment compared to The Clorox Company, whose ratings are uniformly Hold or Sell. This difference may influence investors seeking more positive analyst momentum.
Strengths and Weaknesses
Below is a comparative table highlighting key strengths and weaknesses of Unilever PLC (UL) and The Clorox Company (CLX) based on the most recent financial and strategic data.
| Criterion | Unilever PLC (UL) | The Clorox Company (CLX) |
|---|---|---|
| Diversification | Broad global FMCG portfolio but less segmented publicly | Diversified with strong segments in Health & Wellness, Household, International, Lifestyle |
| Profitability | ROIC 11.12%, ROE 28.73%, net margin 9.45% (slightly favorable) | ROIC 24.14%, ROE 252.34%, net margin 11.4% (favorable) |
| Innovation | Moderate innovation with some declining ROIC trend (-9.5%) | Strong innovation with growing ROIC trend (+13.7%) |
| Global presence | Very strong global footprint, but some financial leverage concerns (Debt/Equity 1.53) | Strong but more regional focus; higher debt leverage (Debt/Equity 8.97) |
| Market Share | Established global market share with stable returns | Growing market share in key segments, supported by increasing revenues |
Key takeaways: Clorox demonstrates stronger profitability and innovation momentum with a very favorable moat, but carries higher financial leverage risks. Unilever offers stable global diversification but faces challenges with declining profitability trends and moderate financial ratios. Investors should weigh growth potential against financial risk tolerance.
Risk Analysis
Below is a comparative table summarizing key risks for Unilever PLC (UL) and The Clorox Company (CLX) based on the most recent financial and operational data:
| Metric | Unilever PLC (UL) | The Clorox Company (CLX) |
|---|---|---|
| Market Risk | Low beta 0.223 indicates lower volatility | Moderate beta 0.575 suggests higher sensitivity to market swings |
| Debt Level | Debt-to-equity 1.53 (unfavorable), debt-to-assets 38.44% (neutral) | High debt-to-equity 8.97 and debt-to-assets 51.79% (unfavorable) |
| Regulatory Risk | Medium, due to global operations and consumer product regulations | Medium, with US focus but diverse product regulations |
| Operational Risk | Large workforce (116K) may present complexity in management | Smaller workforce (7.4K) reduces complexity but limits scale flexibility |
| Environmental Risk | Growing pressure on sustainability given product portfolio | Increasing focus on eco-friendly products but legacy chemical products pose challenges |
| Geopolitical Risk | Exposure to multiple regions including UK and emerging markets | Primarily US-based, with some international exposure |
The most impactful and likely risks are Unilever’s moderate leverage combined with operational complexity due to its scale, and Clorox’s high debt level which elevates financial risk. Both face regulatory and environmental pressures common in consumer goods, but Clorox’s financial structure warrants closer scrutiny for risk-averse investors.
Which Stock to Choose?
Unilever PLC (UL) shows a favorable income statement with solid gross and EBIT margins but mixed income growth. Its financial ratios are slightly favorable, highlighted by strong ROE and ROIC, though burdened by high debt and weak liquidity. Ratings remain very favorable with a B+ score.
The Clorox Company (CLX) presents a consistently favorable income statement with growing net margin and EPS. Financial ratios are overall favorable, featuring high ROE and asset turnover despite significant leverage and liquidity concerns. It holds a very favorable B- rating.
Investors focused on durable profitability and increasing returns might find CLX appealing due to its very favorable moat and improving income metrics, while those valuing stability with moderate risk could view UL’s slightly favorable ratios and solid ratings as indicative of steady performance.
Disclaimer: Investment carries a risk of loss of initial capital. The past performance is not a reliable indicator of future results. Be sure to understand risks before making an investment decision.
Go Further
I encourage you to read the complete analyses of Unilever PLC and The Clorox Company to enhance your investment decisions: