Home > Comparison > Consumer Defensive > PG vs CLX
The strategic rivalry between The Procter & Gamble Company and The Clorox Company shapes the competitive landscape of the Consumer Defensive sector. P&G operates as a diversified, global consumer products powerhouse, while Clorox is a focused manufacturer emphasizing household and health-related brands. This head-to-head reflects a contest between scale-driven market leadership and niche specialization. This analysis aims to identify which corporate path delivers superior risk-adjusted returns for a diversified portfolio.
Table of contents
Companies Overview
The Procter & Gamble Company and The Clorox Company compete fiercely in the global household and personal products market.
The Procter & Gamble Company: Global Consumer Goods Powerhouse
The Procter & Gamble Company dominates with a diverse portfolio across Beauty, Grooming, Health Care, Fabric & Home Care, and Baby, Feminine & Family Care. Its revenue stems from branded consumer packaged goods sold worldwide through mass merchandisers and e-commerce. In 2026, P&G focuses on innovation and global market penetration to sustain its leadership.
The Clorox Company: Specialty Household & Wellness Leader
Clorox operates through Health and Wellness, Household, Lifestyle, and International segments. It generates revenue from cleaning products, personal care, and lifestyle brands such as Clorox, Brita, and Burt’s Bees. The company emphasizes expanding its health-oriented product lines and international reach as its core strategic priorities in 2026.
Strategic Collision: Similarities & Divergences
Both companies rely on strong brand portfolios in household and personal care but differ in scope and scale. P&G pursues a broad consumer goods approach with global scale, while Clorox targets niche wellness and specialty markets. Their primary battleground lies in product innovation and channel expansion. The two exhibit contrasting investment profiles: P&G as a massive, diversified giant, and Clorox as a focused, growth-oriented challenger.
Income Statement Comparison
This data dissects the core profitability and scalability of both corporate engines to reveal who dominates the bottom line:
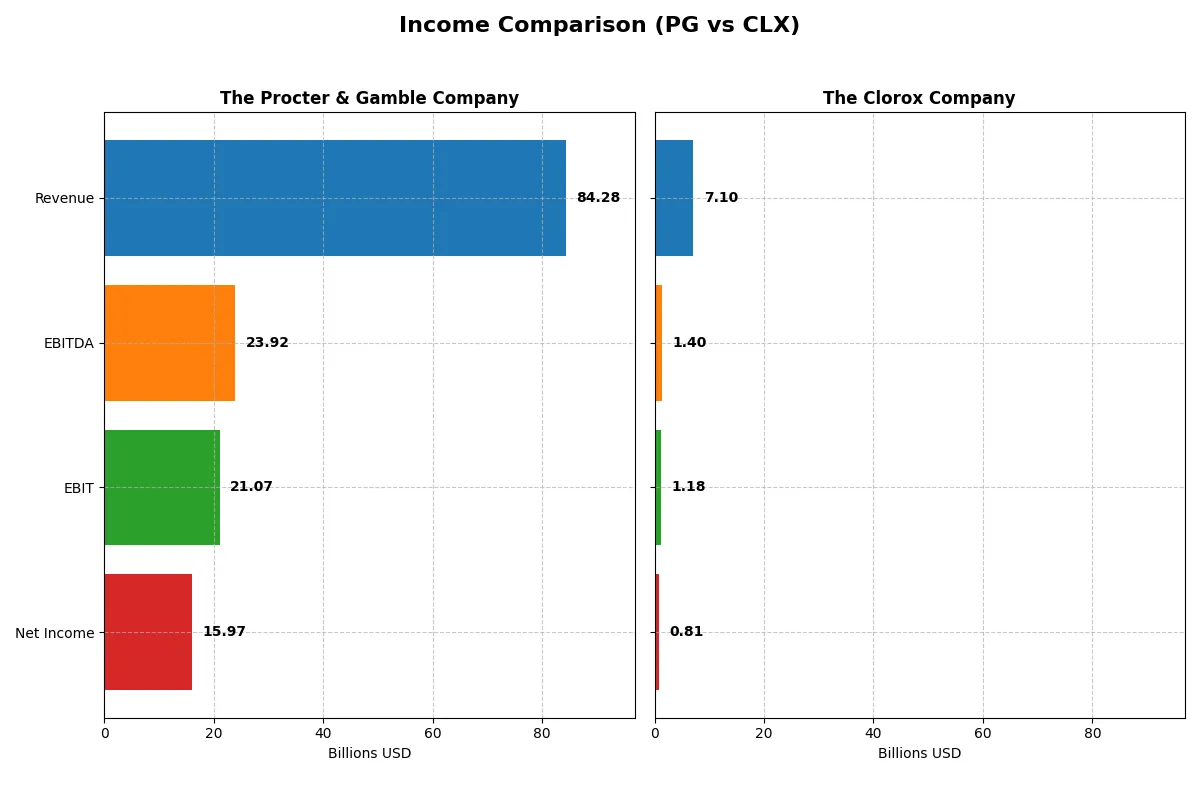
| Metric | The Procter & Gamble Company (PG) | The Clorox Company (CLX) |
|---|---|---|
| Revenue | 84.3B | 7.1B |
| Cost of Revenue | 41.2B | 3.9B |
| Operating Expenses | 22.7B | 2.0B |
| Gross Profit | 43.1B | 3.2B |
| EBITDA | 23.9B | 1.4B |
| EBIT | 21.1B | 1.2B |
| Interest Expense | 907M | 101M |
| Net Income | 15.97B | 810M |
| EPS | 6.67 | 6.56 |
| Fiscal Year | 2025 | 2025 |
Income Statement Analysis: The Bottom-Line Duel
This income statement comparison reveals which company operates with greater efficiency and delivers stronger profitability through its corporate engine.
The Procter & Gamble Company Analysis
P&G sustains robust revenue growth, reaching $84.3B in 2025 with net income climbing to $15.97B. Its gross margin holds steady above 51%, and net margin improves to 18.95%, reflecting tight cost control. The 2025 year shows solid momentum with EBIT rising 7% and EPS up 8%, signaling efficient capital deployment.
The Clorox Company Analysis
Clorox’s revenue remains stable around $7.1B in 2025, while net income surges to $810M, more than doubling from the prior year. Its gross margin improves to 44.96%, and net margin expands sharply to 11.4%. The company exhibits strong operational leverage, with EBIT growing 135% and EPS nearly tripling, highlighting renewed profitability momentum.
Margin Discipline vs. Earnings Acceleration
P&G dominates with scale and consistently healthy margins, delivering steady profit and EPS growth over five years. Clorox impresses with rapid earnings acceleration and margin expansion despite flat revenue. For investors, P&G’s profile suits those valuing stable, high-margin cash flow, while Clorox appeals to seekers of dynamic profit improvement.
Financial Ratios Comparison
These vital ratios act as a diagnostic tool to expose the underlying fiscal health, valuation premiums, and capital efficiency of each company:
| Ratios | The Procter & Gamble Company (PG) | The Clorox Company (CLX) |
|---|---|---|
| ROE | 30.7% | 252.3% |
| ROIC | 16.5% | 24.1% |
| P/E | 24.5 | 18.3 |
| P/B | 7.52 | 46.20 |
| Current Ratio | 0.70 | 0.84 |
| Quick Ratio | 0.49 | 0.57 |
| D/E (Debt-to-Equity) | 0.68 | 8.97 |
| Debt-to-Assets | 28.3% | 51.8% |
| Interest Coverage | 22.5 | 11.7 |
| Asset Turnover | 0.67 | 1.28 |
| Fixed Asset Turnover | 3.53 | 4.44 |
| Payout Ratio | 61.8% | 74.3% |
| Dividend Yield | 2.52% | 4.06% |
| Fiscal Year | 2025 | 2025 |
Efficiency & Valuation Duel: The Vital Signs
Financial ratios serve as a company’s DNA, exposing hidden risks and operational strengths critical for investment insight.
The Procter & Gamble Company
Procter & Gamble delivers robust profitability with a 30.7% ROE and an 18.95% net margin, signaling operational strength. Its P/E ratio of 24.5 suggests a fairly valued stock, though a high P/B of 7.5 flags a premium asset valuation. The 2.5% dividend yield highlights steady shareholder returns through dividends, reflecting disciplined capital allocation.
The Clorox Company
Clorox shows extraordinary ROE at 252%, driven by financial leverage, yet a modest 11.4% net margin. Its P/E of 18.3 appears reasonable, but an elevated P/B of 46.2 and high debt-to-equity ratio of 8.97 raise caution. Clorox offers a 4.1% dividend yield, emphasizing strong cash returns despite heavier leverage and risk.
Premium Valuation vs. Leverage-Driven Returns
Both companies maintain favorable overall ratios, but Procter & Gamble balances operational efficiency and valuation more prudently. Clorox’s outsized ROE leverages debt aggressively, increasing risk despite appealing dividends. Investors prioritizing stable profitability and moderate risk may prefer Procter & Gamble, while those seeking higher yield amid leverage might consider Clorox.
Which one offers the Superior Shareholder Reward?
I see The Procter & Gamble Company (PG) and The Clorox Company (CLX) pursue contrasting shareholder rewards. PG maintains a steady dividend yield near 2.5% with a payout ratio around 62%, supported by strong free cash flow coverage above 80%. PG’s share buybacks add to total returns, signaling disciplined capital allocation. CLX offers a higher dividend yield exceeding 3.5% but with payout ratios often above 100%, raising sustainability concerns. CLX’s aggressive debt profile and volatile earnings risk future dividends despite buybacks. I conclude PG offers the more sustainable and attractive total return profile in 2026.
Comparative Score Analysis: The Strategic Profile
The radar chart reveals the fundamental DNA and trade-offs of The Procter & Gamble Company and The Clorox Company, highlighting their distinct financial strengths and weaknesses:
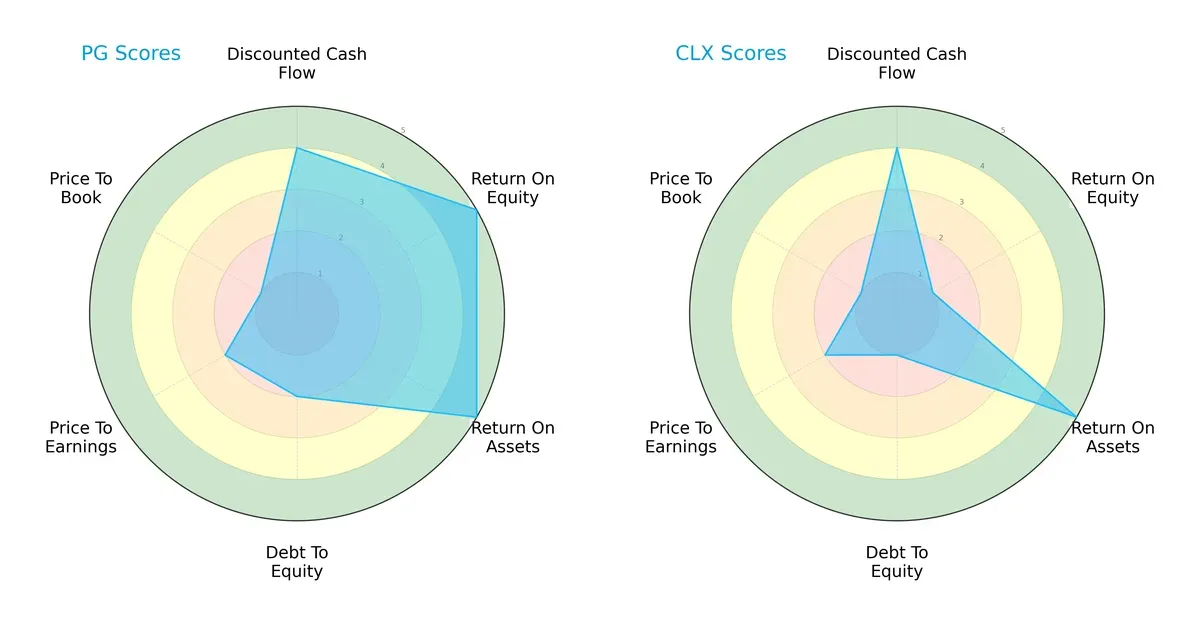
The Procter & Gamble demonstrates a more balanced profile with strong ROE and ROA scores (5 each), indicating efficient profit generation and asset use. Clorox matches P&G in asset efficiency (ROA 5) but lags significantly in ROE (1), signaling weaker equity profitability. Both firms share similar DCF scores (4) and moderate P/E valuations (2), but P&G’s moderate debt-to-equity score (2) is superior to Clorox’s weak balance sheet (1). Valuation metrics (P/B) are equally unfavorable (1) for both, suggesting market skepticism about book value. Overall, P&G offers more stability, while Clorox relies heavily on asset utilization as its edge.
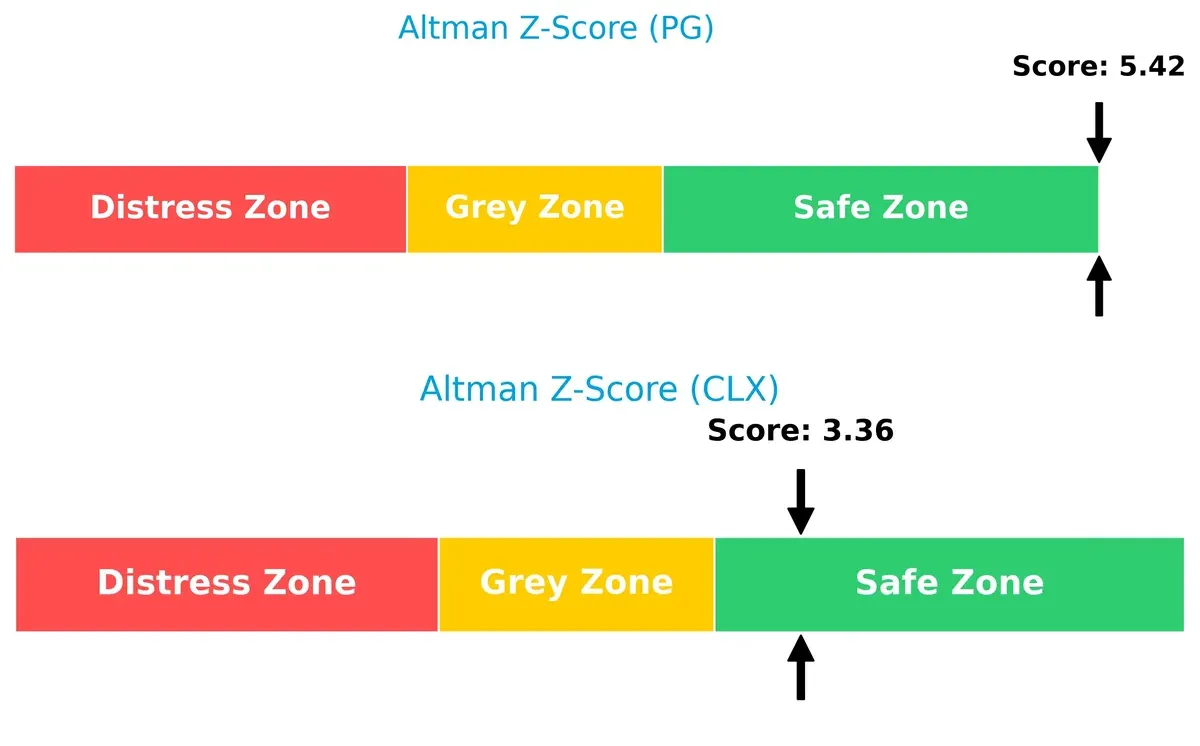
Bankruptcy Risk: Solvency Showdown
The Procter & Gamble’s Altman Z-Score of 5.42 versus Clorox’s 3.36 indicates a stronger solvency position for P&G, placing both comfortably in the safe zone but highlighting P&G’s superior financial resilience in this cycle:
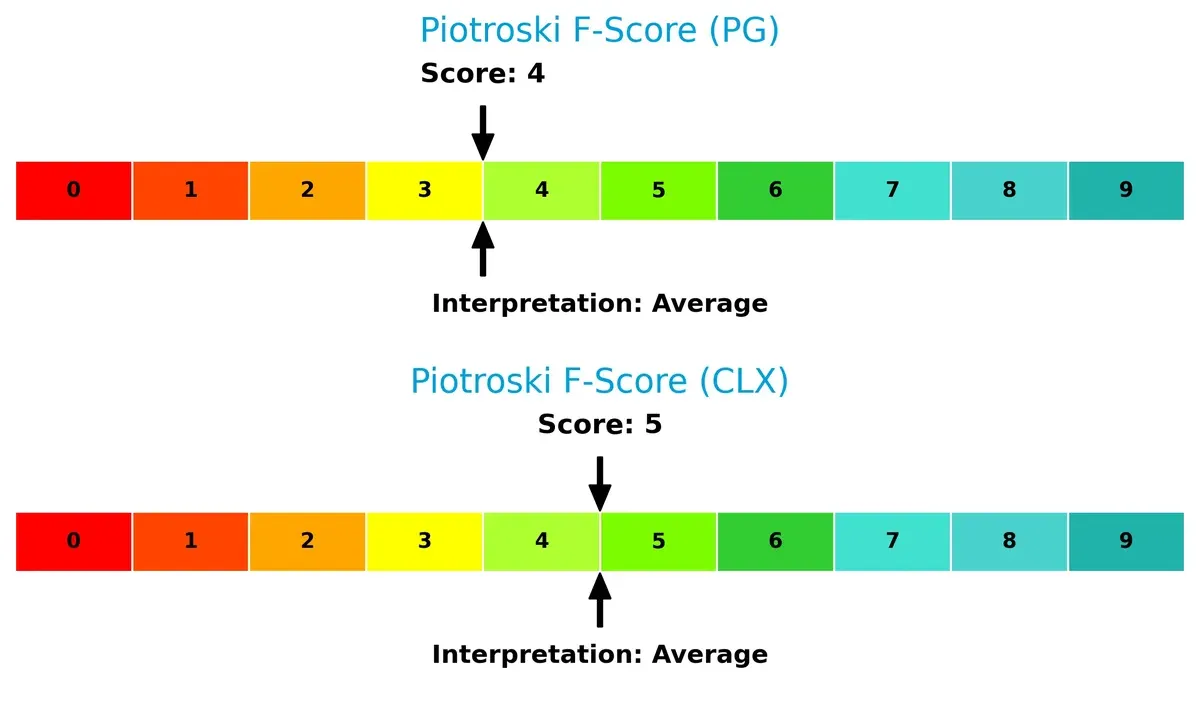
Financial Health: Quality of Operations
Clorox edges out P&G with a Piotroski F-Score of 5 versus 4, both scoring in the average range. This suggests Clorox maintains slightly better operational quality and internal financial metrics, though neither company shows peak financial health or major red flags:
How are the two companies positioned?
This section dissects the operational DNA of PG and CLX by comparing their revenue distribution by segment and internal dynamics, including strengths and weaknesses. The final goal is to confront their economic moats to determine which model offers the most resilient, sustainable competitive advantage today.
Revenue Segmentation: The Strategic Mix
This visual comparison dissects how The Procter & Gamble Company and The Clorox Company diversify their income streams and where their primary sector bets lie:
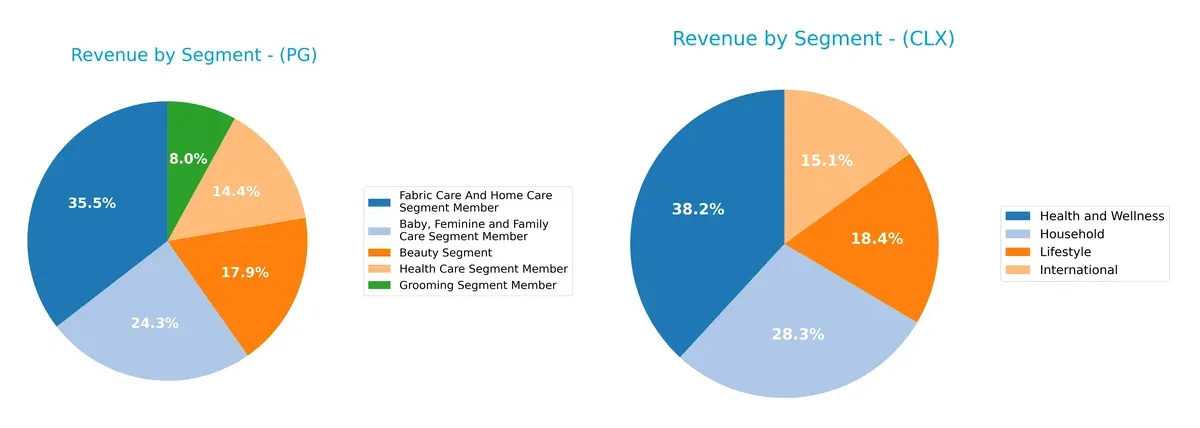
Procter & Gamble anchors revenue in Fabric Care & Home Care at $29.6B, dwarfing its next largest segment, Baby, Feminine & Family Care at $20.2B. This mix shows strong ecosystem lock-in with broad product categories. Clorox, by contrast, presents a more balanced portfolio: Health and Wellness leads at $2.7B, closely followed by Household at $2B and Lifestyle at $1.3B. Clorox’s diversification reduces concentration risk but limits scale dominance compared to P&G’s infrastructure strength.
Strengths and Weaknesses Comparison
This table compares the strengths and weaknesses of The Procter & Gamble Company and The Clorox Company:
PG Strengths
- Broad product diversification across six major segments
- Strong profitability with 18.95% net margin and 30.71% ROE
- Favorable capital efficiency with 16.47% ROIC vs 5.4% WACC
- Balanced geographic revenue split near $42.7B Non-US and $41.6B US
- Solid interest coverage at 23.23 and dividend yield of 2.52%
CLX Strengths
- High ROE at 252.34% and ROIC of 24.14% showing efficient capital use
- Favorable profitability with 11.4% net margin
- Higher asset turnover at 1.28 and fixed asset turnover of 4.44
- Dividend yield of 4.06% and favorable interest coverage at 11.67
- Product focus includes Health and Wellness, Household, and International markets
PG Weaknesses
- Low liquidity ratios with current ratio at 0.7 and quick ratio at 0.49
- Unfavorable price-to-book at 7.52 indicating possible overvaluation
- Moderate leverage with debt-to-assets at 28.32%
- Neutral debt-to-equity at 0.68 and asset turnover at 0.67
- PE ratio neutral at 24.48
CLX Weaknesses
- Very high debt-to-equity of 8.97 and debt-to-assets at 51.79%
- Low liquidity with current ratio of 0.84 and quick ratio of 0.57
- Unfavorable price-to-book at 46.2 suggests valuation risk
- Lower interest coverage at 11.67 vs PG
- PE ratio neutral at 18.31, but leverage raises risk profile
Overall, PG shows diversified revenue streams and strong profitability with good capital efficiency but faces liquidity challenges and valuation concerns. CLX exhibits exceptional capital returns and dividend yield but carries significant leverage and liquidity risks. These factors shape each company’s strategic financial posture.
The Moat Duel: Analyzing Competitive Defensibility
A structural moat alone shields long-term profits from relentless competition and market pressure. Let’s dissect how these moats protect value for two industry players:
The Procter & Gamble Company: Brand Power & Scale Lock-in
P&G’s moat rests on powerful brand equity and scale economies. This drives stable 25% EBIT margins and 19% net margins. Expansion into health and beauty deepens defensibility in 2026.
The Clorox Company: Niche Cost Advantage and Innovation
Clorox leverages specialized cleaning products and cost discipline, allowing a 16.6% EBIT margin and rapidly growing ROIC. Innovation in health/wellness segments boosts future growth prospects.
Scale Dominance vs. Focused Innovation: The Moat Faceoff
Both companies create value with ROIC well above WACC and rising trends. However, Clorox’s steeper ROIC growth and niche innovation signals a deeper moat. P&G’s broad scale offers wider but less rapidly expanding protection. Clorox stands better poised to defend market share through agility and margin expansion.
Which stock offers better returns?
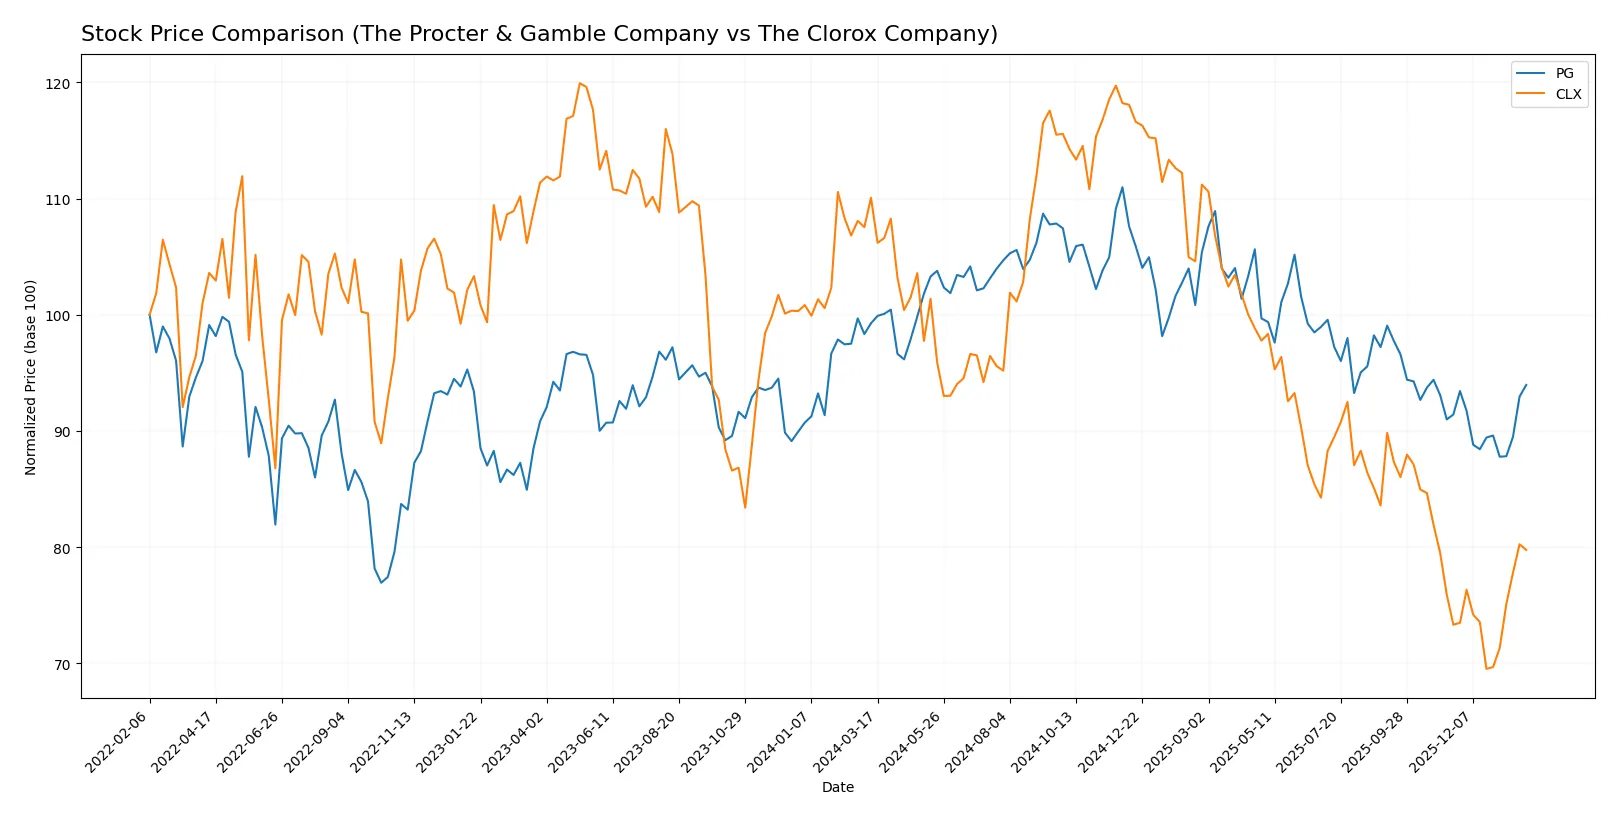
The past year reveals contrasting stock trajectories: The Procter & Gamble Company’s price declined steadily before showing a modest recent recovery, while The Clorox Company faced a sharper drop but gained stronger momentum late in the period.
Trend Comparison
The Procter & Gamble Company’s stock fell 5.35% over the past 12 months, marking a bearish trend with accelerating decline. A recent 2.78% gain suggests mild recovery momentum since November 2025.
The Clorox Company’s stock dropped 27.54% in the same timeframe, reflecting a pronounced bearish trend with accelerating losses. Yet a recent 8.79% rise points to stronger short-term rebound potential since late 2025.
Comparing both, The Procter & Gamble Company outperformed The Clorox Company over the past year, despite both showing recent upward trends. PG delivered the highest market performance overall.
Target Prices
Analysts present a cautiously optimistic consensus for these consumer defensive giants.
| Company | Target Low | Target High | Consensus |
|---|---|---|---|
| The Procter & Gamble Company | 150 | 179 | 165.67 |
| The Clorox Company | 94 | 152 | 117.71 |
Procter & Gamble’s consensus target of 165.67 suggests a modest upside from its current 151.77 price. Clorox’s 117.71 target also indicates upside potential versus its current 112.79 share price.

Don’t Let Luck Decide Your Entry Point
Optimize your entry points with our advanced ProRealTime indicators. You’ll get efficient buy signals with precise price targets for maximum performance. Start outperforming now!
How do institutions grade them?
Below is a comparison of recent institutional grades for The Procter & Gamble Company and The Clorox Company:
The Procter & Gamble Company Grades
This table shows the latest grades from major grading firms for PG:
| Grading Company | Action | New Grade | Date |
|---|---|---|---|
| TD Cowen | Downgrade | Hold | 2026-01-27 |
| UBS | Maintain | Buy | 2026-01-23 |
| JP Morgan | Upgrade | Overweight | 2026-01-23 |
| Wells Fargo | Maintain | Overweight | 2026-01-23 |
| UBS | Maintain | Buy | 2026-01-14 |
| TD Cowen | Maintain | Buy | 2026-01-08 |
| Wells Fargo | Maintain | Overweight | 2026-01-05 |
| JP Morgan | Maintain | Neutral | 2025-12-18 |
| Jefferies | Upgrade | Buy | 2025-12-17 |
| JP Morgan | Maintain | Neutral | 2025-10-27 |
The Clorox Company Grades
This table shows the latest grades from major grading firms for CLX:
| Grading Company | Action | New Grade | Date |
|---|---|---|---|
| Wells Fargo | Maintain | Equal Weight | 2026-01-23 |
| JP Morgan | Maintain | Neutral | 2026-01-16 |
| UBS | Maintain | Neutral | 2026-01-14 |
| TD Cowen | Maintain | Hold | 2026-01-08 |
| Goldman Sachs | Maintain | Sell | 2026-01-07 |
| Wells Fargo | Maintain | Equal Weight | 2026-01-05 |
| Citigroup | Maintain | Neutral | 2025-12-17 |
| Citigroup | Maintain | Neutral | 2025-11-04 |
| Wells Fargo | Maintain | Equal Weight | 2025-11-04 |
| Morgan Stanley | Maintain | Equal Weight | 2025-11-04 |
Which company has the best grades?
PG consistently receives Buy or Overweight grades, indicating stronger institutional confidence. CLX’s grades cluster around Neutral, Hold, or Equal Weight, with one Sell. Investors may perceive PG as having a more favorable outlook.
Risks specific to each company
The following categories identify the critical pressure points and systemic threats facing both firms in the 2026 market environment:
1. Market & Competition
The Procter & Gamble Company
- Dominates with a 354B market cap and diversified product segments, facing moderate competitive pressure.
The Clorox Company
- Smaller 13.8B market cap; niche segments increase vulnerability to aggressive competitors.
2. Capital Structure & Debt
The Procter & Gamble Company
- Maintains moderate leverage (D/E 0.68), low debt-to-assets (28%), and strong interest coverage (23x).
The Clorox Company
- High leverage (D/E 8.97), elevated debt-to-assets (52%), but decent interest coverage (12x).
3. Stock Volatility
The Procter & Gamble Company
- Exhibits low beta (0.39), indicating stability and lower market sensitivity.
The Clorox Company
- Higher beta (0.58), reflecting greater stock price volatility and risk.
4. Regulatory & Legal
The Procter & Gamble Company
- Operating globally, faces complex regulatory frameworks but benefits from established compliance systems.
The Clorox Company
- Also global, with regulatory risks heightened by smaller scale and less diversified product base.
5. Supply Chain & Operations
The Procter & Gamble Company
- Extensive global supply chain with scale advantages, though exposed to raw material cost fluctuations.
The Clorox Company
- More concentrated operations, increasing risk from supply chain disruptions.
6. ESG & Climate Transition
The Procter & Gamble Company
- Invests heavily in sustainable practices; ESG risks mitigated through scale and innovation.
The Clorox Company
- ESG efforts growing but lag behind industry leaders, posing reputational and compliance risks.
7. Geopolitical Exposure
The Procter & Gamble Company
- Broad international footprint exposes it to geopolitical tensions but diversifies country risk.
The Clorox Company
- Smaller international exposure heightens dependence on U.S. market stability.
Which company shows a better risk-adjusted profile?
P&G’s dominant market position, conservative leverage, and lower stock volatility create a more balanced risk profile. Clorox’s high debt and concentrated operations elevate financial and operational risks despite growth potential. P&G’s low beta and strong interest coverage signal superior resilience in turbulent markets.
Final Verdict: Which stock to choose?
The Procter & Gamble Company excels as a cash-generating powerhouse with a durable competitive moat, evidenced by its robust return on invested capital well above its cost of capital. Its main point of vigilance lies in a stretched liquidity position, which could pressure short-term operations. It suits disciplined investors seeking stable, long-term growth.
The Clorox Company’s strategic moat centers on its high capital efficiency and accelerating profitability growth. It carries more financial leverage risk than Procter & Gamble but offers a more attractive dividend yield and faster earnings expansion. It fits investors looking for growth at a reasonable price with a tolerance for elevated debt.
If you prioritize consistent value creation and a defensive portfolio core, Procter & Gamble outshines with its financial resilience and disciplined capital allocation. However, if you seek superior growth momentum and higher income potential while accepting greater leverage risk, Clorox offers better upside dynamics. Each presents a compelling analytical scenario tailored to distinct investor risk appetites.
Disclaimer: Investment carries a risk of loss of initial capital. The past performance is not a reliable indicator of future results. Be sure to understand risks before making an investment decision.
Go Further
I encourage you to read the complete analyses of The Procter & Gamble Company and The Clorox Company to enhance your investment decisions: