Home > Comparison > Financial Services > GS vs SCHW
The strategic rivalry between The Goldman Sachs Group, Inc. and The Charles Schwab Corporation shapes the financial services landscape. Goldman Sachs operates as a diversified capital markets powerhouse with robust investment banking and asset management arms. In contrast, Charles Schwab excels as a retail-centric wealth management and brokerage firm emphasizing scale and client servicing. This analysis will clarify which model delivers superior risk-adjusted returns, guiding investors through this critical sector showdown.

Table of contents
Companies Overview
The Goldman Sachs Group and Charles Schwab shape the financial services landscape with distinct models.
The Goldman Sachs Group, Inc.: Elite Investment Banking and Asset Management Powerhouse
Goldman Sachs dominates investment banking, asset management, and wealth management. It generates revenue through advisory services, underwriting, trading, and managing diverse asset classes. In 2026, the firm emphasizes expanding its consumer and wealth management segment to diversify beyond traditional capital markets dominance.
The Charles Schwab Corporation: Retail Brokerage and Wealth Management Leader
Charles Schwab excels in retail brokerage and advisory services, earning from investor and advisor segments. It offers brokerage, banking, and retirement planning with a focus on digital client experience. In 2026, Schwab prioritizes broadening its investor services and enhancing technology-driven financial solutions.
Strategic Collision: Similarities & Divergences
Goldman Sachs pursues a high-touch, diversified capital markets model, while Schwab builds scale through open, technology-driven retail brokerage. Both compete fiercely for wealth management clients, yet Goldman targets institutional sophistication, Schwab focuses on mass-market accessibility. Their investment profiles differ: Goldman’s complexity and scale contrast with Schwab’s client-centric, volume-driven approach.
Income Statement Comparison
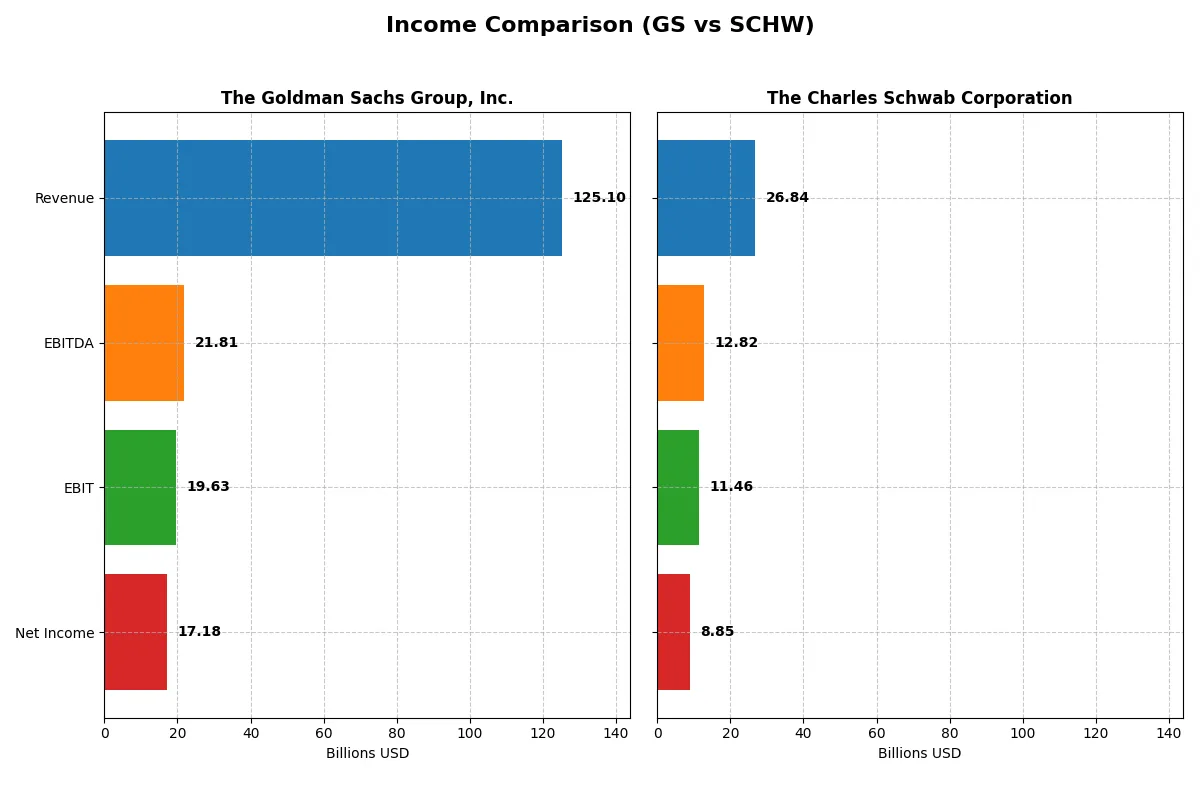
This data dissects the core profitability and scalability of both corporate engines to reveal who dominates the bottom line:
| Metric | The Goldman Sachs Group, Inc. (GS) | The Charles Schwab Corporation (SCHW) |
|---|---|---|
| Revenue | 125.1B | 26.8B |
| Cost of Revenue | 67.9B | 2.9B |
| Operating Expenses | 37.5B | 12.5B |
| Gross Profit | 57.2B | 23.9B |
| EBITDA | 21.8B | 12.8B |
| EBIT | 19.6B | 11.5B |
| Interest Expense | 66.8B | 3.8B |
| Net Income | 17.2B | 8.9B |
| EPS | 51.95 | 4.68 |
| Fiscal Year | 2025 | 2025 |
Income Statement Analysis: The Bottom-Line Duel
This income statement comparison reveals each company’s core efficiency and profitability trends over the recent fiscal years.
The Goldman Sachs Group, Inc. Analysis
Goldman Sachs’ revenue edged down slightly to 125B in 2025 from 127B in 2024, yet net income grew strongly to 17.2B. Its gross margin improved to 45.7%, reflecting better cost control, while net margin rose to 13.7%. Despite a challenging revenue environment, Goldman Sachs increased EBIT by nearly 7%, signaling operational momentum.
The Charles Schwab Corporation Analysis
Charles Schwab expanded revenue steadily to 26.8B in 2025, up from 26B the prior year, with net income surging 49% to 8.9B. Exceptional gross margins above 89% and a robust net margin near 33% highlight Schwab’s operational leverage. EBIT jumped almost 50%, underscoring sharp efficiency gains and strong bottom-line growth.
Margin Strength vs. Growth Velocity
Goldman Sachs delivers higher absolute profit and scale, but its revenue declined slightly last year. Schwab posts superior margins and faster net income growth, reflecting nimble execution. For investors, Schwab’s profile suits those seeking strong margin expansion and earnings momentum, while Goldman Sachs appeals to those valuing scale and steady operational improvement.
Financial Ratios Comparison
These vital ratios act as a diagnostic tool to expose underlying fiscal health, valuation premiums, and capital efficiency of the companies compared below:
| Ratios | The Goldman Sachs Group, Inc. (GS) | The Charles Schwab Corporation (SCHW) |
|---|---|---|
| ROE | 13.7% | 12.3% |
| ROIC | 1.0% | 5.6% |
| P/E | 16.0 | 20.0 |
| P/B | 2.20 | 0 (data not available) |
| Current Ratio | 1.21 | 0 (data not available) |
| Quick Ratio | 1.21 | 0 (data not available) |
| D/E | 4.95 | 0 (data not available) |
| Debt-to-Assets | 34.2% | 0 (data not available) |
| Interest Coverage | 0.29 | 3.05 |
| Asset Turnover | 0.069 | 0 (data not available) |
| Fixed Asset Turnover | 3.47 | 0 (data not available) |
| Payout ratio | 25.5% | 21.6% |
| Dividend yield | 1.59% | 1.08% |
| Fiscal Year | 2025 | 2025 |
Efficiency & Valuation Duel: The Vital Signs
Ratios act as a company’s DNA, revealing hidden risks and operational excellence that numbers alone cannot expose.
The Goldman Sachs Group, Inc.
Goldman Sachs shows solid profitability with a 13.74% ROE and a favorable 13.73% net margin, indicating efficient core operations. Its P/E of 16 and P/B of 2.2 suggest a fairly valued stock, neither cheap nor stretched. The firm returns value with a 1.59% dividend yield, balancing shareholder payouts and reinvestment prudently.
The Charles Schwab Corporation
Charles Schwab posts a strong 32.98% net margin, signaling superior operational efficiency, though its ROE and ROIC data are unavailable, limiting profitability insight. The P/E stands neutral at 20, while a zero debt level and no current or quick ratio data complicate liquidity evaluation. Dividend yield at 1.08% reflects modest shareholder return.
Valuation and Efficiency: Balanced Profitability vs. Operational Clarity
Goldman Sachs offers a clearer risk-reward balance with measurable returns and moderate valuation. Schwab’s high margin is attractive but offset by missing profitability metrics and liquidity concerns. Investors prioritizing transparent operational metrics may favor Goldman Sachs, while those focusing on margin strength might lean toward Schwab.
Which one offers the Superior Shareholder Reward?
I compare GS and SCHW’s shareholder return strategies through dividends and buybacks. GS yields 2.4% with a 32% payout in 2025, supported by modest buybacks. SCHW offers a lower 1.1% yield and 22% payout but aggressively reinvests in growth. GS’s higher payout and steady buybacks suggest more immediate income. SCHW’s lower yield offsets with strong margin expansion and capital reinvestment, targeting long-term value. Given GS’s stronger dividend sustainability and buyback intensity, I find Goldman Sachs offers a more attractive total return profile in 2026.
Comparative Score Analysis: The Strategic Profile
The radar chart reveals the fundamental DNA and trade-offs of both firms, highlighting their distinct financial strengths and vulnerabilities:
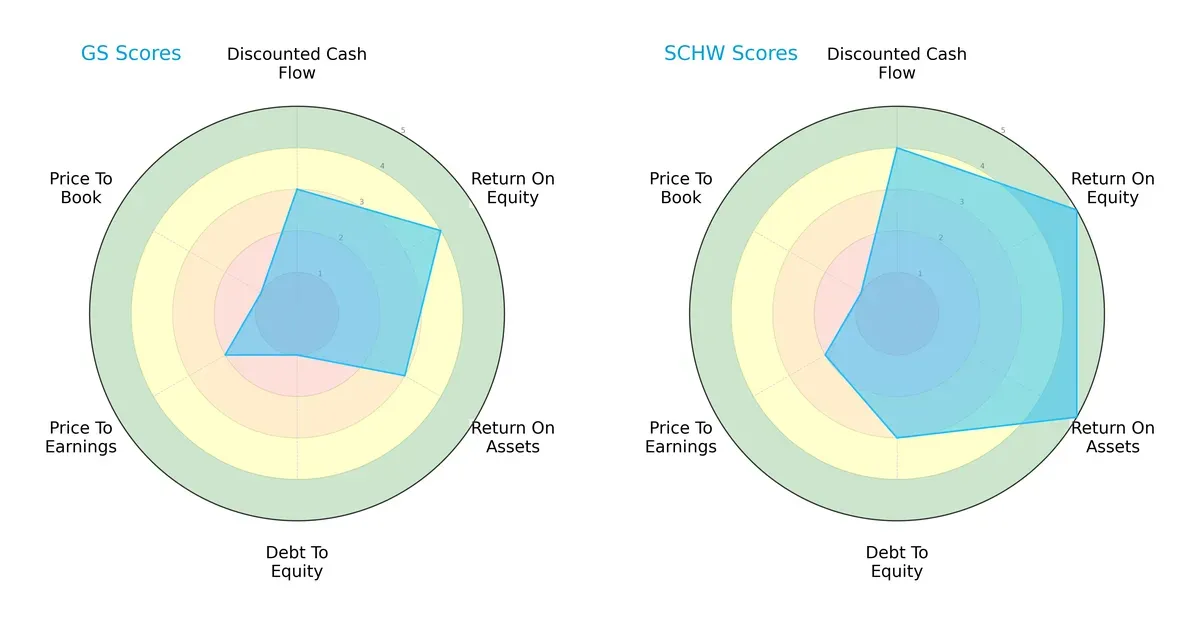
Charles Schwab delivers a more balanced profile with strong scores in ROE (5) and ROA (5), plus moderate debt management (3). Goldman Sachs leans on profitability metrics like ROE (4) but suffers from a very unfavorable debt-to-equity score (1), signaling financial leverage risk. Schwab’s superior DCF (4) and overall score (4) showcase robust valuation and cash flow fundamentals compared to Goldman’s moderate ratings. Schwab’s profile suggests a healthier capital allocation strategy and risk management.
Bankruptcy Risk: Solvency Showdown
The Altman Z-Score delta exposes a stark solvency gap:
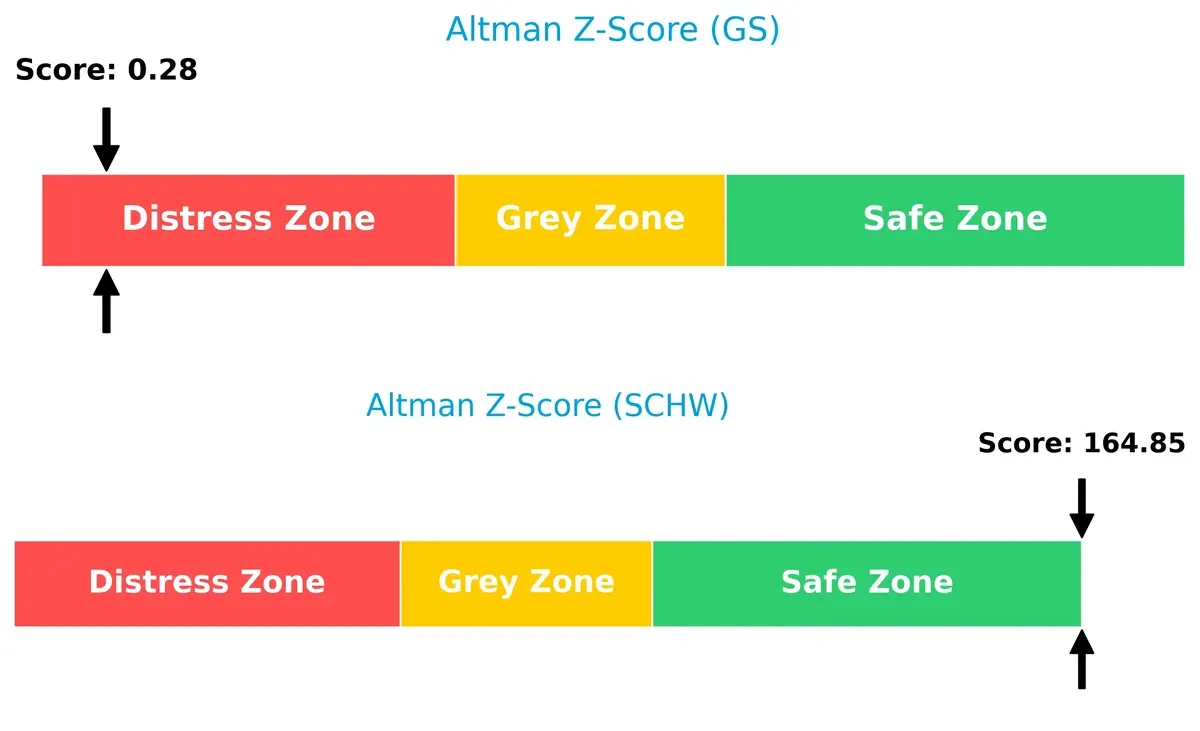
Schwab’s score (165) places it firmly in the safe zone, implying resilient financial health and low bankruptcy risk. Conversely, Goldman Sachs’ score (0.28) signals distress, raising red flags about its long-term survival amid economic headwinds. This divergence demands caution for investors prioritizing financial stability.
Financial Health: Quality of Operations
The Piotroski F-Score comparison clarifies operational robustness:
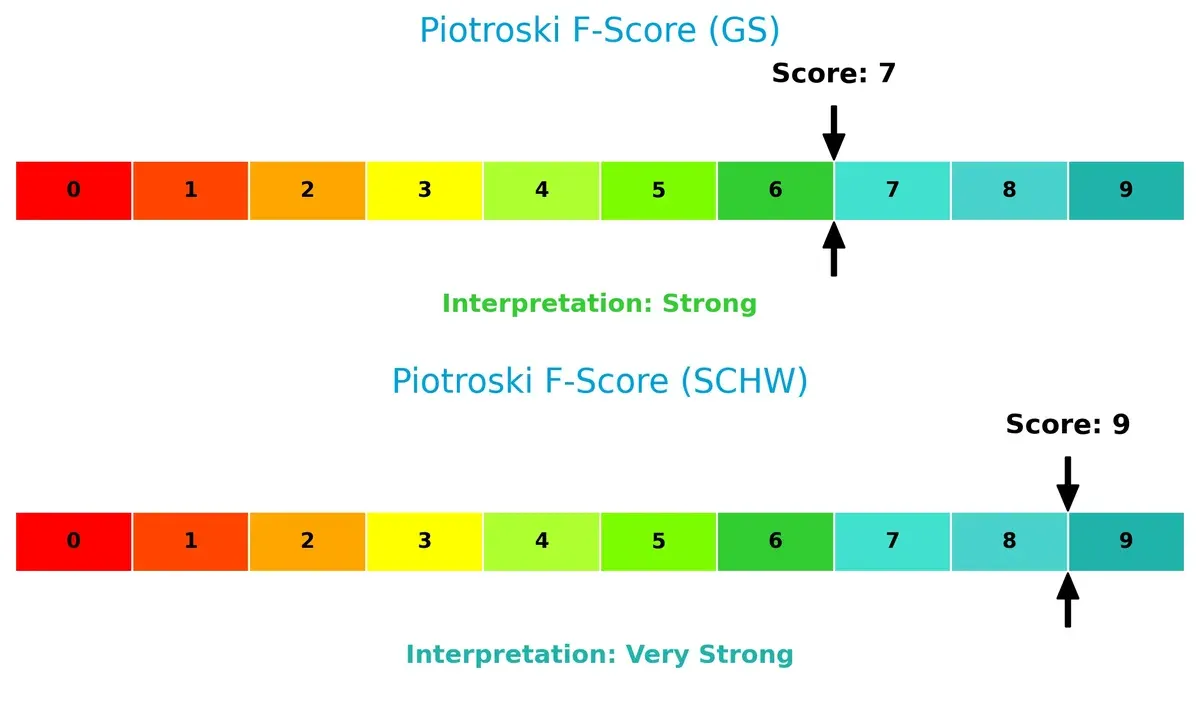
Schwab’s perfect 9 reflects very strong financial health with efficient profitability, low leverage, and good liquidity. Goldman’s 7 indicates strong but comparatively weaker internal metrics, suggesting some operational caution. Schwab’s superior score confirms it as the safer bet for investors focused on quality and consistency.
How are the two companies positioned?
This section dissects the operational DNA of GS and SCHW by comparing revenue distribution across segments and internal strengths and weaknesses. The goal is to confront their economic moats and identify which business model offers the most resilient, sustainable competitive advantage today.
Revenue Segmentation: The Strategic Mix
This visual comparison dissects how The Goldman Sachs Group, Inc. and The Charles Schwab Corporation diversify their income streams and where their primary sector bets lie:
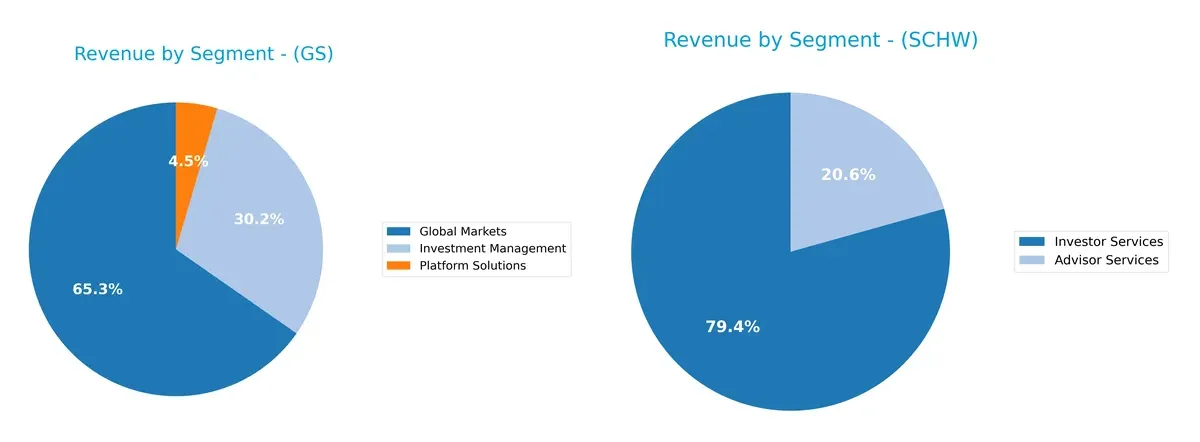
Goldman Sachs pivots heavily on Global Markets, generating $34.9B in 2024, dwarfing its other segments like $16.1B in Investment Management. Schwab relies predominantly on Investor Services with $15.6B, supported by $4.0B from Advisor Services. Goldman’s concentrated exposure to trading and market activities signals higher volatility but strong ecosystem lock-in. Schwab’s simpler two-segment model suggests steadier fee-based growth but greater reliance on retail brokerage flows.
Strengths and Weaknesses Comparison
This table compares the Strengths and Weaknesses of GS and SCHW based on diversification, profitability, financial statement, innovation, global presence, and market share:
GS Strengths
- Diversified revenue streams across Investment Management, Global Markets, and Platform Solutions
- Favorable net margin at 13.73%
- Neutral current and quick ratios indicating liquidity
- Global presence with strong Americas, EMEA, and Asia revenues
- Favorable fixed asset turnover at 3.47
SCHW Strengths
- High net margin of 32.98% indicating strong profitability
- Favorable debt-to-equity and debt-to-assets ratios reflecting low leverage
- Favorable price-to-book ratio
- Solid revenue from Advisor and Investor Services segments
GS Weaknesses
- Unfavorable return on invested capital at 0.98% below WACC
- High debt-to-equity ratio of 4.95 indicating leverage risk
- Unfavorable interest coverage at 0.29 signaling potential stress
- Low asset turnover at 0.07 limiting efficiency
- Slightly unfavorable global ratios overall
SCHW Weaknesses
- Zero recorded ROE and ROIC, indicating poor capital efficiency
- Unavailable WACC ratio, limiting cost of capital insight
- Unfavorable liquidity ratios (current and quick at 0)
- Unfavorable asset and fixed asset turnover ratios
- Higher proportion of unfavorable financial ratios (42.86%)
GS shows strength in diversification and global reach but faces leverage and efficiency challenges. SCHW excels in profitability and capital structure but reveals liquidity and efficiency vulnerabilities. These contrasts highlight distinct strategic focuses and financial profiles.
The Moat Duel: Analyzing Competitive Defensibility
A strong structural moat shields long-term profits from relentless competitive pressure and market disruption. Let’s examine the moats of two financial giants:
The Goldman Sachs Group, Inc.: Intangible Assets and Client Relationships
Goldman Sachs leverages deep client trust and proprietary advisory expertise. This moat shows in stable margins and high-value deal flow. Yet, declining ROIC signals rising competitive pressure and risks eroding profitability in 2026.
The Charles Schwab Corporation: Cost Advantage and Scale
Schwab’s moat stems from low-cost brokerage and extensive client base, driving superior margins and robust revenue growth. Unlike Goldman, Schwab’s expanding scale and technology investments deepen its competitive edge for future market share gains.
Intangible Assets vs. Cost Leadership: Which Moat Holds Stronger?
Goldman Sachs’s intangible assets face margin and ROIC pressure, while Schwab’s cost advantage fuels consistent income growth. I see Schwab’s moat as wider and more durable, better positioned to defend market share in 2026.
Which stock offers better returns?
The past year shows distinct bullish trends for both Goldman Sachs and Charles Schwab, with Goldman Sachs exhibiting stronger price acceleration and higher volatility.
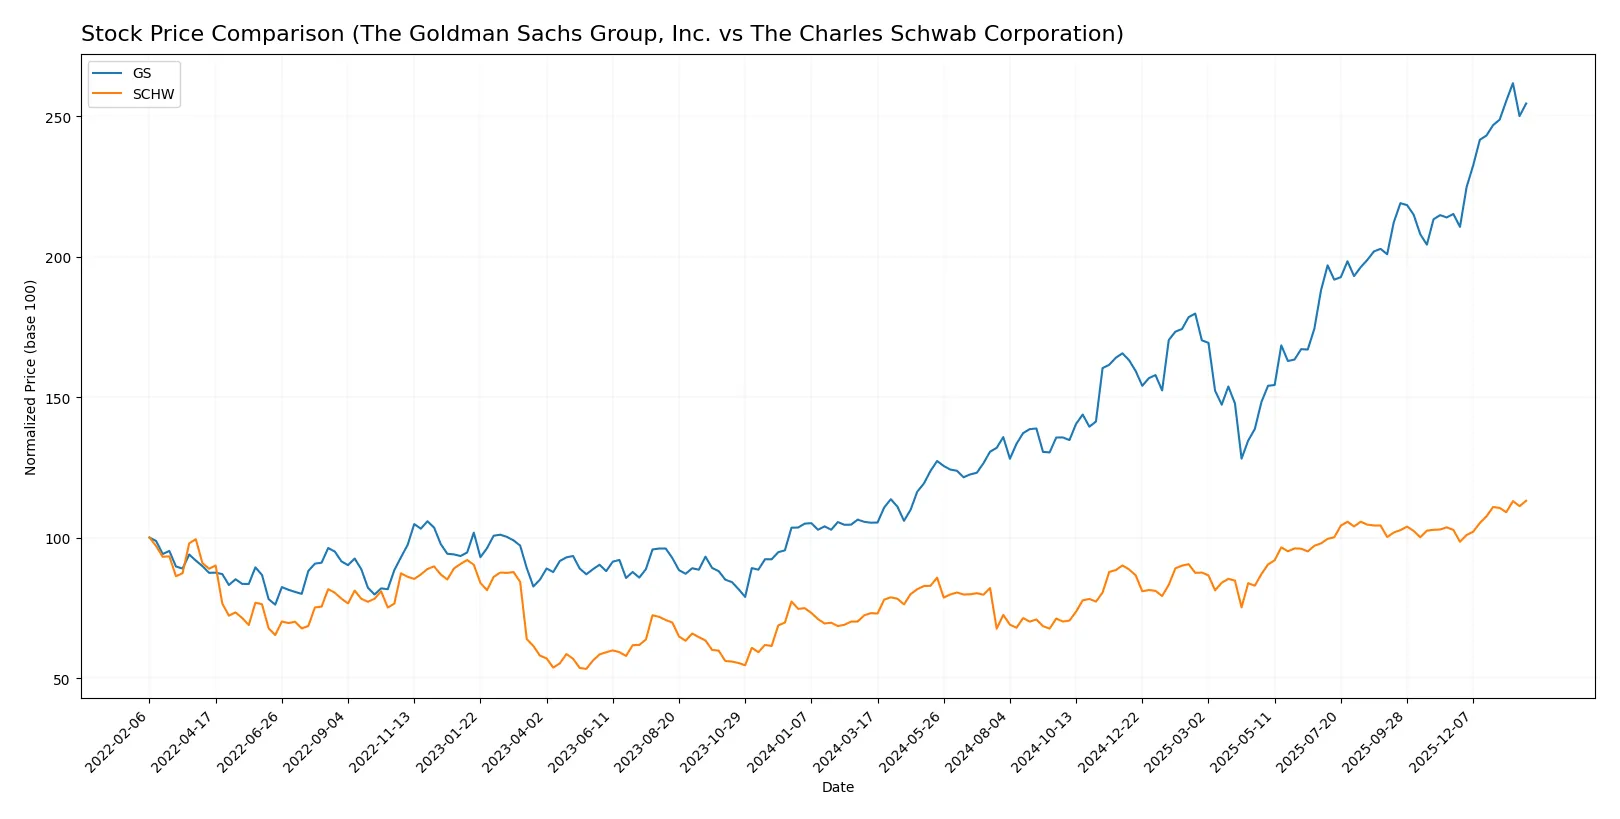
Trend Comparison
Goldman Sachs’ stock gained 142% over 12 months, showing accelerating bullish momentum with a wide price range between 387 and 962. Recent months confirm continued strong upward slope and buyer dominance.
Charles Schwab’s stock rose 55% over the same period, also accelerating but with lower volatility and a narrower price range from 62 to 104. Recent trend remains positive but less steep than Goldman Sachs.
Goldman Sachs outperformed Charles Schwab in market returns and momentum, delivering the highest gains and stronger acceleration over the last year.
Target Prices
Analysts present a broad but optimistic target consensus for both Goldman Sachs and Charles Schwab.
| Company | Target Low | Target High | Consensus |
|---|---|---|---|
| The Goldman Sachs Group, Inc. | 604 | 1100 | 902.83 |
| The Charles Schwab Corporation | 105 | 148 | 122.78 |
Goldman Sachs’s consensus target of 903 sits slightly below its current price of 935, suggesting limited upside or potential market overvaluation. Charles Schwab’s target consensus at 123 exceeds the current price of 104, indicating moderate analyst confidence in price appreciation.

Don’t Let Luck Decide Your Entry Point
Optimize your entry points with our advanced ProRealTime indicators. You’ll get efficient buy signals with precise price targets for maximum performance. Start outperforming now!
How do institutions grade them?
The Goldman Sachs Group, Inc. Grades
The latest institutional grades for Goldman Sachs show a range of sector and market perform ratings:
| Grading Company | Action | New Grade | Date |
|---|---|---|---|
| RBC Capital | Maintain | Sector Perform | 2026-01-20 |
| Keefe, Bruyette & Woods | Maintain | Market Perform | 2026-01-16 |
| Wells Fargo | Maintain | Overweight | 2026-01-16 |
| JP Morgan | Maintain | Neutral | 2026-01-08 |
| Barclays | Maintain | Overweight | 2026-01-05 |
The Charles Schwab Corporation Grades
Charles Schwab consistently earns buy and overweight ratings from multiple reputable firms:
| Grading Company | Action | New Grade | Date |
|---|---|---|---|
| Barclays | Maintain | Overweight | 2026-01-26 |
| Barclays | Maintain | Overweight | 2026-01-22 |
| TD Cowen | Maintain | Buy | 2026-01-22 |
| UBS | Maintain | Buy | 2026-01-22 |
| Truist Securities | Maintain | Buy | 2026-01-22 |
Which company has the best grades?
Charles Schwab holds the stronger consensus with multiple buy and overweight ratings. Goldman Sachs mostly receives neutral to sector perform grades. Schwab’s higher ratings could signal greater confidence from institutions, potentially influencing investor sentiment.
Risks specific to each company
The following categories identify critical pressure points and systemic threats facing both firms amid the 2026 market environment:
1. Market & Competition
The Goldman Sachs Group, Inc.
- Faces intense competition in investment banking and asset management, pressuring margins.
The Charles Schwab Corporation
- Competes fiercely in retail brokerage and advisory services, benefiting from diversified client base.
2. Capital Structure & Debt
The Goldman Sachs Group, Inc.
- High debt-to-equity ratio (4.95) signals elevated financial risk and interest coverage concerns.
The Charles Schwab Corporation
- Virtually no debt reported, indicating a conservative capital structure and lower financial risk.
3. Stock Volatility
The Goldman Sachs Group, Inc.
- Beta of 1.322 shows above-market volatility, increasing risk during market downturns.
The Charles Schwab Corporation
- Beta of 0.937 implies less volatility, offering more stability to investors.
4. Regulatory & Legal
The Goldman Sachs Group, Inc.
- Subject to stringent regulations due to global investment banking operations.
The Charles Schwab Corporation
- Faces regulatory scrutiny mainly in retail brokerage and banking sectors.
5. Supply Chain & Operations
The Goldman Sachs Group, Inc.
- Operational complexity across global markets may increase execution risk and costs.
The Charles Schwab Corporation
- Streamlined operations focused on investor and advisor services reduce operational risk.
6. ESG & Climate Transition
The Goldman Sachs Group, Inc.
- Increasing pressure to align asset management and underwriting with ESG standards.
The Charles Schwab Corporation
- Faces growing demand to integrate ESG factors within investment advice and product offerings.
7. Geopolitical Exposure
The Goldman Sachs Group, Inc.
- Global footprint exposes it to geopolitical and currency risks.
The Charles Schwab Corporation
- Primarily US-focused but with some international branches, limiting geopolitical exposure.
Which company shows a better risk-adjusted profile?
The Goldman Sachs Group’s most significant risk is its high leverage and weak interest coverage, straining financial flexibility. Charles Schwab’s critical risk lies in its zero reported liquidity ratios, raising concerns about short-term operational robustness. Schwab’s lower beta and stronger Altman Z-Score reflect a better risk-adjusted profile. Notably, Goldman Sachs’ Altman Z-Score in the distress zone sharply contrasts with Schwab’s safe zone, justifying caution for GS investors.
Final Verdict: Which stock to choose?
The Goldman Sachs Group, Inc. (GS) stands out for its powerful operational efficiency and strong earnings momentum despite a challenging return on invested capital. Its core strength lies in navigating complex financial markets with agility. A point of vigilance remains its elevated leverage and interest coverage, which could pressure stability. GS suits aggressive growth portfolios willing to tolerate higher risk for outsized returns.
The Charles Schwab Corporation (SCHW) boasts a strategic moat rooted in its recurring revenue and client-centric platform, delivering robust net margins and impressive income growth. Its financial safety profile outshines GS, reflected in superior bankruptcy risk scores and moderate leverage. SCHW fits well in Growth at a Reasonable Price (GARP) portfolios seeking stability paired with growth potential.
If you prioritize aggressive growth with operational leverage, GS is the compelling choice due to its earnings acceleration and market adaptability. However, if you seek a safer growth trajectory with consistent income quality and lower financial risk, SCHW offers better stability and a more reliable moat. Both present slightly unfavorable ratio profiles, so cautious position sizing is prudent.
Disclaimer: Investment carries a risk of loss of initial capital. The past performance is not a reliable indicator of future results. Be sure to understand risks before making an investment decision.
Go Further
I encourage you to read the complete analyses of The Goldman Sachs Group, Inc. and The Charles Schwab Corporation to enhance your investment decisions: