Home > Comparison > Financial Services > ALL vs WRB
The strategic rivalry between The Allstate Corporation and W. R. Berkley Corporation shapes the competitive landscape of the property and casualty insurance sector. Allstate operates a broad, diversified insurance platform with significant scale and multiple distribution channels. In contrast, Berkley specializes in niche commercial insurance and reinsurance with a focus on underwriting discipline. This analysis evaluates which operational model presents a superior risk-adjusted investment opportunity in a complex financial services environment.

Table of contents
Companies Overview
The Allstate Corporation and W. R. Berkley Corporation are key players in the US property and casualty insurance market.
The Allstate Corporation: Comprehensive Personal and Commercial Insurance Leader
Allstate dominates the property and casualty sector with a diverse insurance portfolio spanning auto, homeowners, and specialty lines. Its revenue engine relies on underwriting and protection services, including telematics and identity protection. In 2026, Allstate focuses on integrating technology-driven consumer protection and expanding its health and benefits segment to deepen market penetration.
W. R. Berkley Corporation: Specialist in Commercial and Reinsurance Solutions
W. R. Berkley excels as a commercial lines insurance underwriter with a strong emphasis on specialty and risk management products globally. It drives revenue through insurance and reinsurance segments covering liability, workers’ compensation, and cyber risk. In 2026, Berkley sharpens its focus on tailored risk solutions and reinsurance services to support complex client needs and portfolio risk mitigation.
Strategic Collision: Similarities & Divergences
Both firms operate in property and casualty insurance but diverge in client focus and product range. Allstate pursues a broad consumer base with integrated personal and commercial solutions, while Berkley targets specialized commercial risks and reinsurance. Their primary battleground is the evolving demand for customized risk coverage. Investors face distinct profiles: Allstate offers scale and diversification; Berkley presents niche expertise and risk management sophistication.
Income Statement Comparison
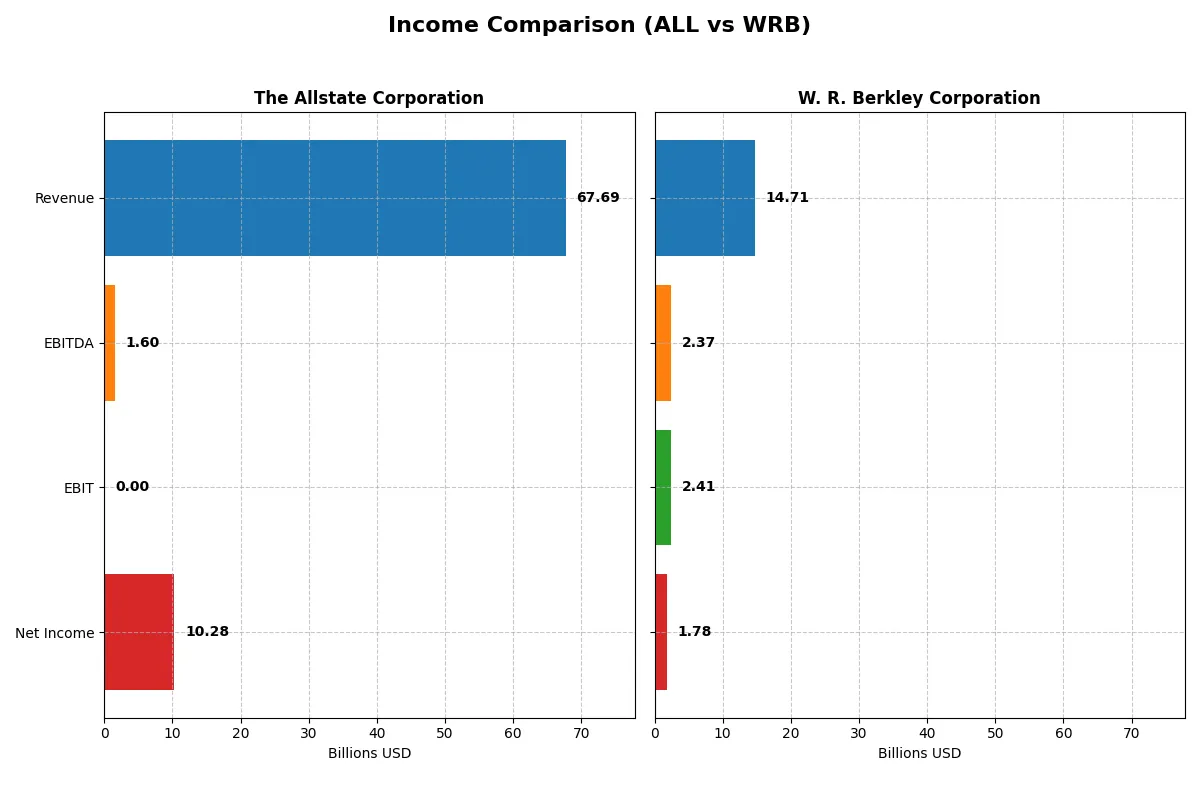
This data dissects the core profitability and scalability of both corporate engines to reveal who dominates the bottom line:
| Metric | The Allstate Corporation (ALL) | W. R. Berkley Corporation (WRB) |
|---|---|---|
| Revenue | 67.7B | 14.7B |
| Cost of Revenue | 0 | 11.8B |
| Operating Expenses | 0 | 579M |
| Gross Profit | 0 | 2.9B |
| EBITDA | 1.6B | 2.4B |
| EBIT | 0 | 2.4B |
| Interest Expense | 399M | 127M |
| Net Income | 10.3B | 1.8B |
| EPS | 38.56 | 4.48 |
| Fiscal Year | 2025 | 2025 |
Income Statement Analysis: The Bottom-Line Duel
This income statement comparison reveals the true efficiency and profitability momentum of two leading insurance companies over recent years.
The Allstate Corporation Analysis
Allstate’s revenue surged from 48.7B in 2021 to 67.7B in 2025, while net income skyrocketed from 1.6B to 10.3B. The net margin improved sharply to 15.2% in 2025 despite gross profit disappearing due to accounting changes. The strong 2025 net income reflects robust non-operating income driving efficiency and earnings momentum.
W. R. Berkley Corporation Analysis
W.R. Berkley grew revenue steadily from 9.5B in 2021 to 14.7B in 2025, with net income rising from 1.0B to 1.8B. Its gross margin held firm near 20%, and EBIT margin improved to 16.4%. Although net margin dipped slightly in 2025 to 12.1%, the company maintained stable operating profitability and consistent EPS growth over the period.
High Earnings Growth vs. Stable Profitability
Allstate delivers explosive net income growth and margin expansion fueled by significant non-operating gains, overshadowing its zero gross margin reporting. Berkley posts steadier revenue and profit growth with solid gross and EBIT margins. Investors focused on rapid earnings acceleration may prefer Allstate, while those valuing consistent operating performance might lean toward Berkley’s stable profile.
Financial Ratios Comparison
These vital ratios act as a diagnostic tool to expose the underlying fiscal health, valuation premiums, and capital efficiency of the companies compared below:
| Ratios | The Allstate Corporation (ALL) | W. R. Berkley Corporation (WRB) |
|---|---|---|
| ROE | 21.77% | 20.92% (2024) |
| ROIC | 4.12% | N/A |
| P/E | 10.92 | 13.32 (2024) |
| P/B | 2.38 | 2.79 (2024) |
| Current Ratio | 0 | 0 |
| Quick Ratio | 0 | 0 |
| D/E | 0.38 | 0.34 (2024) |
| Debt-to-Assets | 7.24% | 7.00% (2024) |
| Interest Coverage | 14.40 | 17.84 (2024) |
| Asset Turnover | 0.57 | 0.34 (2024) |
| Fixed Asset Turnover | 94.94 | 28.50 (2024) |
| Payout ratio | 23.12% | 30.29% (2024) |
| Dividend yield | 2.12% | 2.27% (2024) |
| Fiscal Year | 2024 | 2024 |
Efficiency & Valuation Duel: The Vital Signs
Ratios act as a company’s DNA, revealing hidden risks and operational excellence behind headline numbers.
The Allstate Corporation
Allstate demonstrates strong profitability with a 21.77% ROE and a solid 7.35% net margin, signaling operational efficiency. Its P/E of 10.92 suggests the stock is attractively valued relative to earnings. The company rewards shareholders with a 2.12% dividend yield, balancing returns with prudent reinvestment.
W. R. Berkley Corporation
Berkley posts a higher net margin at 12.1%, indicating better core profitability. The P/E of 15.63 points to a moderately stretched valuation. Despite a neutral ROE and limited asset turnover data, it sustains shareholder value through a 2.64% dividend yield and strong interest coverage, reflecting financial stability.
Valuation Discipline vs. Profitability Strength
Allstate offers a favorable blend of solid returns and attractive valuation, while Berkley excels in margin but trades at a premium. Investors prioritizing valuation discipline may prefer Allstate. Those favoring profitability strength and financial safety might lean toward Berkley’s profile.
Which one offers the Superior Shareholder Reward?
I observe that The Allstate Corporation (ALL) pays a 2.12% dividend yield with a conservative 23% payout ratio, supported by strong free cash flow coverage near 98%. ALL’s buyback intensity is moderate, complementing its dividend to return capital sustainably. W. R. Berkley Corporation (WRB) offers a slightly lower dividend yield around 2.64% with a more aggressive 41% payout ratio but backs this with consistent buybacks driving total shareholder return. WRB’s higher operating margins and efficient capital allocation signal greater long-term sustainability. I conclude WRB offers a superior total return profile in 2026 due to its balanced mix of dividends, robust buybacks, and operational strength.
Comparative Score Analysis: The Strategic Profile
The radar chart reveals the fundamental DNA and trade-offs of both firms, highlighting their core financial strengths and vulnerabilities:
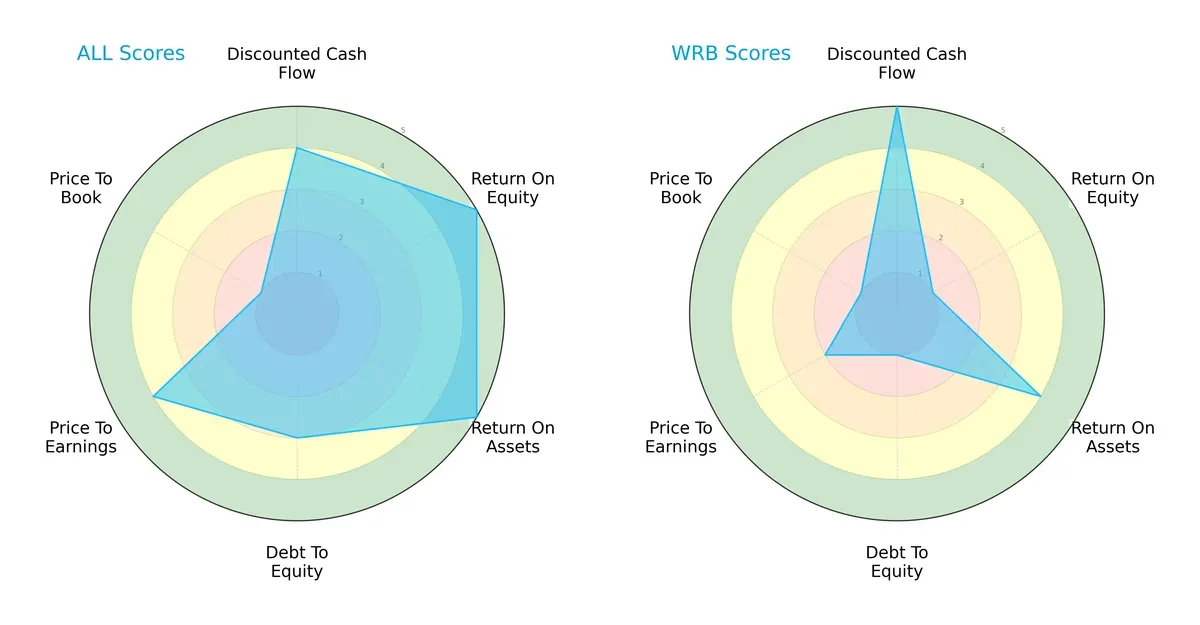
The Allstate Corporation (ALL) shows a balanced profile with strong ROE (5) and ROA (5) scores, indicating efficient profit generation and asset utilization. Its DCF (4) and P/E (4) scores suggest fair valuation, though moderate debt-to-equity (3) signals some leverage risk. W. R. Berkley Corporation (WRB) relies heavily on DCF strength (5) but suffers from very weak ROE (1) and debt-to-equity (1) scores, indicating potential financial fragility. Overall, ALL presents a more stable and well-rounded investment profile compared to WRB’s concentrated strengths.
—
Bankruptcy Risk: Solvency Showdown
The Allstate Corporation’s Altman Z-Score of 1.47 places it in the distress zone, signaling a high bankruptcy risk in the current cycle. W. R. Berkley Corporation’s score is unavailable, limiting direct comparison but raising caution for ALL’s long-term solvency:

—
Financial Health: Quality of Operations
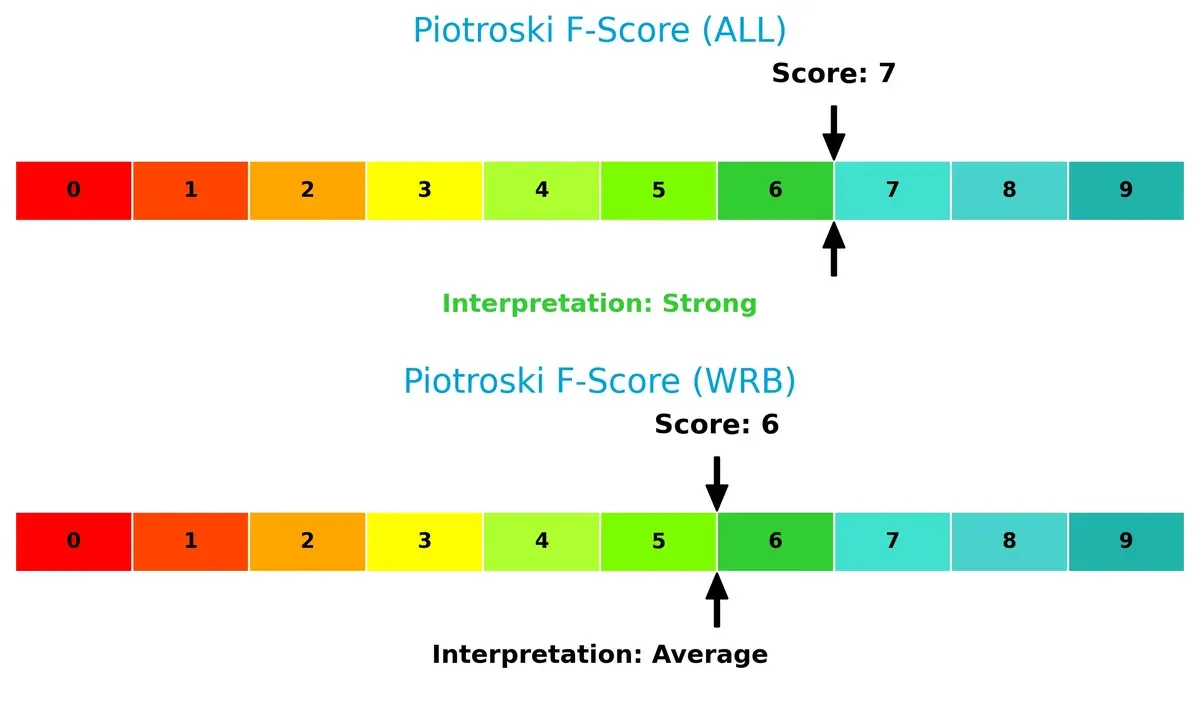
The Allstate Corporation scores a strong 7 on the Piotroski F-Score, indicating robust financial health and operational quality. W. R. Berkley Corporation’s score of 6 is average, suggesting moderate internal risks compared to ALL’s stronger metrics:
How are the two companies positioned?
This section dissects the operational DNA of Allstate and WRB by comparing their revenue distribution by segment and analyzing their internal strengths and weaknesses. The goal is to confront their economic moats and determine which business model delivers the most resilient and sustainable competitive advantage today.
Revenue Segmentation: The Strategic Mix
The following visual comparison dissects how The Allstate Corporation and W. R. Berkley Corporation diversify their income streams and where their primary sector bets lie:
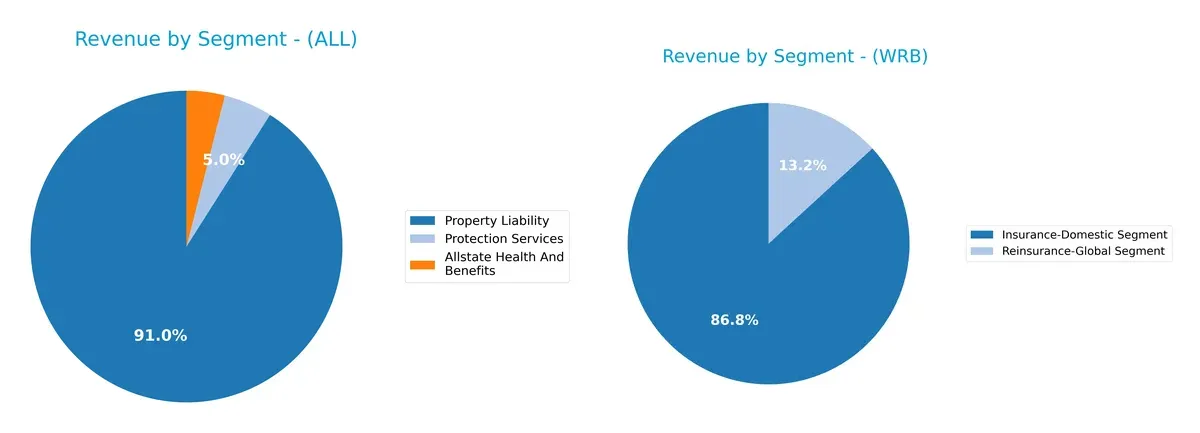
Allstate anchors its revenue in Property Liability at $58.3B, with smaller contributions from Health and Benefits ($2.5B) and Protection Services ($3.2B). In contrast, Berkley’s mix is more balanced, with $11.2B from Domestic Insurance and $1.7B from Global Reinsurance. Allstate’s concentration signals infrastructure dominance but also concentration risk. Berkley’s diversified streams suggest resilience through market cycles and ecosystem lock-in.
Strengths and Weaknesses Comparison
This table compares the Strengths and Weaknesses of The Allstate Corporation and W. R. Berkley Corporation:
The Allstate Corporation Strengths
- Diversified revenue across Property Liability, Health, and Protection Services
- Strong ROE at 21.77% indicating efficient equity use
- Favorable debt ratios with low debt-to-assets at 7.24%
- High fixed asset turnover at 94.94 signals operational efficiency
- Dividend yield at 2.12% provides shareholder return
W. R. Berkley Corporation Strengths
- Higher net margin at 12.1% shows superior profitability
- Favorable interest coverage at 18.95 indicates strong debt servicing
- Zero debt-to-equity and debt-to-assets reflects conservative leverage
- Dividend yield at 2.64% supports income-focused investors
The Allstate Corporation Weaknesses
- Unfavorable ROIC at 4.12%, below typical cost of capital levels
- Unavailable WACC hinders full capital efficiency analysis
- Unfavorable liquidity ratios with zeros for current and quick ratios
- Interest coverage at 0.0 flags risk in meeting interest expenses
- Neutral net margin at 7.35% limits profitability strength
W. R. Berkley Corporation Weaknesses
- Zero ROE and ROIC indicate inefficiency in capital returns
- Unfavorable asset turnover metrics suggest lower asset productivity
- Unfavorable liquidity ratios with zeros for current and quick ratios
- Higher proportion of unfavorable ratios at 42.86% affects financial stability
Overall, Allstate shows operational strength and diversified revenue but faces capital efficiency and liquidity challenges. Berkley delivers higher profitability and stronger debt coverage but struggles with capital returns and asset utilization, indicating distinct strategic focus areas.
The Moat Duel: Analyzing Competitive Defensibility
A structural moat is the sole shield preserving long-term profits from relentless competitive erosion in insurance markets:
The Allstate Corporation: Intangible Assets Anchored by Brand Power
Allstate’s moat centers on strong brand recognition and a diversified product suite. This translates into stable net margins near 15%, reflecting loyal customer retention. In 2026, expansion in protection services may deepen its market grip but rising competition looms.
W. R. Berkley Corporation: Niche Focus and Underwriting Discipline
Berkley’s competitive edge lies in underwriting expertise and tailored commercial insurance. Its EBIT margin of 16.35% outpaces peers, signaling operational strength. The firm’s disciplined approach supports steady growth, with opportunities in specialty lines poised to expand its moat.
Brand Strength vs. Underwriting Excellence: Who Holds the Deeper Moat?
Allstate wields a broader brand-driven moat, while Berkley excels in focused underwriting. Given Allstate’s scale and diversified revenue, its moat appears wider. However, Berkley’s operational efficiency equips it well to defend niche market share effectively.
Which stock offers better returns?
Over the past year, both stocks showed strong gains with decelerating momentum; recent months reveal slight declines, reflecting shifting trading dynamics.
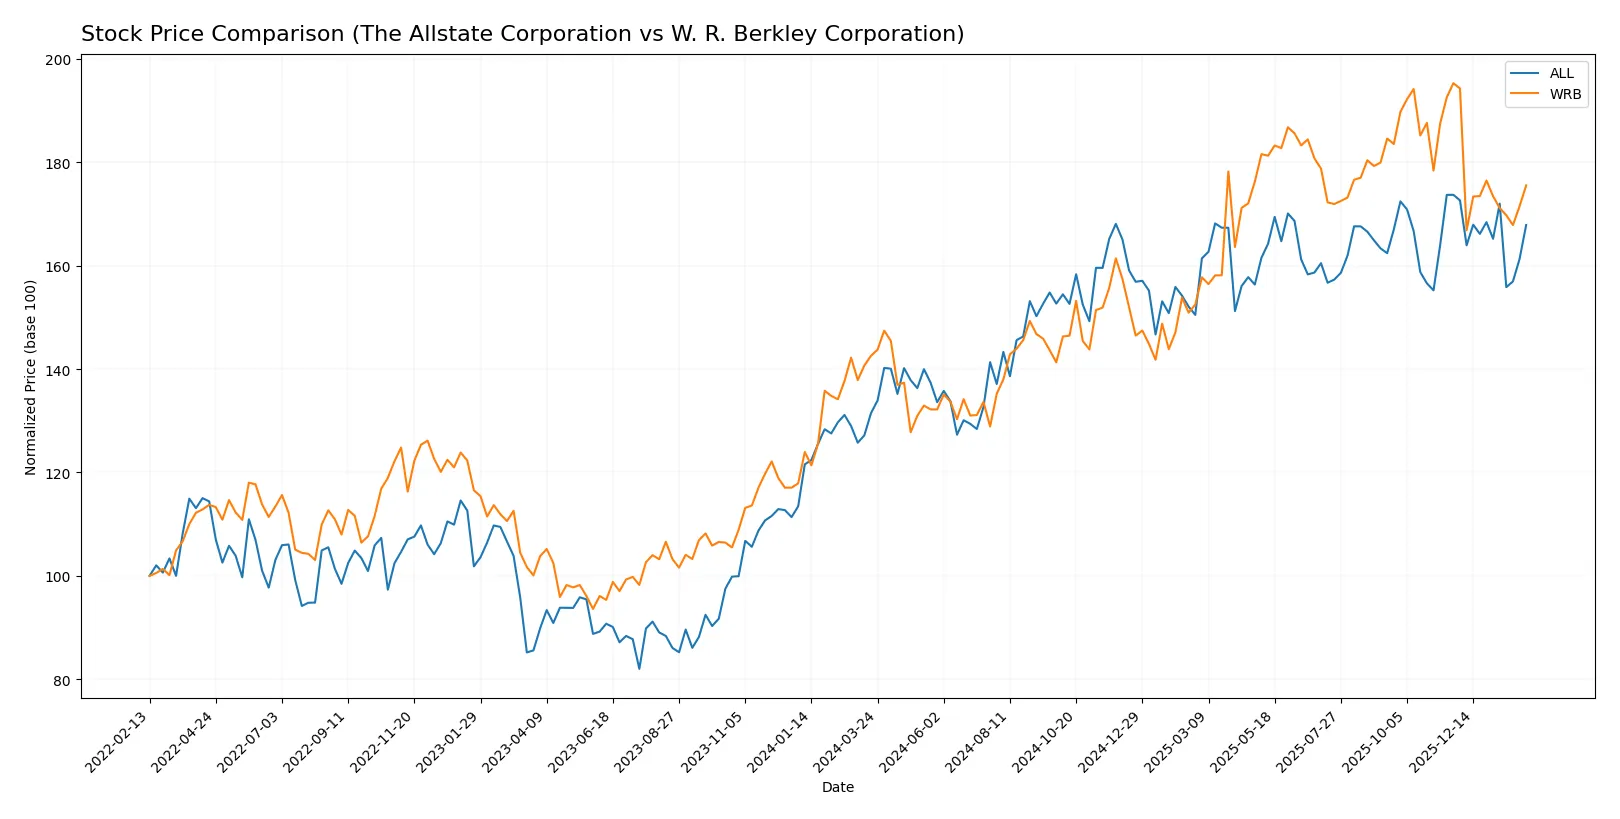
Trend Comparison
The Allstate Corporation (ALL) posted a 27.69% price increase over 12 months, marking a bullish trend with decelerating momentum and a high volatility level (15.05%). Recent weeks saw a mild 3.36% drop.
W. R. Berkley Corporation (WRB) gained 23.12% over the same period, also bullish with deceleration and lower volatility (7.83%). Its recent decline is sharper at 10.13%.
ALL outperformed WRB in overall market gains despite higher volatility; recent declines affect both, with WRB showing a steeper short-term drop.
Target Prices
Analysts show a constructive target consensus for The Allstate Corporation and W. R. Berkley Corporation.
| Company | Target Low | Target High | Consensus |
|---|---|---|---|
| The Allstate Corporation | 215 | 255 | 233.57 |
| W. R. Berkley Corporation | 64 | 80 | 71 |
The Allstate consensus target of 233.57 exceeds the current price of 207.12, implying upside potential. Similarly, W. R. Berkley’s consensus target of 71 slightly surpasses its current price of 70.19, indicating modest appreciation expectations.

Don’t Let Luck Decide Your Entry Point
Optimize your entry points with our advanced ProRealTime indicators. You’ll get efficient buy signals with precise price targets for maximum performance. Start outperforming now!
How do institutions grade them?
The Allstate Corporation Grades
The following table summarizes recent grade updates for The Allstate Corporation from leading firms.
| Grading Company | Action | New Grade | Date |
|---|---|---|---|
| Wells Fargo | Maintain | Equal Weight | 2026-01-13 |
| TD Cowen | Downgrade | Hold | 2026-01-12 |
| Keefe, Bruyette & Woods | Maintain | Outperform | 2026-01-06 |
| William Blair | Downgrade | Market Perform | 2025-12-18 |
| Morgan Stanley | Downgrade | Equal Weight | 2025-12-16 |
| Roth Capital | Maintain | Buy | 2025-11-26 |
| Keefe, Bruyette & Woods | Maintain | Outperform | 2025-11-11 |
| UBS | Maintain | Buy | 2025-11-10 |
| Wells Fargo | Maintain | Equal Weight | 2025-11-07 |
| BMO Capital | Maintain | Outperform | 2025-11-07 |
W. R. Berkley Corporation Grades
Below is a summary of recent grades for W. R. Berkley Corporation from recognized grading firms.
| Grading Company | Action | New Grade | Date |
|---|---|---|---|
| Cantor Fitzgerald | Maintain | Overweight | 2026-02-02 |
| Argus Research | Maintain | Buy | 2026-02-02 |
| Truist Securities | Maintain | Buy | 2026-01-28 |
| B of A Securities | Maintain | Neutral | 2026-01-27 |
| Mizuho | Maintain | Neutral | 2026-01-27 |
| Wells Fargo | Maintain | Equal Weight | 2026-01-27 |
| Jefferies | Maintain | Hold | 2026-01-27 |
| TD Cowen | Downgrade | Sell | 2026-01-20 |
| Cantor Fitzgerald | Maintain | Overweight | 2026-01-14 |
| Wells Fargo | Maintain | Equal Weight | 2026-01-13 |
Which company has the best grades?
The Allstate Corporation mostly holds “Hold” to “Outperform” grades, while W. R. Berkley has a broader range from “Buy” to “Sell.” Allstate’s grades trend higher overall. This suggests more consistent confidence from analysts, which may influence investor sentiment positively.
Risks specific to each company
The following categories identify the critical pressure points and systemic threats facing both firms in the 2026 market environment:
1. Market & Competition
The Allstate Corporation
- Large market cap supports scale advantages but faces intense property & casualty competition.
W. R. Berkley Corporation
- Smaller, more specialized commercial lines focus; faces niche competition and international risks.
2. Capital Structure & Debt
The Allstate Corporation
- Moderate debt-to-equity (0.38) with favorable debt metrics but weak interest coverage signals risk.
W. R. Berkley Corporation
- Minimal debt reported, strong interest coverage (18.95), indicating conservative leverage and financial flexibility.
3. Stock Volatility
The Allstate Corporation
- Very low beta (0.235) implies stable stock but may limit upside in bull markets.
W. R. Berkley Corporation
- Low beta (0.36) still stable, with higher volatility than Allstate, offering more trading opportunities.
4. Regulatory & Legal
The Allstate Corporation
- Large US & Canadian footprint subjects Allstate to complex multi-jurisdictional insurance regulations.
W. R. Berkley Corporation
- International exposure increases regulatory complexity, especially in reinsurance and specialty lines.
5. Supply Chain & Operations
The Allstate Corporation
- Wide distribution channels including agencies and digital platforms create operational complexity.
W. R. Berkley Corporation
- Focused underwriting operations with less complexity but higher exposure to specialty risk underwriting.
6. ESG & Climate Transition
The Allstate Corporation
- Exposure to climate risks in property insurance; needs robust ESG integration to mitigate future losses.
W. R. Berkley Corporation
- Specialty lines and reinsurance segments face evolving ESG standards, posing transitional risks.
7. Geopolitical Exposure
The Allstate Corporation
- Primarily North American operations limit geopolitical risk but still sensitive to trade policies.
W. R. Berkley Corporation
- Broader international presence introduces geopolitical risks, especially in volatile markets.
Which company shows a better risk-adjusted profile?
The Allstate Corporation’s greatest risk lies in its weak interest coverage risking financial strain despite scale advantages. W. R. Berkley faces its biggest threat in regulatory complexity and niche market exposure. Overall, Berkley’s conservative leverage and strong interest coverage give it a superior risk-adjusted profile amid 2026 uncertainties. Notably, Allstate’s Altman Z-Score in the distress zone highlights urgent balance sheet concerns, while Berkley maintains average financial health.
Final Verdict: Which stock to choose?
The Allstate Corporation shines with its superpower as a reliable cash generator, driving strong returns on equity and robust free cash flow yields. However, its declining ROIC trend and weak liquidity ratios signal a point of vigilance. It fits well in aggressive growth portfolios willing to navigate operational risks for potential upside.
W. R. Berkley Corporation’s strategic moat lies in its disciplined capital allocation and solid interest coverage, underscoring financial resiliency. Compared to Allstate, it offers a safer profile with more stable income margins and a stronger dividend yield. It suits GARP investors seeking steady growth with reasonable risk control.
If you prioritize growth fueled by cash flow efficiency and can tolerate some balance sheet caution, Allstate is the compelling choice due to its superior earnings momentum. However, if you seek better stability and prudent financial management, W. R. Berkley offers a more balanced risk-return profile, albeit at a modest premium.
Disclaimer: Investment carries a risk of loss of initial capital. The past performance is not a reliable indicator of future results. Be sure to understand risks before making an investment decision.
Go Further
I encourage you to read the complete analyses of The Allstate Corporation and W. R. Berkley Corporation to enhance your investment decisions: