Home > Comparison > Financial Services > TRV vs ALL
The strategic rivalry between The Travelers Companies, Inc. (TRV) and The Allstate Corporation (ALL) defines the current trajectory of the U.S. property and casualty insurance sector. TRV operates as a diversified insurer with a strong commercial focus, while ALL emphasizes personal lines alongside protection services. This analysis pits TRV’s capital-efficient business mix against ALL’s broad product integration to determine which offers a superior risk-adjusted return for a well-diversified portfolio.

Table of contents
Companies Overview
The Travelers Companies, Inc. and The Allstate Corporation are heavyweight contenders in the U.S. property and casualty insurance sector.
The Travelers Companies, Inc.: Diverse Commercial & Personal Lines Leader
The Travelers Companies, Inc. dominates property and casualty insurance across commercial and personal segments. Its core revenue stems from underwriting business insurance, bond & specialty insurance, and personal insurance products. In 2026, the firm focuses on expanding tailored commercial accounts while leveraging broker and wholesale agent networks to enhance distribution efficiency.
The Allstate Corporation: Comprehensive Consumer-Focused Insurer
The Allstate Corporation specializes in broad-based personal and commercial insurance in the U.S. and Canada. Revenue primarily arises from private passenger auto, homeowners, specialty auto, and commercial lines, alongside protection services and health benefits. Its strategic emphasis in 2026 is on integrating technology-driven services like telematics and identity protection to deepen customer engagement and diversify income streams.
Strategic Collision: Similarities & Divergences
Both firms compete in property and casualty insurance but diverge strategically: Travelers prioritizes a segmented commercial approach, while Allstate pursues a holistic consumer ecosystem enhanced by tech-enabled services. Their primary battleground is market share in personal auto and homeowners insurance. Travelers offers a classic underwriting moat, whereas Allstate’s tech integration shapes a more dynamic investment profile.
Income Statement Comparison
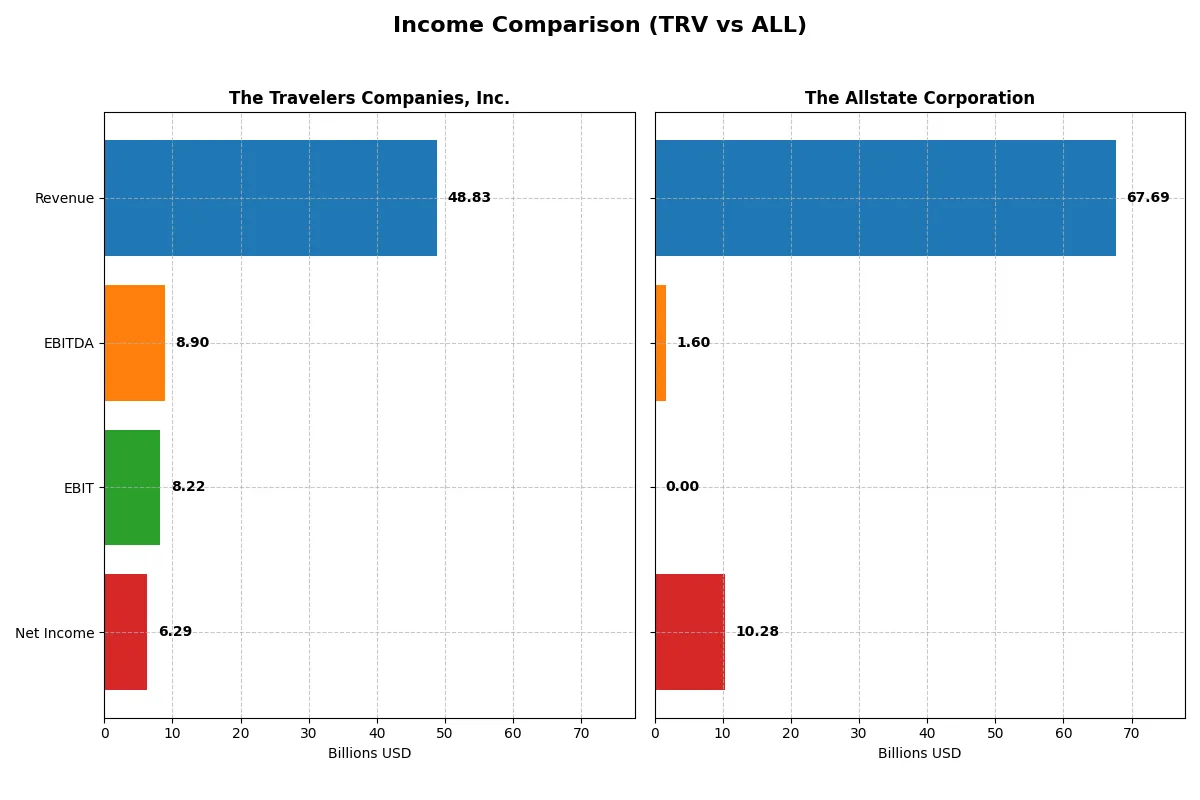
This data dissects the core profitability and scalability of both corporate engines to reveal who dominates the bottom line:
| Metric | The Travelers Companies, Inc. (TRV) | The Allstate Corporation (ALL) |
|---|---|---|
| Revenue | 48.8B | 67.7B |
| Cost of Revenue | 27.2B | 0 |
| Operating Expenses | 13.8B | 0 |
| Gross Profit | 21.6B | 0 |
| EBITDA | 8.9B | 1.6B |
| EBIT | 8.2B | 0 |
| Interest Expense | 425M | 399M |
| Net Income | 6.3B | 10.3B |
| EPS | 27.84 | 38.56 |
| Fiscal Year | 2025 | 2025 |
Income Statement Analysis: The Bottom-Line Duel
This income statement comparison reveals which company operates its business more efficiently and delivers superior profitability.
The Travelers Companies, Inc. Analysis
Travelers steadily grows revenue from 35B in 2021 to 49B in 2025, while net income more than doubles from 3.6B to 6.2B. Gross margin climbs to a strong 44.25%, supporting a healthy net margin near 13%. The latest year shows robust momentum with a 27.8% EPS increase, reflecting operational excellence despite rising expenses.
The Allstate Corporation Analysis
Allstate’s revenue rises from 48.7B in 2021 to 67.7B in 2025, yet gross profit disappears in 2025 due to zero reported cost of revenue. Net income surges from 1.6B in 2021 to 10.3B in 2025, driven by a massive 106.7% net margin growth and improved expense management. However, the absence of gross margin data clouds margin sustainability.
Margin Discipline vs. Top-Line Expansion
Travelers delivers consistent margin strength with balanced growth, while Allstate posts explosive net income gains despite margin opacity. Travelers’ clear gross and EBIT margins demonstrate operational efficiency. Allstate’s surge relies on unusual accounting entries that mask core profitability. For investors, Travelers’ profile offers transparency and margin resilience, whereas Allstate’s growth calls for cautious scrutiny.
Financial Ratios Comparison
These vital ratios act as a diagnostic tool to expose the underlying fiscal health, valuation premiums, and capital efficiency of the companies compared below:
| Ratios | Travelers (TRV) | Allstate (ALL) |
|---|---|---|
| ROE | 19.12% | 21.77% |
| ROIC | 12.10% | 4.12% |
| P/E | 10.34 | 10.92 |
| P/B | 1.98 | 2.38 |
| Current Ratio | 0.23 | 0.00 |
| Quick Ratio | 0.23 | 0.00 |
| D/E | 0.28 | 0.38 |
| Debt-to-Assets | 6.45% | 7.24% |
| Interest Coverage | 18.34 | 14.40 |
| Asset Turnover | 0.34 | 0.57 |
| Fixed Asset Turnover | 0.00 | 94.94 |
| Payout Ratio | 15.57% | 23.12% |
| Dividend Yield | 1.51% | 2.12% |
| Fiscal Year | 2025 | 2024 |
Efficiency & Valuation Duel: The Vital Signs
Financial ratios act as a company’s DNA, unveiling hidden risks and revealing operational efficiency beneath surface-level metrics.
The Travelers Companies, Inc.
Travelers posts a strong 19.1% ROE and a solid 12.9% net margin, signaling efficient core profitability. Its P/E ratio at 10.3 suggests the stock trades at a reasonable valuation. Shareholders benefit from a 1.5% dividend yield, reflecting steady returns alongside prudent capital allocation. However, the low current ratio of 0.23 flags potential liquidity concerns.
The Allstate Corporation
Allstate delivers an impressive 21.8% ROE but a more modest 7.4% net margin, indicating strong equity returns but thinner profitability. Its P/E ratio of 10.9 implies a fair valuation with a higher dividend yield of 2.1%, rewarding income-focused investors. The absence of reported interest coverage and zero current ratio raise caution on short-term financial flexibility.
Balanced Profitability vs. Dividend Appeal
Travelers offers a favorable mix of profitability and valuation with prudent debt levels, albeit with liquidity risks. Allstate provides higher equity returns and dividend income but exhibits weaker operating efficiency and possible financial strain. Investors prioritizing stable profits may lean toward Travelers; those seeking yield might favor Allstate’s profile.
Which one offers the Superior Shareholder Reward?
I observe that Travelers (TRV) delivers a more balanced and sustainable shareholder reward than Allstate (ALL). TRV yields 1.5% with a conservative 15.6% payout ratio, backed by solid free cash flow coverage and steady buybacks. ALL offers a higher 2.1% dividend yield with a 23.1% payout but shows more volatility in earnings and weaker dividend coverage. TRV’s disciplined capital allocation and lower leverage create a sturdier foundation for long-term value. I conclude Travelers offers a superior total return profile in 2026.
Comparative Score Analysis: The Strategic Profile
The radar chart reveals the fundamental DNA and trade-offs of both Travelers and Allstate, highlighting their operational strengths and valuation nuances:
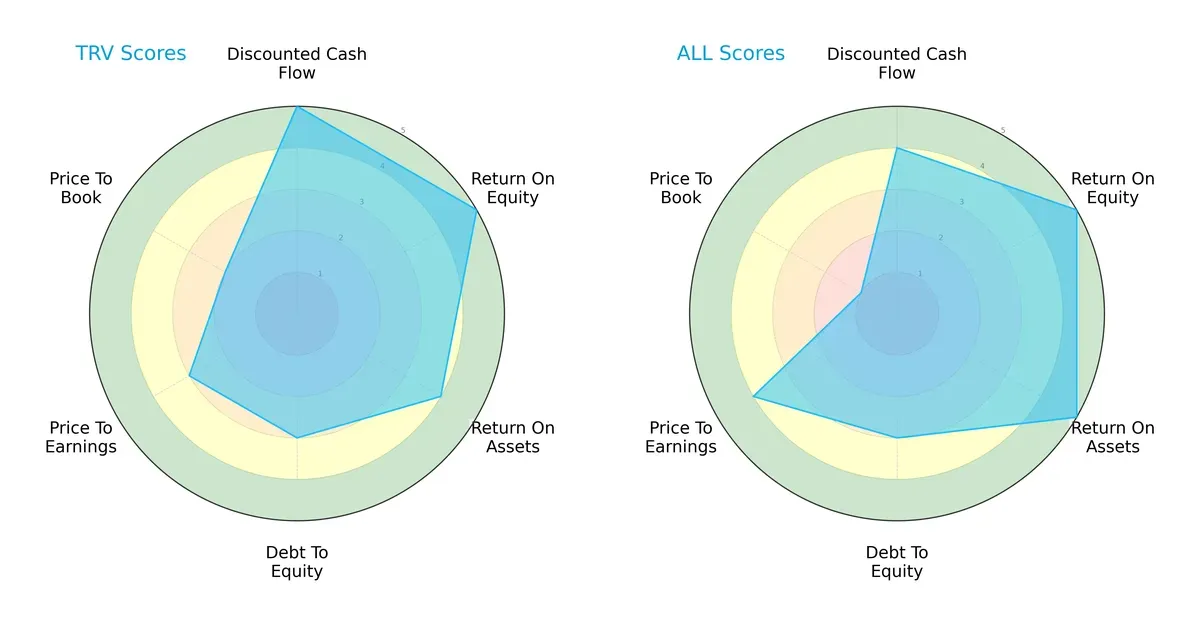
Travelers leads with a stronger discounted cash flow (5 vs. 4) and price-to-earnings score (3 vs. 4), indicating better cash flow prospects but a slightly less attractive earnings valuation. Allstate excels in return on assets (5 vs. 4) and price-to-book (1 vs. 2), reflecting superior asset efficiency but a more challenged book valuation. Both share moderate debt-to-equity (3) and equal return on equity (5). Travelers shows a more balanced valuation profile, while Allstate relies heavily on operational efficiency.
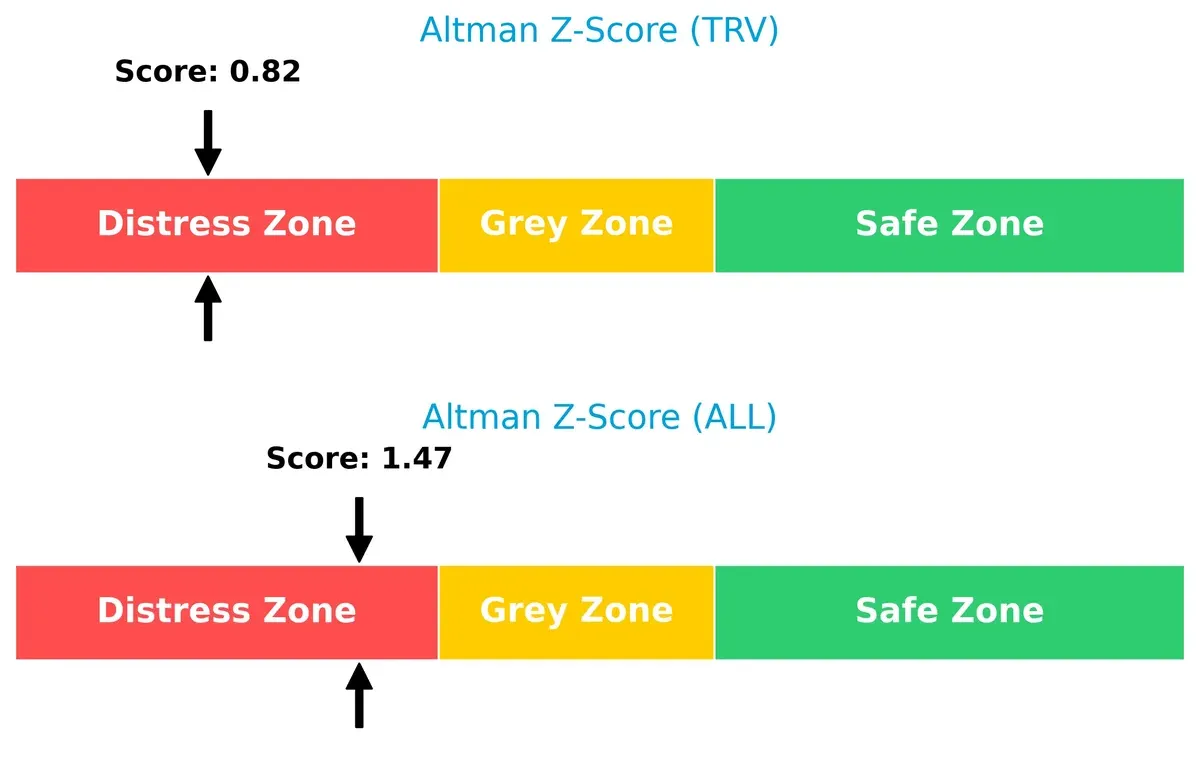
Bankruptcy Risk: Solvency Showdown
The Altman Z-Score delta reveals both firms operate in the distress zone, but Allstate (1.47) is closer to the grey zone than Travelers (0.82), suggesting marginally better long-term survival prospects in this cycle:
Financial Health: Quality of Operations
Both Travelers and Allstate register strong Piotroski F-Scores of 7, signaling robust financial health with no glaring red flags in internal metrics. Their operational quality appears well-maintained and reliable:

How are the two companies positioned?
This section dissects TRV and ALL’s operational DNA by comparing their revenue distribution and internal strengths and weaknesses. The goal: confront their economic moats to reveal which model offers the most resilient competitive advantage today.
Revenue Segmentation: The Strategic Mix
This visual comparison dissects how The Travelers Companies, Inc. and The Allstate Corporation diversify their income streams and where their primary sector bets lie:
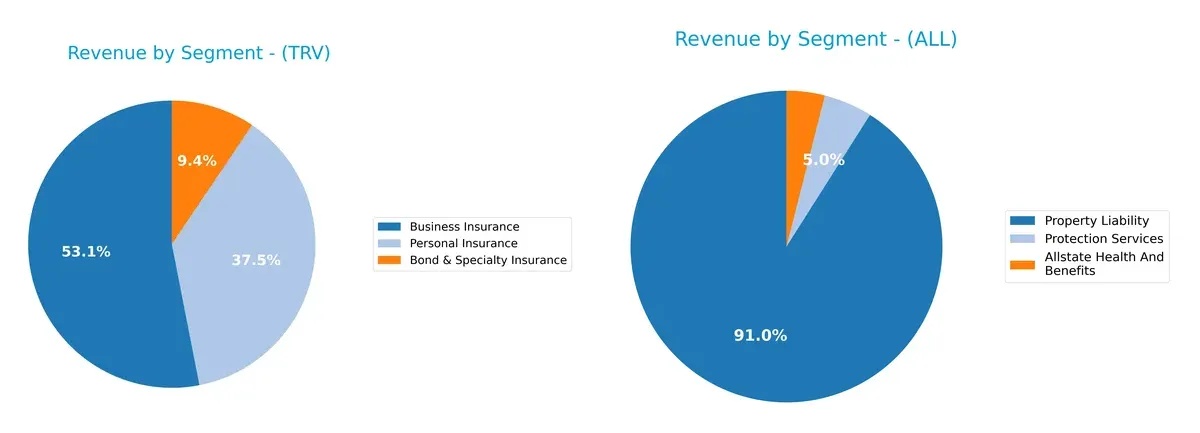
Travelers anchors its revenue in Business Insurance at $24.7B, with significant Personal Insurance ($17.4B) and Bond & Specialty Insurance ($4.4B) contributions, showing moderate diversification. Allstate dwarfs Travelers in Property Liability at $58.3B, dominating its portfolio while smaller segments like Health and Protection Services add depth. Travelers’ balanced mix suggests ecosystem lock-in across insurance niches; Allstate’s concentration signals infrastructure dominance but exposes it to Property Liability sector volatility.
Strengths and Weaknesses Comparison
This table compares the strengths and weaknesses of The Travelers Companies, Inc. (TRV) and The Allstate Corporation (ALL):
TRV Strengths
- Strong profitability with 12.88% net margin and 19.12% ROE
- Favorable ROIC at 12.1% above WACC
- Low debt to assets at 6.45% and strong interest coverage
- Diversified revenue streams across business, personal, and specialty insurance
- Significant U.S. market presence with growing international revenues
ALL Strengths
- High ROE of 21.77% indicating efficient capital use
- Favorable P/E ratio near 10.92
- Strong fixed asset turnover at 94.94 reflecting operational efficiency
- Higher dividend yield at 2.12%
- Largest revenue from property liability segment shows market share leadership
- Dominant U.S. presence with some European Union exposure
TRV Weaknesses
- Low current and quick ratios at 0.23 indicating liquidity risk
- Unfavorable asset turnover at 0.34 limits revenue generation from assets
- Fixed asset turnover is zero, signaling inefficiency or asset structure issues
- Neutral dividend yield at 1.51% may limit income-focused investor appeal
ALL Weaknesses
- Unavailable WACC complicates investment return evaluation
- Unfavorable ROIC at 4.12%, below optimal cost of capital
- Interest coverage of 0 raises solvency concerns
- Zero current and quick ratios indicate liquidity constraints
- Neutral asset turnover at 0.57 limits asset productivity
Overall, TRV’s strengths lie in robust profitability metrics and diversified insurance segments but faces liquidity and asset turnover challenges. ALL shows strong capital efficiency and operational turnover but is hindered by low ROIC, solvency signals, and liquidity issues. These factors shape each company’s strategic focus on balancing growth with financial resilience.
The Moat Duel: Analyzing Competitive Defensibility
A structural moat is the only true shield protecting long-term profits from relentless competition erosion. Let’s dissect the competitive fortresses of two insurance giants:
The Travelers Companies, Inc.: Robust Capital Efficiency Moat
Travelers relies on superior capital allocation and underwriting discipline, reflected in a strong ROIC outpacing its WACC by 6.1%. This moat delivers margin stability and sustained value creation. New product lines and international growth in 2026 may further deepen its competitive edge.
The Allstate Corporation: Brand and Distribution Moat with Slowing Efficiency
Allstate’s moat centers on brand recognition and broad distribution but suffers from declining ROIC trends. Despite robust net margin growth, operational efficiency weakens, challenging future profitability. Expansion into protection services offers growth, yet competitive pressures risk margin contraction.
Capital Efficiency vs. Brand Power: The Insurance Moat Showdown
Travelers commands a wider moat through superior capital returns and efficiency, while Allstate leans on brand strength but faces deteriorating ROIC. Travelers is better positioned to defend market share amid evolving industry dynamics.
Which stock offers better returns?
The past year shows strong gains for both stocks, with The Travelers Companies, Inc. outperforming The Allstate Corporation despite recent deceleration in momentum.
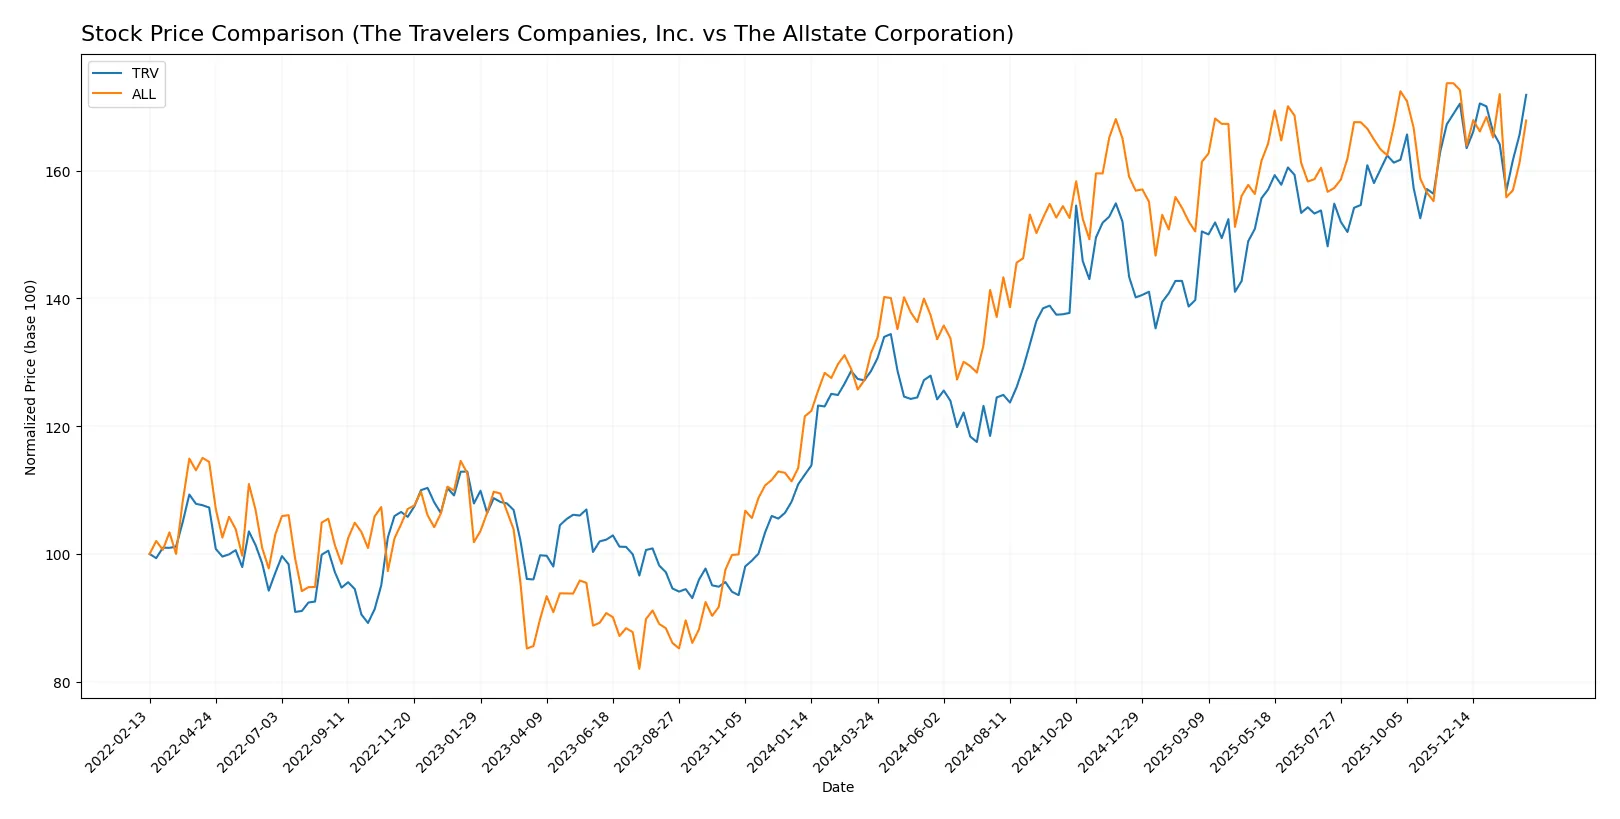
Trend Comparison
The Travelers Companies, Inc. rose 33.63% over the past 12 months, marking a bullish trend with decelerating gains and a high volatility level (std dev 25.28). Recent months show a mild 1.78% increase amid a slight downward slope.
The Allstate Corporation gained 27.69% over the same period, also bullish with decelerating momentum and lower volatility (std dev 15.05). Recently, it declined 3.36%, indicating a short-term bearish trend with increased selling pressure.
Travelers delivered higher total returns and sustained buyer dominance, while Allstate’s recent downturn and more neutral volume behavior suggest weaker near-term performance.
Target Prices
Analysts present a clear consensus on target prices for The Travelers Companies, Inc. and The Allstate Corporation.
| Company | Target Low | Target High | Consensus |
|---|---|---|---|
| The Travelers Companies, Inc. | 304 | 317 | 312.75 |
| The Allstate Corporation | 215 | 255 | 233.57 |
The Travelers’ target consensus at 312.75 suggests upside from the current 295.22 price, signaling moderate appreciation potential. Allstate’s consensus at 233.57 also implies a meaningful premium over its 207.12 price, reflecting optimistic analyst expectations.

Don’t Let Luck Decide Your Entry Point
Optimize your entry points with our advanced ProRealTime indicators. You’ll get efficient buy signals with precise price targets for maximum performance. Start outperforming now!
How do institutions grade them?
The Travelers Companies, Inc. Grades
The latest institutional grades for The Travelers Companies, Inc. are summarized below:
| Grading Company | Action | New Grade | Date |
|---|---|---|---|
| Cantor Fitzgerald | Maintain | Overweight | 2026-02-02 |
| Citigroup | Maintain | Sell | 2026-01-27 |
| Keefe, Bruyette & Woods | Maintain | Outperform | 2026-01-23 |
| Roth Capital | Maintain | Buy | 2026-01-23 |
| Mizuho | Maintain | Neutral | 2026-01-22 |
| Wells Fargo | Maintain | Equal Weight | 2026-01-22 |
| Cantor Fitzgerald | Maintain | Overweight | 2026-01-14 |
| Wells Fargo | Maintain | Equal Weight | 2026-01-13 |
| Barclays | Maintain | Equal Weight | 2026-01-08 |
| Evercore ISI Group | Maintain | Outperform | 2026-01-07 |
The Allstate Corporation Grades
The latest institutional grades for The Allstate Corporation are summarized below:
| Grading Company | Action | New Grade | Date |
|---|---|---|---|
| Wells Fargo | Maintain | Equal Weight | 2026-01-13 |
| TD Cowen | Downgrade | Hold | 2026-01-12 |
| Keefe, Bruyette & Woods | Maintain | Outperform | 2026-01-06 |
| William Blair | Downgrade | Market Perform | 2025-12-18 |
| Morgan Stanley | Downgrade | Equal Weight | 2025-12-16 |
| Roth Capital | Maintain | Buy | 2025-11-26 |
| Keefe, Bruyette & Woods | Maintain | Outperform | 2025-11-11 |
| UBS | Maintain | Buy | 2025-11-10 |
| Wells Fargo | Maintain | Equal Weight | 2025-11-07 |
| BMO Capital | Maintain | Outperform | 2025-11-07 |
Which company has the best grades?
The Travelers Companies, Inc. consistently receives higher grades such as Overweight and Outperform, while The Allstate Corporation shows several recent downgrades to Hold and Market Perform. Investors may view Travelers as having stronger institutional confidence, potentially influencing portfolio positioning.
Risks specific to each company
The following categories identify the critical pressure points and systemic threats facing both firms in the 2026 market environment:
1. Market & Competition
The Travelers Companies, Inc. (TRV)
- Operates through diversified insurance segments, facing intense competition in commercial and personal lines.
The Allstate Corporation (ALL)
- Competes across multiple insurance and protection services segments, dealing with evolving customer preferences and digital disruption.
2. Capital Structure & Debt
The Travelers Companies, Inc. (TRV)
- Maintains low debt-to-equity (0.28) and strong interest coverage (19.34), signaling financial stability.
The Allstate Corporation (ALL)
- Slightly higher debt-to-equity (0.38) and zero interest coverage raise concerns on debt servicing capacity.
3. Stock Volatility
The Travelers Companies, Inc. (TRV)
- Exhibits moderate beta of 0.517, reflecting moderate market sensitivity and stock stability.
The Allstate Corporation (ALL)
- Displays low beta of 0.235, indicating lower volatility but potentially less upside participation.
4. Regulatory & Legal
The Travelers Companies, Inc. (TRV)
- Faces standard regulatory scrutiny typical of U.S. property & casualty insurers, with exposure to evolving state laws.
The Allstate Corporation (ALL)
- Encounters complex regulatory environments across U.S. and Canada, increasing compliance costs and legal risks.
5. Supply Chain & Operations
The Travelers Companies, Inc. (TRV)
- Operational focus on brokers and wholesale agents may limit rapid digital adaptation.
The Allstate Corporation (ALL)
- Broad distribution channels including call centers and mobile apps enhance operational reach but raise complexity.
6. ESG & Climate Transition
The Travelers Companies, Inc. (TRV)
- Faces climate risks in underwriting property & casualty insurance, especially for natural disasters.
The Allstate Corporation (ALL)
- Increasing exposure to climate risk in personal and commercial lines, with growing investor pressure on ESG disclosures.
7. Geopolitical Exposure
The Travelers Companies, Inc. (TRV)
- Primarily U.S.-focused with some international exposure, limiting geopolitical volatility impact.
The Allstate Corporation (ALL)
- Operates in U.S. and Canada, potentially affected by cross-border regulatory and economic tensions.
Which company shows a better risk-adjusted profile?
Travelers’ strongest risk lies in operational liquidity, given its low current and quick ratios. Allstate’s most pressing risk is its weak interest coverage, impairing debt sustainability. Travelers’ better debt metrics and higher profitability underpin a stronger risk-adjusted profile despite liquidity concerns. Notably, Travelers’ Altman Z-score lands deep in the distress zone (0.82), signaling urgent solvency risk, whereas Allstate’s higher asset turnover and stronger Piotroski score suggest more operational efficiency but lingering financial fragility. Overall, Travelers edges ahead on risk-adjusted fundamentals but requires close monitoring of liquidity pressures.
Final Verdict: Which stock to choose?
The Travelers Companies, Inc. (TRV) excels as a value creator with a robust and growing economic moat. Its superpower lies in delivering consistent, high returns on invested capital well above its cost of capital. A point of vigilance remains its low liquidity ratios, which might challenge short-term resilience. TRV fits well in portfolios targeting steady, aggressive growth underpinned by operational efficiency.
The Allstate Corporation (ALL) boasts a strategic moat centered on brand recognition and recurring revenue streams, offering a safety cushion relative to TRV. While ALL’s ROIC lags, its higher dividend yield and moderate valuation appeal to investors seeking a blend of growth and income. It suits portfolios emphasizing growth at a reasonable price with moderate risk tolerance.
If you prioritize sustainable value creation and operational excellence, TRV outshines due to its expanding moat and superior capital efficiency. However, if you seek income stability combined with growth potential, ALL offers better stability and a compelling dividend profile despite a weaker moat. Each presents a distinct analytical scenario tailored to specific investor goals.
Disclaimer: Investment carries a risk of loss of initial capital. The past performance is not a reliable indicator of future results. Be sure to understand risks before making an investment decision.
Go Further
I encourage you to read the complete analyses of The Travelers Companies, Inc. and The Allstate Corporation to enhance your investment decisions: