Home > Comparison > Financial Services > PGR vs ALL
The strategic rivalry between The Progressive Corporation and The Allstate Corporation shapes the current landscape of the property and casualty insurance sector. Progressive operates as a diversified insurer with a strong focus on personal and commercial auto lines, while Allstate combines traditional insurance with protection services spanning health, identity, and roadside assistance. This analysis compares their distinct operational models to identify which offers superior risk-adjusted returns for a diversified portfolio in 2026.

Table of contents
Companies Overview
The Progressive Corporation and The Allstate Corporation are heavyweight contenders in the U.S. property and casualty insurance market.
The Progressive Corporation: Specialty Auto and Property Insurance Leader
The Progressive Corporation dominates personal and commercial auto insurance in the U.S. Its core revenue derives from underwriting personal autos, recreational vehicles, and commercial fleet policies. In 2026, Progressive sharpens its focus on expanding digital channels and refining risk segmentation to boost underwriting profitability and customer acquisition.
The Allstate Corporation: Diversified Property & Casualty Powerhouse
The Allstate Corporation commands a broad portfolio including auto, homeowners, and specialty insurance across the U.S. and Canada. It generates revenue through multiple segments ranging from personal lines to health and consumer protection services. In 2026, Allstate accelerates integration of telematics and analytics, aiming to enhance pricing precision and cross-sell opportunities.
Strategic Collision: Similarities & Divergences
Progressive emphasizes a niche leadership in auto insurance with a tech-forward approach, while Allstate pursues a diversified insurance ecosystem complemented by data-driven product innovation. The battleground lies in capturing personal auto market share using analytics and customer experience. Their distinct investment profiles stem from Progressive’s sharper underwriting focus versus Allstate’s broader, multi-segment diversification.
Income Statement Comparison
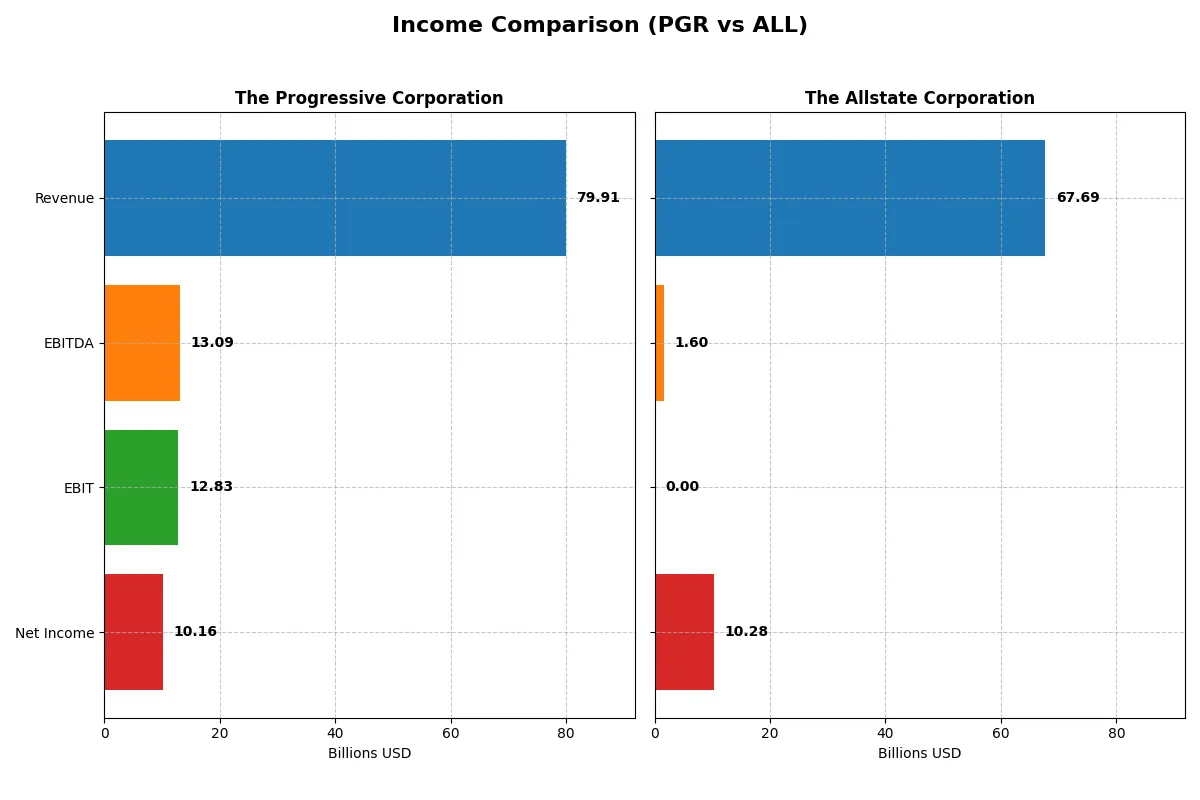
This data dissects the core profitability and scalability of both corporate engines to reveal who dominates the bottom line:
| Metric | The Progressive Corporation (PGR) | The Allstate Corporation (ALL) |
|---|---|---|
| Revenue | 79.9B | 67.7B |
| Cost of Revenue | 55.3B | 0 |
| Operating Expenses | 11.8B | 0 |
| Gross Profit | 24.6B | 0 |
| EBITDA | 13.1B | 1.6B |
| EBIT | 12.8B | 0 |
| Interest Expense | 255M | 399M |
| Net Income | 10.2B | 10.3B |
| EPS | 17.27 | 38.56 |
| Fiscal Year | 2025 | 2025 |
Income Statement Analysis: The Bottom-Line Duel
This income statement comparison reveals which company operates with superior efficiency and sustainable profit momentum in a competitive market.
The Progressive Corporation Analysis
Progressive’s revenue grew steadily from $47.7B in 2021 to $79.9B in 2025, with net income expanding from $3.3B to $10.2B. Its gross margin held favorably at 30.8%, while net margin improved to 12.7%. In 2025, earnings momentum accelerated with a nearly 20% EPS rise, showing strong operational leverage despite a slight rise in operating expenses.
The Allstate Corporation Analysis
Allstate’s revenue climbed from $48.7B in 2021 to $67.7B in 2025, while net income surged from $1.5B to $10.3B. However, gross and EBIT margins collapsed in 2025, reflecting unusual accounting or operational shifts, despite a solid net margin of 15.2%. Earnings per share doubled over the last year, driven by substantial non-operating gains rather than core profit growth.
Margin Power vs. Revenue Scale
Progressive demonstrates consistent margin expansion and steady operating profit growth, signaling robust core business execution. Allstate posts stronger net income growth but relies heavily on non-operating items, which masks weak gross and operating profitability. For investors prioritizing sustainable earnings quality, Progressive’s profile offers greater reliability and operational strength.
Financial Ratios Comparison
These vital ratios act as a diagnostic tool to expose the underlying fiscal health, valuation premiums, and capital efficiency of the companies analyzed below:
| Ratios | The Progressive Corporation (PGR) | The Allstate Corporation (ALL) |
|---|---|---|
| ROE | 2.23% | 21.77% |
| ROIC | 9.30% | 4.12% |
| P/E | 13.19 | 10.92 |
| P/B | 29.35 | 2.38 |
| Current Ratio | 0 | 0 |
| Quick Ratio | 0 | 0 |
| D/E (Debt-to-Equity) | 0 | 0.38 |
| Debt-to-Assets | 0 | 7.24% |
| Interest Coverage | 50.33 | 14.40 |
| Asset Turnover | 0.88 | 0.57 |
| Fixed Asset Turnover | 0 | 94.94 |
| Payout ratio | 28.37% | 23.12% |
| Dividend yield | 2.15% | 2.12% |
| Fiscal Year | 2025 | 2024 |
Efficiency & Valuation Duel: The Vital Signs
Financial ratios act as a company’s DNA, unveiling its operational strengths and hidden financial risks that influence investment decisions.
The Progressive Corporation
The Progressive Corporation displays a robust 222.5% ROE and strong 12.7% net margin, signaling high profitability. Its P/E ratio at 13.19 suggests fair valuation, though a high PB ratio of 29.35 indicates some overvaluation in equity price. The firm rewards shareholders with a 2.15% dividend yield, underscoring consistent returns.
The Allstate Corporation
The Allstate Corporation posts a solid 21.8% ROE but a more moderate 7.35% net margin. Its 10.92 P/E ratio suggests undervaluation compared to peers, while a reasonable 2.38 PB ratio reflects balanced equity pricing. Allstate pays a 2.12% dividend yield, maintaining steady income for investors despite some weaker operational metrics.
Premium Valuation vs. Operational Safety
Progressive offers superior profitability and a slightly higher dividend yield but trades with a stretched book value multiple. Allstate presents a more conservative valuation and decent returns but lags in operational efficiency. Investors favoring growth may lean toward Progressive; those seeking valuation discipline might prefer Allstate.
Which one offers the Superior Shareholder Reward?
I find The Progressive Corporation (PGR) delivers a more balanced and sustainable shareholder reward than The Allstate Corporation (ALL) in 2026. PGR offers a 2.15% dividend yield with a conservative 28% payout ratio, supported by strong free cash flow and robust buybacks. ALL matches PGR’s dividend yield at 2.12% but maintains a higher payout ratio of 23%, with slightly weaker free cash flow coverage. PGR’s aggressive buyback program enhances total returns, while ALL’s leverage and lower cash reserves raise sustainability concerns. I conclude PGR offers superior long-term value creation and total return potential for investors today.
Comparative Score Analysis: The Strategic Profile
The radar chart reveals the fundamental DNA and trade-offs of The Progressive Corporation and The Allstate Corporation:
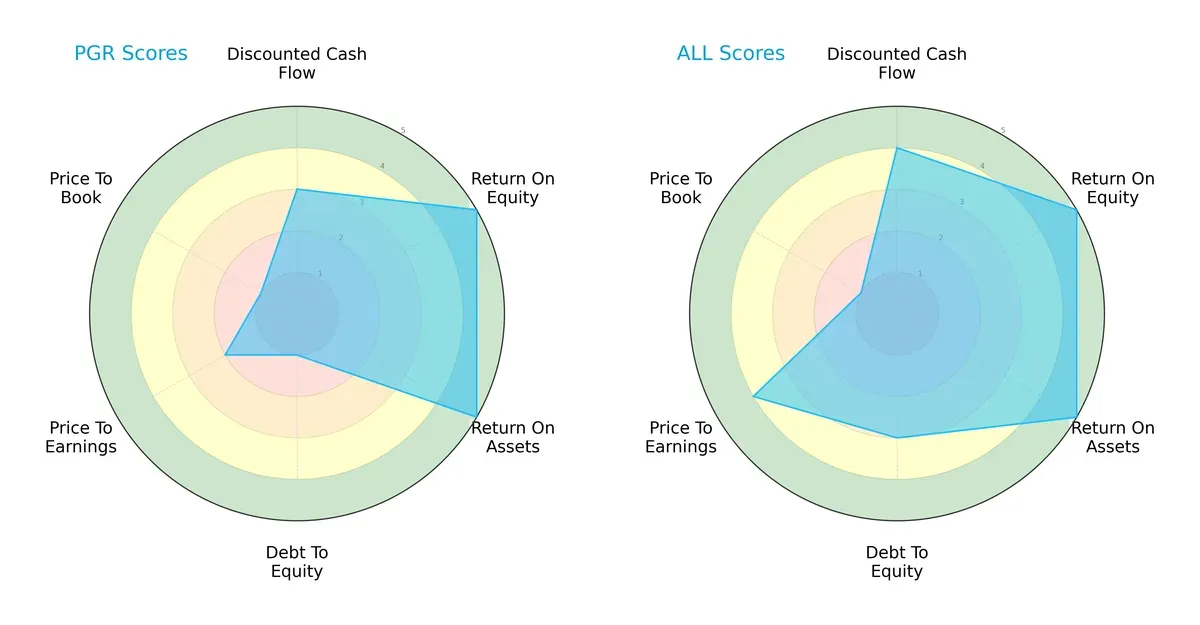
The Allstate Corporation boasts a more balanced profile with favorable DCF (4 vs. 3), moderate debt-to-equity (3 vs. 1), and stronger valuation scores (P/E 4 vs. 2). The Progressive Corporation leans heavily on operational efficiency with very favorable ROE and ROA scores (both 5) but suffers from a weak balance sheet and valuation metrics. Allstate’s diversified strength suggests better risk management, while Progressive relies on profitability edges.
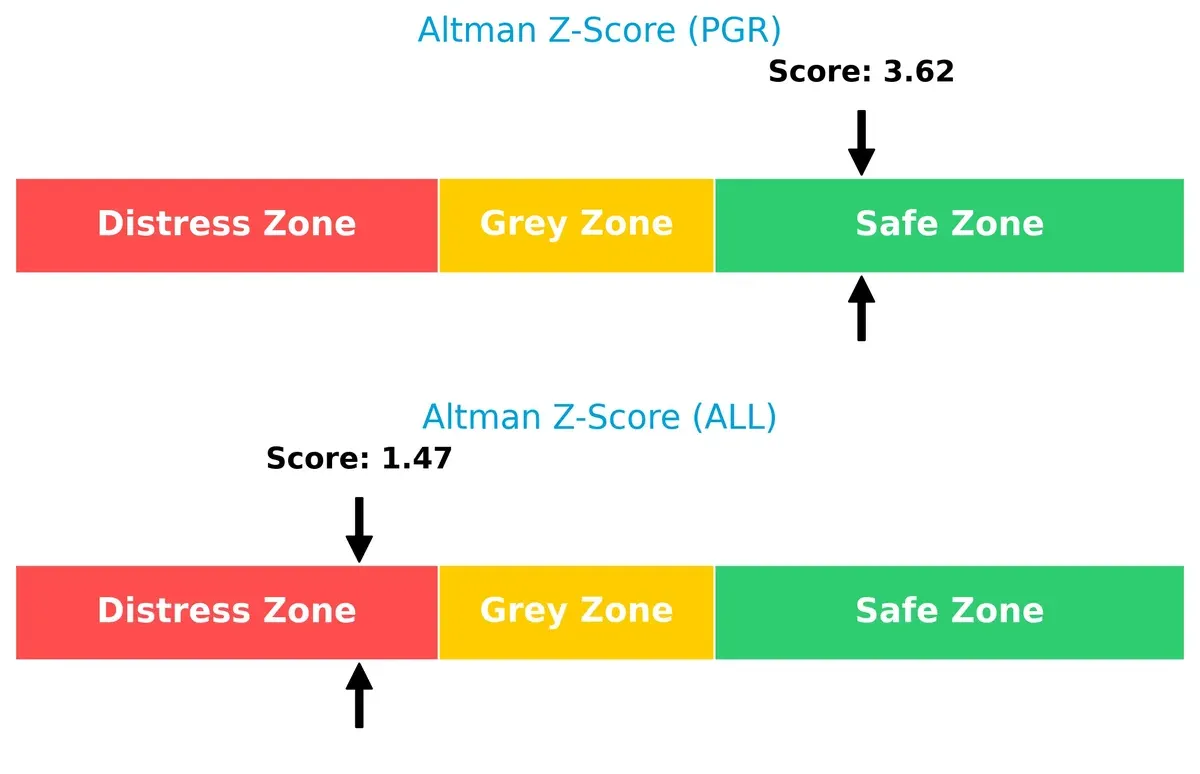
Bankruptcy Risk: Solvency Showdown
The Progressive Corporation’s Altman Z-Score of 3.62 places it safely above distress, implying solid long-term survival. In contrast, The Allstate Corporation’s 1.47 signals distress and heightened bankruptcy risk in this cycle:
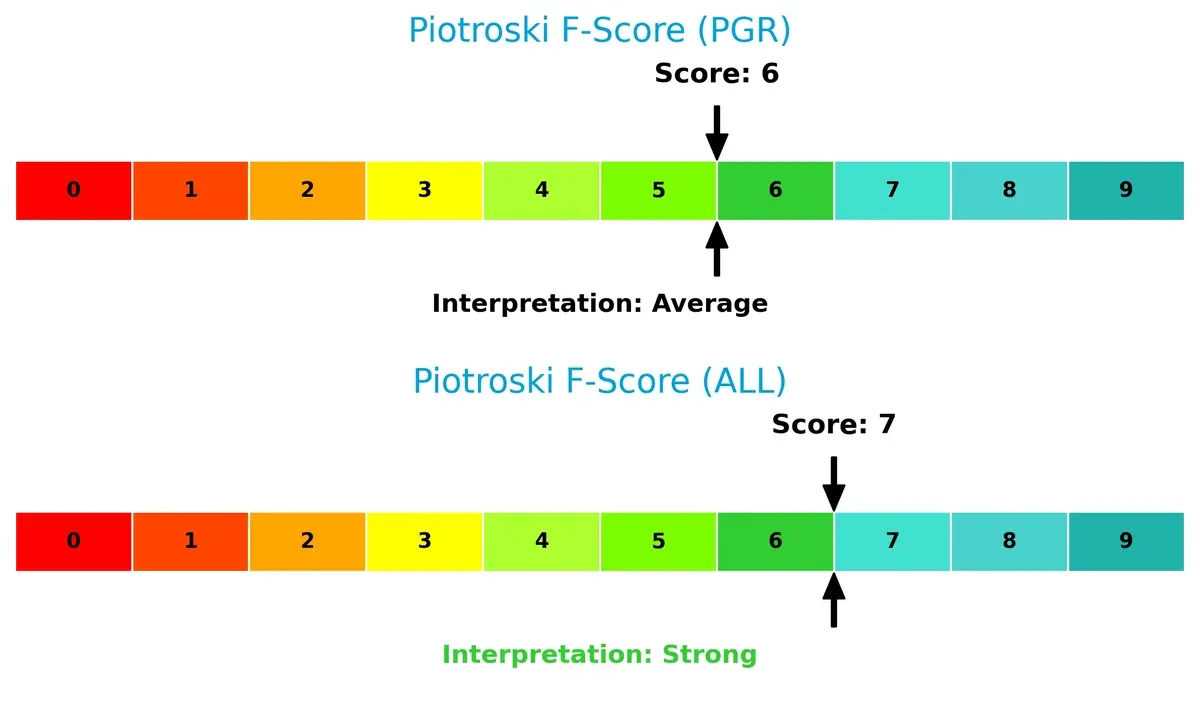
Financial Health: Quality of Operations
The Allstate Corporation edges out with a Piotroski F-Score of 7, indicating strong financial health. The Progressive Corporation’s score of 6 is average, suggesting minor internal weaknesses compared to Allstate:
How are the two companies positioned?
This section dissects the operational DNA of Progressive and Allstate by comparing their revenue distribution and internal dynamics. The goal is to confront their economic moats, revealing which model offers the most resilient competitive edge today.
Revenue Segmentation: The Strategic Mix
This visual comparison dissects how The Progressive Corporation and The Allstate Corporation diversify income streams and where their primary sector bets lie:
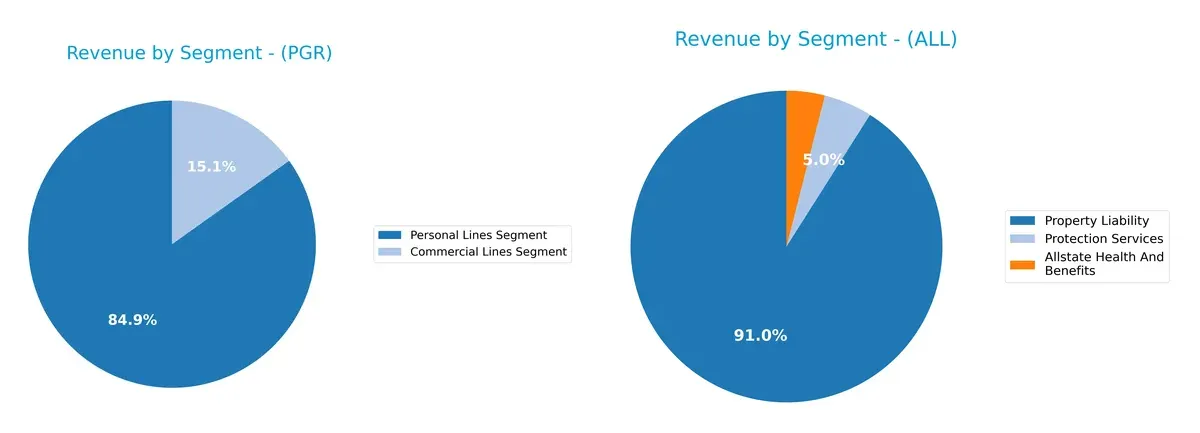
The Progressive Corporation anchors its revenue in Personal Lines at $60.9B, with Commercial Lines at $10.9B, showing moderate diversification. In contrast, The Allstate Corporation relies heavily on Property Liability at $58.3B, while Health and Protection Services contribute smaller, steady streams. Progressive’s mix reduces concentration risk, while Allstate’s dominance in Property Liability signals infrastructure strength but increased exposure to that segment’s volatility.
Strengths and Weaknesses Comparison
This table compares the strengths and weaknesses of The Progressive Corporation and The Allstate Corporation:
The Progressive Corporation Strengths
- High net margin at 12.72%
- Extremely strong ROE at 222.54%
- Favorable WACC below 6%
- Robust interest coverage at 50.33
- Diverse revenue from commercial and personal lines
- Stable dividend yield at 2.15%
The Allstate Corporation Strengths
- Favorable ROE at 21.77%
- Strong fixed asset turnover at 94.94
- Favorable debt-to-assets ratio at 7.24%
- Diverse product mix including health, protection, and property liability
- Consistent dividend yield at 2.12%
- Significant U.S. revenue base over 54B
The Progressive Corporation Weaknesses
- Unfavorable high PB ratio at 29.35 indicating expensive valuation
- Zero current and quick ratios reflect liquidity concerns
- Zero debt-to-equity ratio may suggest under-leveraging
- Neutral ROIC at 9.3% compared to WACC
- Unfavorable fixed asset turnover at 0
The Allstate Corporation Weaknesses
- Neutral net margin at 7.35%
- Unfavorable ROIC at 4.12% below ideal profitability
- Unavailable WACC data limits cost of capital assessment
- Zero current and quick ratios indicate liquidity risks
- Interest coverage is zero, signaling financial stress
The Progressive Corporation shows exceptional profitability and low capital costs but faces liquidity and valuation challenges. The Allstate Corporation has solid asset management and product diversification, yet profitability and liquidity metrics reveal areas requiring strategic attention.
The Moat Duel: Analyzing Competitive Defensibility
A structural moat is the sole barrier protecting long-term profits from relentless competition erosion. Let’s dissect the foundations of durability for these insurers:
The Progressive Corporation: Data-Driven Pricing Mastery
Progressive’s moat stems from its proprietary data analytics and pricing algorithms. This drives high ROIC above WACC by 4%, reflecting efficient capital use and margin stability. In 2026, expanding telematics and direct-to-consumer tech could deepen this advantage.
The Allstate Corporation: Brand Strength with Waning Efficiency
Allstate relies on brand recognition and diversified insurance offerings, a contrast to Progressive’s tech edge. However, its ROIC trend declines, signaling weakening capital efficiency. Opportunities exist in health and protection services, but competitive pressure challenges moat sustainability.
Progressive’s Algorithmic Edge vs. Allstate’s Brand Resilience
Progressive holds a wider, growing moat with superior capital returns and innovation leverage. I view Progressive as better equipped to defend market share against evolving competition in 2026.
Which stock offers better returns?
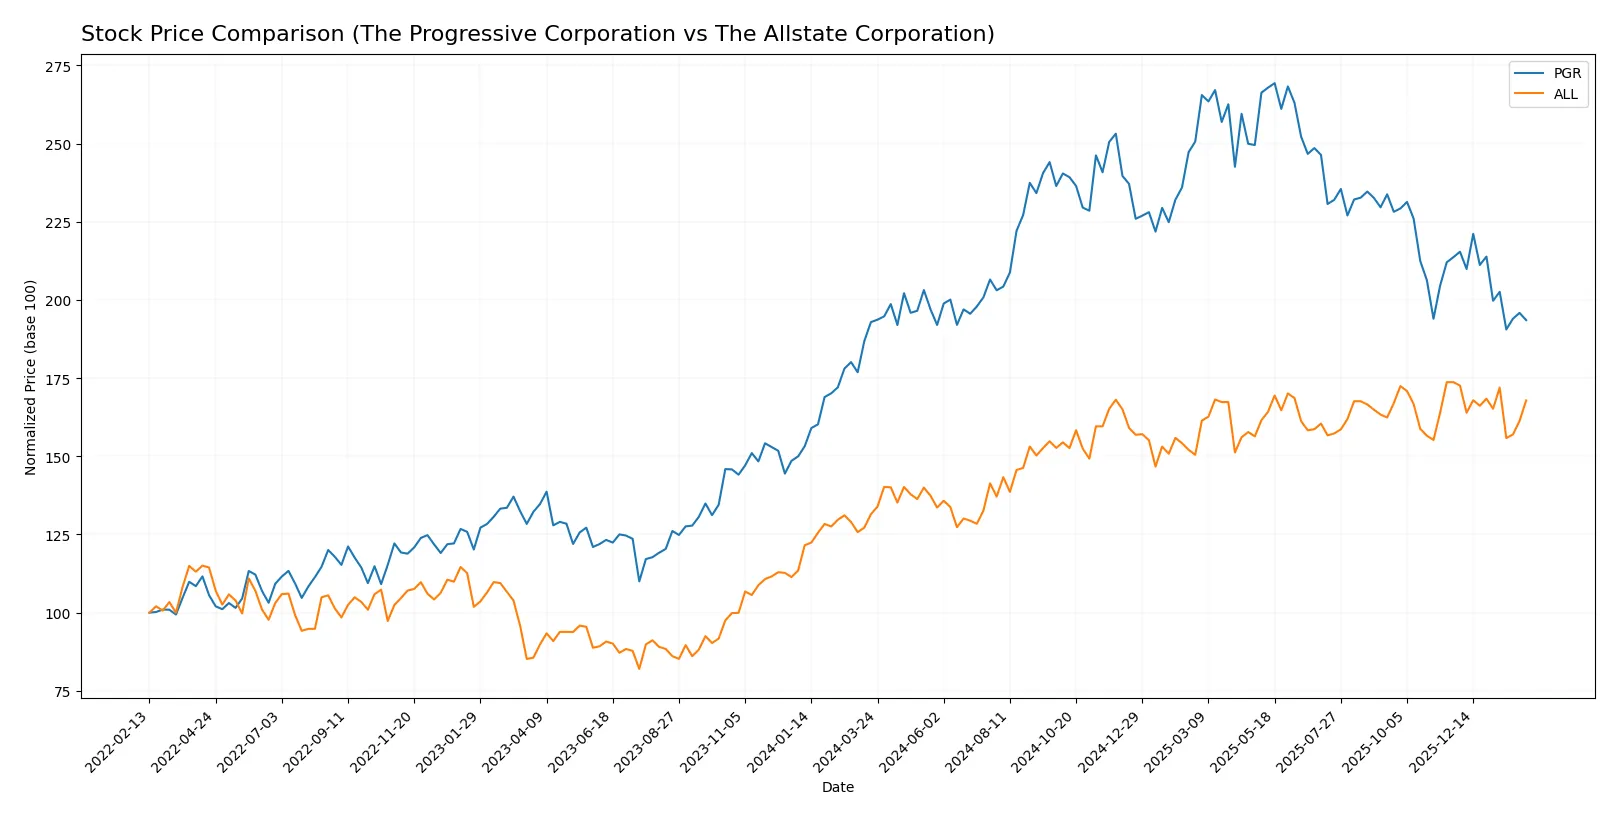
The past year shows The Progressive Corporation’s price edging up 0.32%, while The Allstate Corporation surged 27.69%, both with decelerating bullish momentum.
Trend Comparison
The Progressive Corporation’s stock rose 0.32% over the past 12 months, reflecting a mild bullish trend with decelerating gains and high volatility (24.33 std dev). Its price peaked at 286.03 and bottomed at 202.37.
The Allstate Corporation’s stock increased 27.69% over the same period, marking a strong bullish trend despite deceleration. It showed lower volatility (15.05 std dev) with a high of 214.32 and a low of 157.07.
Comparing trends, Allstate outperformed Progressive, delivering substantially higher returns and steadier price appreciation over the past year.
Target Prices
Analysts show a clear bullish consensus for The Progressive Corporation and The Allstate Corporation.
| Company | Target Low | Target High | Consensus |
|---|---|---|---|
| The Progressive Corporation | 214 | 265 | 236.55 |
| The Allstate Corporation | 215 | 255 | 233.57 |
Both stocks trade below their target consensus, suggesting analysts expect upside potential near 15%–20%. This reflects positive sentiment in the property and casualty insurance sector.

Don’t Let Luck Decide Your Entry Point
Optimize your entry points with our advanced ProRealTime indicators. You’ll get efficient buy signals with precise price targets for maximum performance. Start outperforming now!
How do institutions grade them?
Here is a summary of recent institutional grades for The Progressive Corporation and The Allstate Corporation:
The Progressive Corporation Grades
The table below shows recent grade actions by reputable firms for The Progressive Corporation.
| Grading Company | Action | New Grade | Date |
|---|---|---|---|
| Citigroup | Maintain | Buy | 2026-02-04 |
| Keefe, Bruyette & Woods | Maintain | Market Perform | 2026-01-30 |
| Wells Fargo | Maintain | Equal Weight | 2026-01-29 |
| Morgan Stanley | Maintain | Underweight | 2026-01-29 |
| BMO Capital | Maintain | Market Perform | 2026-01-29 |
| BMO Capital | Maintain | Market Perform | 2026-01-15 |
| Wells Fargo | Maintain | Equal Weight | 2026-01-13 |
| Barclays | Upgrade | Overweight | 2026-01-08 |
| JP Morgan | Maintain | Overweight | 2026-01-07 |
| Evercore ISI Group | Maintain | In Line | 2026-01-07 |
The Allstate Corporation Grades
Below is a table detailing recent grade actions by recognized institutions for The Allstate Corporation.
| Grading Company | Action | New Grade | Date |
|---|---|---|---|
| Wells Fargo | Maintain | Equal Weight | 2026-01-13 |
| TD Cowen | Downgrade | Hold | 2026-01-12 |
| Keefe, Bruyette & Woods | Maintain | Outperform | 2026-01-06 |
| William Blair | Downgrade | Market Perform | 2025-12-18 |
| Morgan Stanley | Downgrade | Equal Weight | 2025-12-16 |
| Roth Capital | Maintain | Buy | 2025-11-26 |
| Keefe, Bruyette & Woods | Maintain | Outperform | 2025-11-11 |
| UBS | Maintain | Buy | 2025-11-10 |
| Wells Fargo | Maintain | Equal Weight | 2025-11-07 |
| BMO Capital | Maintain | Outperform | 2025-11-07 |
Which company has the best grades?
The Progressive Corporation generally receives more positive grades, including Buy and Overweight ratings, while The Allstate Corporation shows more downgrades and mixed ratings. Investors might see The Progressive Corporation as favored by analysts, potentially reflecting stronger momentum or outlook.
Risks specific to each company
The following categories identify the critical pressure points and systemic threats facing both firms in the 2026 market environment:
1. Market & Competition
The Progressive Corporation
- Operates in a highly competitive P&C insurance market with strong digital direct sales. Faces pressure from innovative insurtech entrants.
The Allstate Corporation
- Competes broadly across personal, commercial, and health insurance segments, with a diversified product mix but intense competition in auto insurance.
2. Capital Structure & Debt
The Progressive Corporation
- Shows a very favorable debt profile with no significant leverage and strong interest coverage (50.33x).
The Allstate Corporation
- Maintains moderate leverage (D/E 0.38) but weak interest coverage (0.0), increasing financial risk under tightening credit conditions.
3. Stock Volatility
The Progressive Corporation
- Beta of 0.318 indicates low stock volatility, providing defensive qualities amid market swings.
The Allstate Corporation
- Even lower beta of 0.235, signaling slightly more stability but limited upside in volatile markets.
4. Regulatory & Legal
The Progressive Corporation
- Subject to stringent US insurance regulations; exposure to evolving data privacy laws could raise compliance costs.
The Allstate Corporation
- Faces regulatory risks in both the US and Canada, with potential complexities from cross-border insurance laws and health insurance regulations.
5. Supply Chain & Operations
The Progressive Corporation
- Relies heavily on digital platforms and agency networks; operational risks include IT disruptions and cybersecurity threats.
The Allstate Corporation
- Diverse distribution channels including agents and call centers; operational complexity may increase costs and reduce efficiency.
6. ESG & Climate Transition
The Progressive Corporation
- Faces climate-related underwriting risks, especially in property insurance, requiring adaptive risk models and capital buffers.
The Allstate Corporation
- Similar climate exposure plus added reputational risk from health and benefits business lines amid rising ESG scrutiny.
7. Geopolitical Exposure
The Progressive Corporation
- Primarily US-focused, limiting geopolitical risk but vulnerable to domestic policy shifts.
The Allstate Corporation
- US and Canadian operations increase geopolitical complexity, particularly with changing trade and regulatory policies between the two countries.
Which company shows a better risk-adjusted profile?
The Progressive Corporation’s strongest risk factor is its exposure to competitive disruption in a fast-evolving P&C insurance market. Allstate’s most pressing risk lies in its weak interest coverage, signaling financial vulnerability under stress. I see Progressive’s conservative leverage and strong liquidity as key advantages. Despite Allstate’s broader product diversification, its financial fragility and distress-zone Altman Z-score reduce its risk-adjusted appeal. Progressive’s low beta and very favorable debt metrics justify its more resilient risk profile in 2026.
Final Verdict: Which stock to choose?
The Progressive Corporation’s superpower lies in its robust value creation, evidenced by a very favorable moat and sustainable ROIC growth. It excels in profitability and cash flow generation, though its elevated price-to-book ratio and liquidity metrics call for vigilance. This stock aligns well with aggressive growth portfolios seeking durable competitive advantages.
The Allstate Corporation benefits from a strategic moat grounded in solid recurring revenue streams and a more balanced debt profile. While its ROIC trend disappoints, Allstate offers a safer investment profile relative to Progressive, with a favorable overall rating and stronger price momentum. It suits GARP investors aiming for stable growth with reasonable valuations.
If you prioritize durable economic moats and proven value creation, Progressive outshines due to its consistent ROIC superiority and earnings growth. However, if you seek better stability and a more moderate valuation, Allstate offers superior risk management despite weaker moat signals. Both present distinct analytical scenarios based on investor risk tolerance and growth preference.
Disclaimer: Investment carries a risk of loss of initial capital. The past performance is not a reliable indicator of future results. Be sure to understand risks before making an investment decision.
Go Further
I encourage you to read the complete analyses of The Progressive Corporation and The Allstate Corporation to enhance your investment decisions: