Home > Comparison > Industrials > TDG vs TXT
The strategic rivalry between TransDigm Group Incorporated and Textron Inc. shapes the Aerospace & Defense industry’s evolution. TransDigm operates as a specialized aircraft components supplier, emphasizing high-margin, engineered products. Textron blends aircraft manufacturing with diversified industrial and finance operations, reflecting a broader operational model. This analysis assesses which company’s trajectory—focused specialization versus diversified scale—offers superior risk-adjusted returns for a well-rounded portfolio.
Table of contents
Companies Overview
TransDigm Group Incorporated and Textron Inc. stand as pivotal players in aerospace and defense, shaping industry innovation and supply chains.
TransDigm Group Incorporated: Precision Components Specialist
TransDigm dominates the aerospace components market by designing and supplying high-margin, specialized aircraft parts globally. Its revenue depends on diverse segments including power & control and airframe products, serving airlines, military agencies, and maintenance providers. In 2026, the company emphasizes expanding proprietary technologies and aftermarket services, strengthening its competitive moat through engineered uniqueness.
Textron Inc.: Diversified Aerospace and Industrial Conglomerate
Textron operates across aircraft manufacturing, defense systems, industrial products, and finance, generating revenue from both product sales and service contracts. Its broad portfolio ranges from business jets to armored vehicles, supporting a global customer base. Strategic focus in 2026 targets innovation in unmanned systems and industrial solutions, enhancing horizontal integration to capture cross-sector opportunities.
Strategic Collision: Similarities & Divergences
Both companies thrive in aerospace and defense but differ sharply in approach. TransDigm pursues a niche, proprietary parts strategy, while Textron embraces a diversified, integrated product and service model. Their primary battleground is the global aerospace supply chain, with TransDigm focusing on aftermarket components and Textron on full aircraft and defense systems. This contrast defines distinct risk-return profiles for investors seeking specialization versus diversification.
Income Statement Comparison
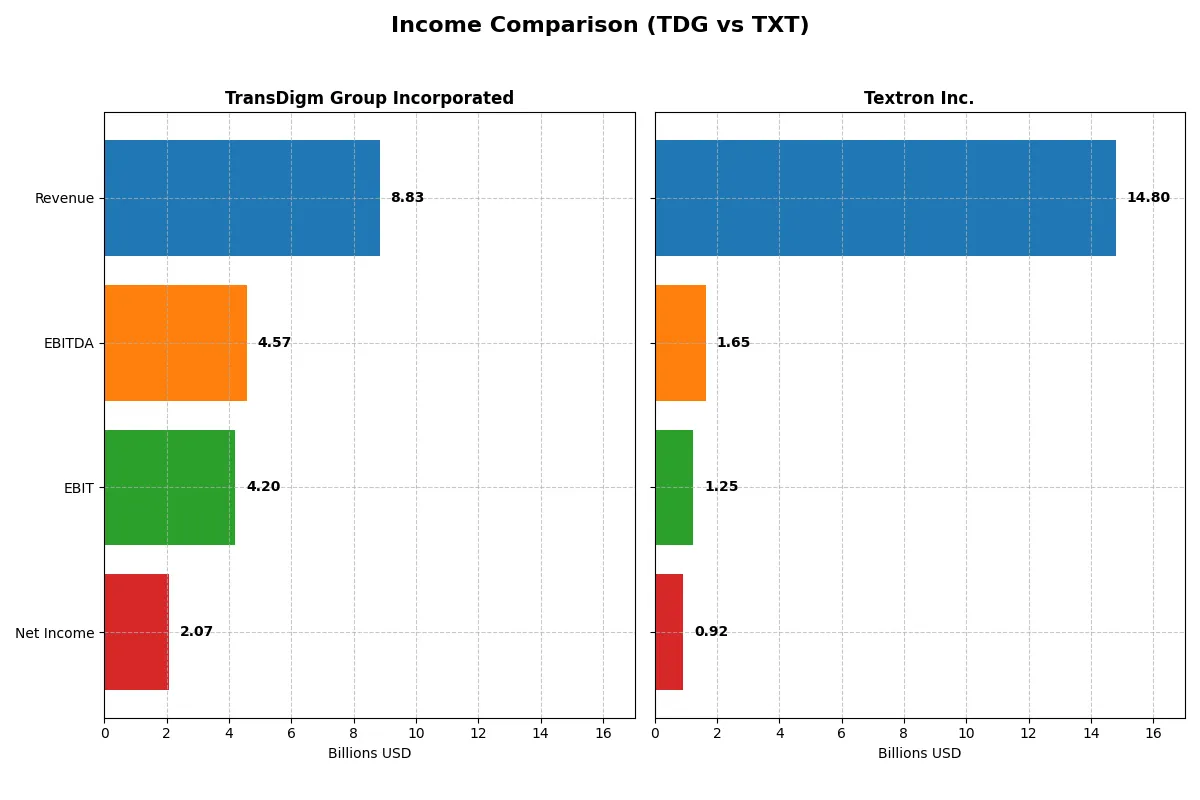
This data dissects the core profitability and scalability of both corporate engines to reveal who dominates the bottom line:
| Metric | TransDigm Group Incorporated (TDG) | Textron Inc. (TXT) |
|---|---|---|
| Revenue | 8.8B | 14.8B |
| Cost of Revenue | 3.5B | 12.3B |
| Operating Expenses | 1.15B | 1.25B |
| Gross Profit | 5.3B | 2.5B |
| EBITDA | 4.57B | 1.65B |
| EBIT | 4.2B | 1.25B |
| Interest Expense | 1.57B | 97M |
| Net Income | 2.07B | 921M |
| EPS | 32.08 | 5.11 |
| Fiscal Year | 2025 | 2025 |
Income Statement Analysis: The Bottom-Line Duel
This income statement comparison reveals which company operates with superior efficiency and momentum in turning revenue into profit.
TransDigm Group Incorporated Analysis
TransDigm’s revenue surged from 4.8B in 2021 to 8.8B in 2025, with net income more than doubling to 2.07B. The company maintains a robust gross margin above 60% and a strong net margin near 23.5%, reflecting high operational leverage. In 2025, TransDigm accelerated EBIT growth by nearly 20%, showcasing impressive margin expansion and disciplined cost control despite significant interest expenses.
Textron Inc. Analysis
Textron’s revenue grew steadily from 12.4B in 2021 to 14.8B in 2025, but net income rose more modestly to 921M. The gross margin hovers around 17%, limiting profitability despite favorable interest expense control below 1%. In 2025, Textron improved EBIT by nearly 20%, but its net margin remains a subdued 6.2%, indicating less efficient cost management and weaker conversion of sales into bottom-line profit.
Margin Power vs. Revenue Scale
TransDigm clearly outperforms Textron on profitability and margin expansion, delivering superior net income growth and efficiency. Textron’s larger revenue base grows steadily but with constrained margins and lower net income gains. Investors prioritizing margin strength and earnings momentum will find TransDigm’s profile more compelling than Textron’s scale-focused but less profitable model.
Financial Ratios Comparison
These vital ratios act as a diagnostic tool to expose the underlying fiscal health, valuation premiums, and capital efficiency of the companies analyzed:
| Ratios | TransDigm Group Incorporated (TDG) | Textron Inc. (TXT) |
|---|---|---|
| ROE | -21.4% | 11.7% |
| ROIC | 15.2% | 9.4% |
| P/E | 37.0x | 17.0x |
| P/B | -7.9 | 2.0 |
| Current Ratio | 3.21 | 5.94 |
| Quick Ratio | 2.25 | 2.33 |
| D/E | -3.10 | 0.45 |
| Debt-to-Assets | 131.1% | 19.5% |
| Interest Coverage | 2.65x | 12.9x |
| Asset Turnover | 0.39 | 0.82 |
| Fixed Asset Turnover | 5.59 | 5.71 |
| Payout ratio | 4.64% | 2.1% |
| Dividend yield | 0.13% | 0.12% |
| Fiscal Year | 2025 | 2025 |
Efficiency & Valuation Duel: The Vital Signs
Financial ratios act as the company’s DNA, revealing hidden risks and operational excellence that shape investor confidence and valuation.
TransDigm Group Incorporated
TransDigm shows strong profitability with a 23.49% net margin and a favorable 15.22% ROIC above its 6.95% WACC, signaling efficient capital use. However, its -21.41% ROE and stretched 36.99 P/E suggest shareholder returns face pressure. The 12.55% dividend yield partially offsets concerns, reflecting a balanced capital return approach.
Textron Inc.
Textron posts moderate profitability with a 6.22% net margin and 9.41% ROIC, both neutral versus benchmarks. Its 17.04 P/E is reasonable, indicating fair valuation. The 11.7% ROE underpins operational steadiness, but the negligible 0.12% dividend yield suggests shareholder rewards rely more on reinvestment and growth strategies.
Valuation Stretch vs. Operational Stability
TransDigm’s high P/E and negative ROE raise caution despite strong margins and dividend yield. Textron offers steadier returns with balanced valuations and reinvestment potential. Investors favoring income might lean toward TransDigm; those seeking operational safety may prefer Textron’s profile.
Which one offers the Superior Shareholder Reward?
I see TransDigm (TDG) delivers a robust 12.55% dividend yield with a modest 4.64% payout ratio, signaling strong free cash flow coverage. Its aggressive buybacks amplify total return, but heavy leverage raises caution. Textron (TXT) offers a scant 0.12% yield and a 2% payout, favoring reinvestment over distributions. TXT’s buybacks are modest, supporting steady growth but limited income. Given TDG’s high yield and buyback intensity, it offers a superior shareholder reward in 2026, albeit with higher risk from leverage.
Comparative Score Analysis: The Strategic Profile
The radar chart reveals the fundamental DNA and strategic trade-offs of TransDigm Group Incorporated and Textron Inc.:
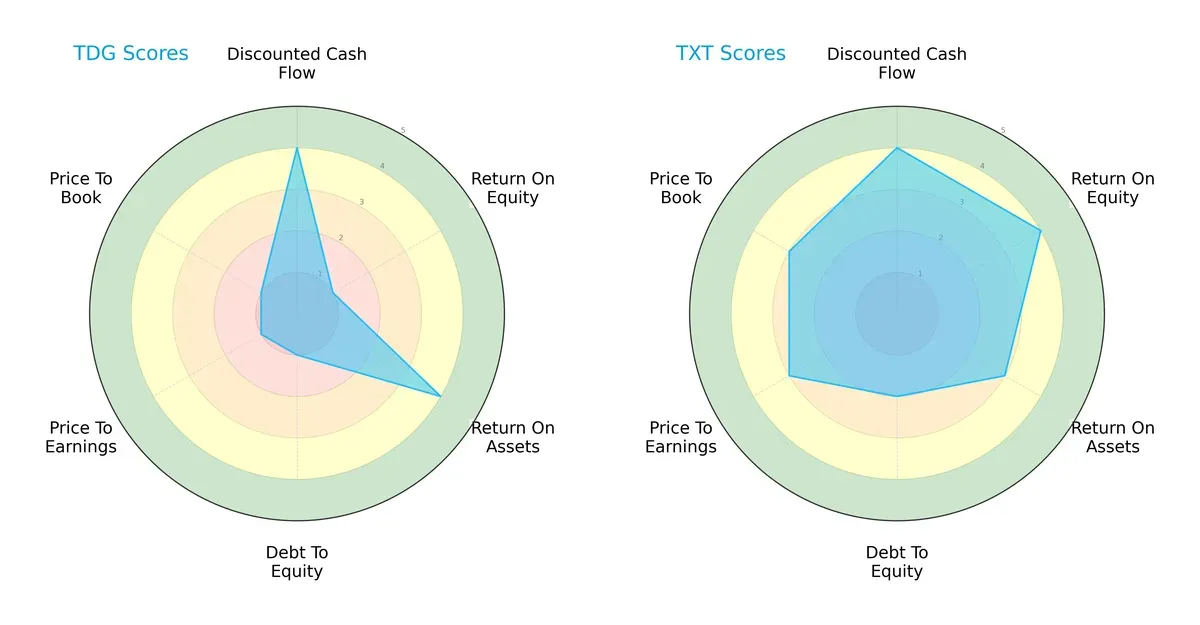
TransDigm excels in discounted cash flow and return on assets, but suffers from weak return on equity, debt management, and valuation scores. Textron presents a more balanced profile, with solid returns and moderate leverage and valuation metrics. Textron’s diversified strengths contrast with TransDigm’s reliance on operational efficiency despite financial risk.
Bankruptcy Risk: Solvency Showdown
Both companies sit in the Altman Z-Score grey zone, indicating moderate bankruptcy risk in the current cycle:
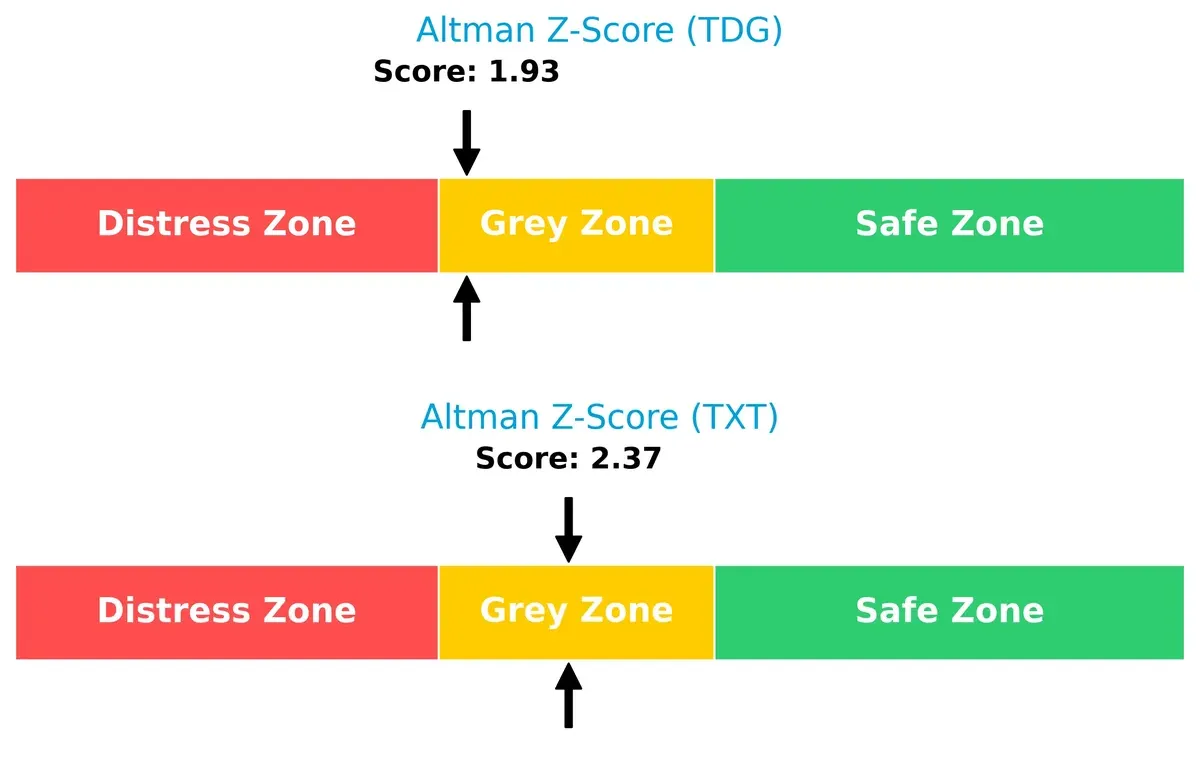
Textron’s higher Z-Score (2.37) suggests better solvency resilience than TransDigm (1.93), although both require cautious monitoring as economic headwinds could pressure weaker balance sheets.
Financial Health: Quality of Operations
Both firms score a strong 7 on the Piotroski F-Score, reflecting robust financial health and operational quality:
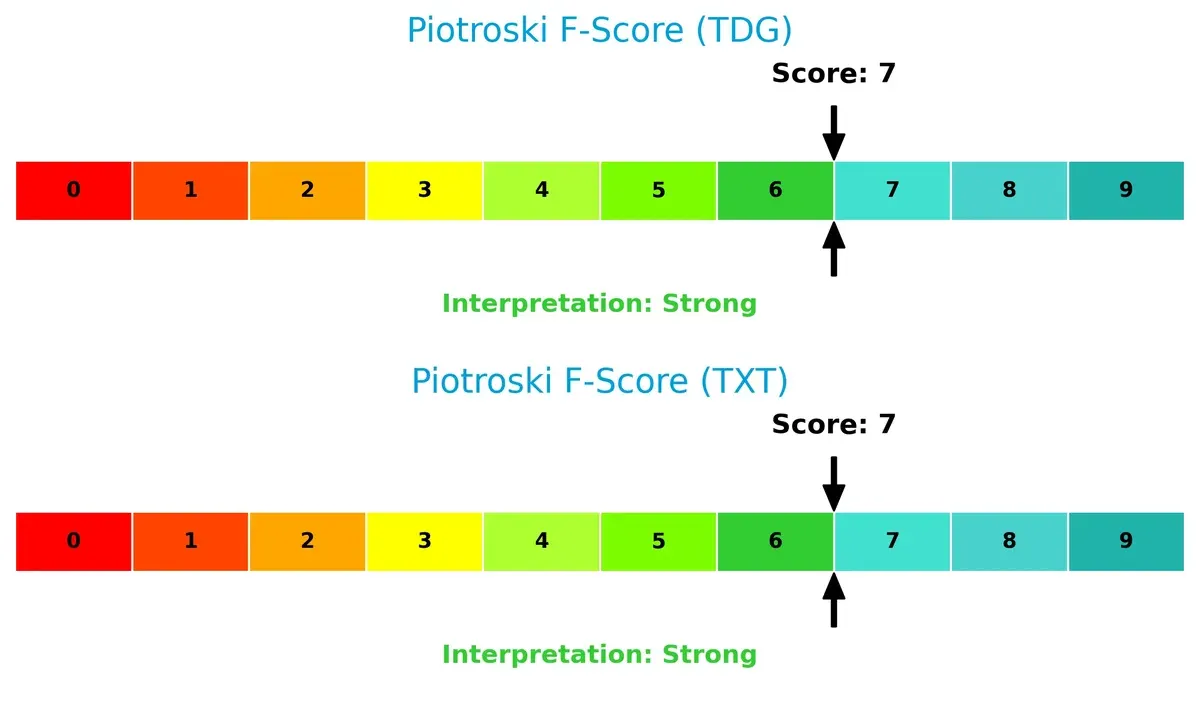
This parity suggests neither company shows internal red flags in profitability, leverage, liquidity, or efficiency, affirming solid fundamentals despite differing external risks.
How are the two companies positioned?
This section dissects the operational DNA of TDG and TXT by comparing their revenue distribution and internal dynamics. The final goal is to confront their economic moats to identify which model offers the most resilient and sustainable competitive advantage today.
Revenue Segmentation: The Strategic Mix
This visual comparison dissects how TransDigm Group and Textron diversify their income streams and highlights their primary sector bets:
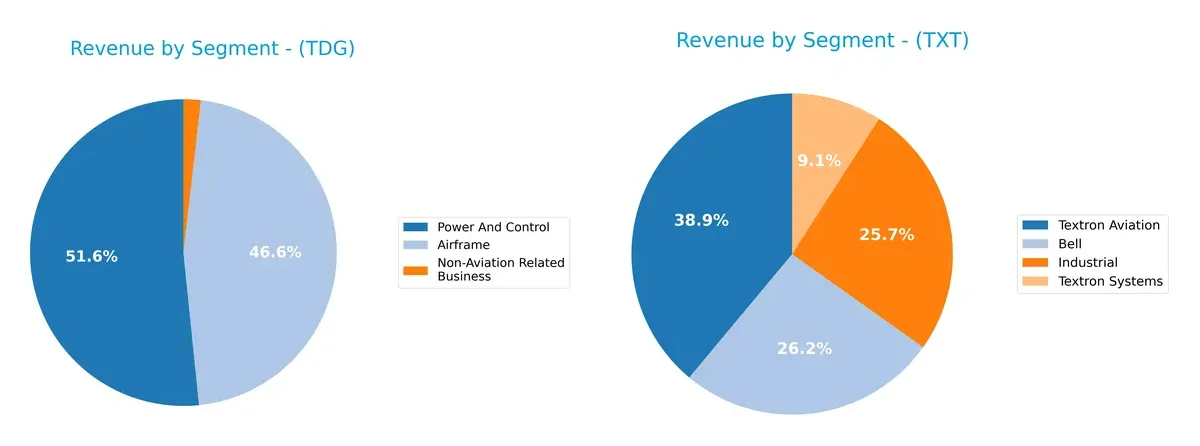
TransDigm anchors revenue in two key segments: Power And Control leads with $4.56B, closely followed by Airframe at $4.11B in 2025, showing moderate diversification. Textron pivots around Textron Aviation, which dwarfs others at $5.32B, while Bell and Industrial contribute roughly $3.58B and $3.52B respectively, revealing a more balanced but aviation-centric portfolio. TransDigm’s concentration risks contrast with Textron’s ecosystem lock-in across multiple aerospace and industrial sectors.
Strengths and Weaknesses Comparison
This table compares the Strengths and Weaknesses of TransDigm Group Incorporated (TDG) and Textron Inc. (TXT):
TDG Strengths
- High net margin at 23.49% indicating strong profitability
- ROIC of 15.22% above WACC shows effective capital allocation
- Diversified revenue streams with Airframe and Power and Control segments
- Significant U.S. and Non-U.S. sales supporting geographic diversification
- Favorable fixed asset turnover of 5.59 signaling operational efficiency
TXT Strengths
- Balanced revenue across Bell, Industrial, Textron Aviation, and Textron Systems segments
- Moderate profitability with neutral net margin and ROIC
- Strong interest coverage at 12.84 indicating low financial risk
- Favorable debt-to-assets ratio of 19.49% reflects prudent leverage
- Large U.S. market presence supplemented by European and international sales
TDG Weaknesses
- Negative ROE at -21.41% signals shareholder value erosion
- High debt-to-assets ratio at 131.08% raises solvency concerns
- Unfavorable price-to-earnings ratio at 36.99 suggests overvaluation
- Low asset turnover of 0.39 points to less efficient asset use
- Unfavorable current ratio at 3.21 may indicate working capital mismanagement
TXT Weaknesses
- Neutral net margin of 6.22% shows limited profitability
- Unfavorable dividend yield at 0.12% may deter income investors
- Relatively high current ratio at 5.94 could signal inefficient asset use
- Neutral asset turnover of 0.82 suggests average operational efficiency
- Moderate ROIC of 9.41% only slightly above WACC, limiting competitive advantage
Both companies present slightly favorable overall financial profiles but with contrasting risk exposures. TDG’s high profitability contrasts with solvency risks, while TXT shows more balanced leverage but modest profitability. This dynamic suggests differing strategic priorities in managing growth and financial stability.
The Moat Duel: Analyzing Competitive Defensibility
A structural moat shields long-term profits from relentless competition and market pressure. Here’s how two aerospace giants defend their turf:
TransDigm Group Incorporated: Intangible Assets Moat
TransDigm leverages proprietary aerospace components and patented designs, driving a 47.6% EBIT margin and 72.9% ROIC growth since 2021. Expansion into non-US markets in 2026 could deepen this moat.
Textron Inc.: Diversified Industrial Moat
Textron relies on diversified aviation and defense segments, with moderate margins and a 61.7% ROIC growth. Its broad product base contrasts with TransDigm’s specialized focus, offering resilience but a shallower economic moat.
Specialized Innovation vs. Diversified Stability
TransDigm’s wider moat stems from high-margin focus and sustained ROIC well above WACC. Textron shows improving profitability but still sheds value relative to capital cost. TransDigm is better positioned to defend and grow market share amid aerospace competition.
Which stock offers better returns?
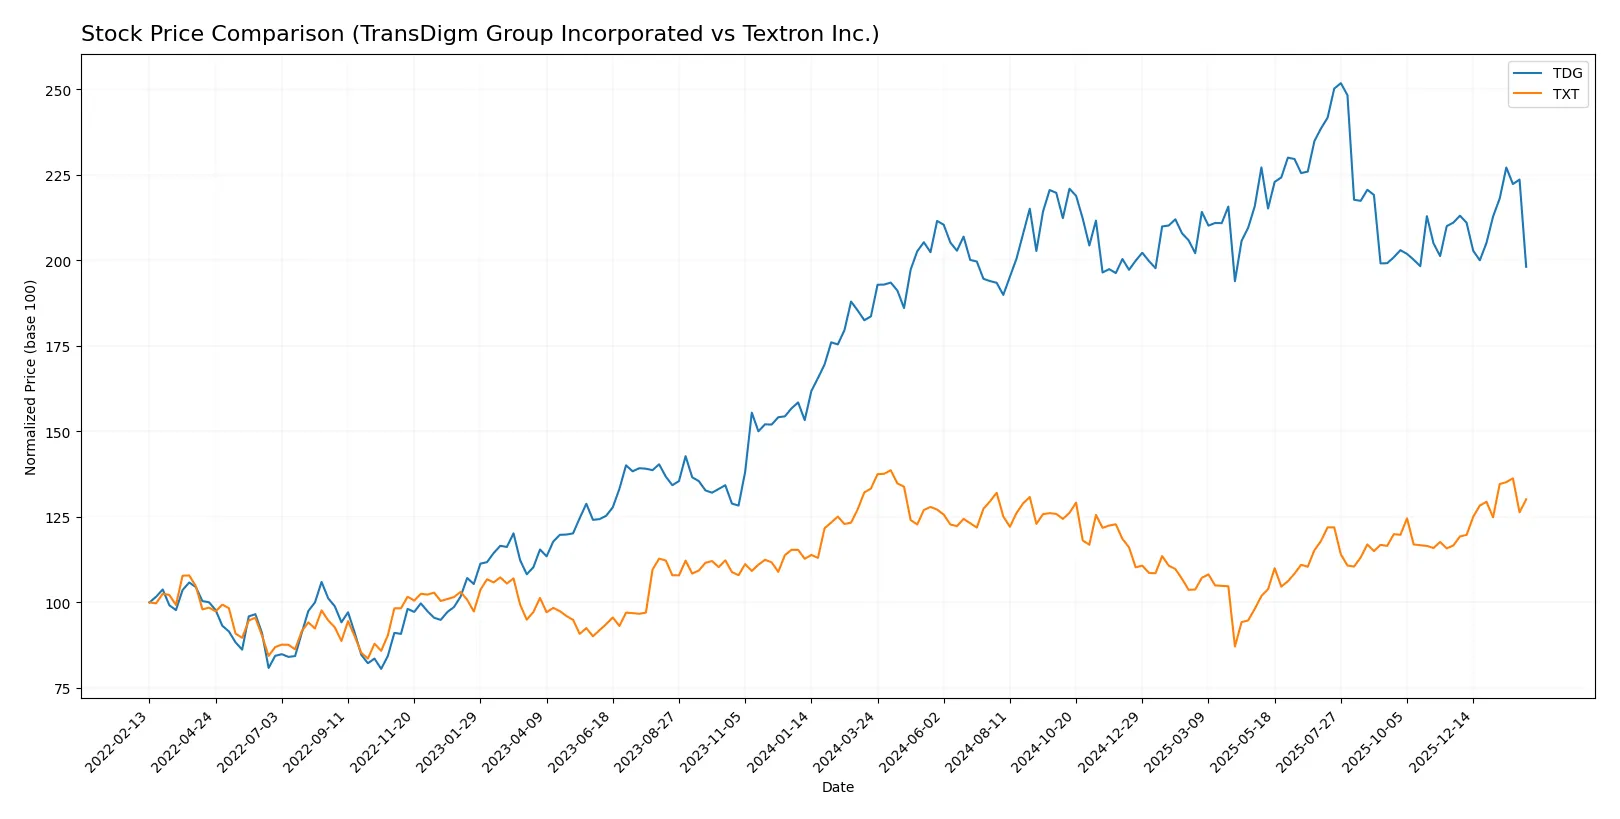
Over the past year, TransDigm Group Incorporated showed a clear upward price movement with accelerating gains, while Textron Inc. experienced an overall decline despite recent positive momentum.
Trend Comparison
TransDigm Group Incorporated’s stock gained 7.9% over the past 12 months, marking a bullish trend with accelerating price growth and a high volatility level at 85.88. The stock hit a peak of 1607.45 and a low of 1172.2.
Textron Inc.’s stock declined by 2.35% over 12 months, indicating a bearish trend but with accelerating movement. Recent months show a strong 11.56% gain, though overall volatility remains low at 7.22, with highs at 96.65 and lows at 60.72.
Comparing both, TransDigm delivered the highest market performance over the year, sustaining a bullish, accelerating trend versus Textron’s overall bearish direction despite recent strength.
Target Prices
Analysts present a clear target price consensus for TransDigm Group Incorporated and Textron Inc.
| Company | Target Low | Target High | Consensus |
|---|---|---|---|
| TransDigm Group Incorporated | 1370 | 1871 | 1582 |
| Textron Inc. | 92 | 110 | 101 |
The consensus target prices for both companies indicate upside potential versus current prices ($1265 for TransDigm, $90.73 for Textron). Analysts expect TransDigm’s strong aerospace niche to sustain growth while Textron’s diversified industrial portfolio supports moderate gains.

Don’t Let Luck Decide Your Entry Point
Optimize your entry points with our advanced ProRealTime indicators. You’ll get efficient buy signals with precise price targets for maximum performance. Start outperforming now!
How do institutions grade them?
The following tables summarize recent institutional grades for both companies:
TransDigm Group Incorporated Grades
This table shows recent grades and recommendations from reputable institutions.
| Grading Company | Action | New Grade | Date |
|---|---|---|---|
| UBS | Maintain | Buy | 2026-02-04 |
| UBS | Maintain | Buy | 2026-01-15 |
| JP Morgan | Maintain | Neutral | 2025-11-14 |
| Morgan Stanley | Maintain | Overweight | 2025-11-14 |
| Stifel | Maintain | Buy | 2025-11-13 |
| BMO Capital | Maintain | Outperform | 2025-11-13 |
| UBS | Maintain | Buy | 2025-11-13 |
| RBC Capital | Maintain | Sector Perform | 2025-11-13 |
| Morgan Stanley | Maintain | Overweight | 2025-10-15 |
| Truist Securities | Maintain | Buy | 2025-10-15 |
Textron Inc. Grades
This table presents recent grades from established financial institutions.
| Grading Company | Action | New Grade | Date |
|---|---|---|---|
| Jefferies | Maintain | Buy | 2026-02-02 |
| JP Morgan | Maintain | Neutral | 2026-01-29 |
| Citigroup | Maintain | Neutral | 2026-01-29 |
| UBS | Maintain | Neutral | 2026-01-15 |
| Citigroup | Maintain | Neutral | 2026-01-13 |
| JP Morgan | Maintain | Neutral | 2025-10-27 |
| TD Cowen | Maintain | Hold | 2025-10-24 |
| UBS | Maintain | Neutral | 2025-10-24 |
| Barclays | Maintain | Overweight | 2025-07-29 |
| UBS | Upgrade | Neutral | 2025-07-28 |
Which company has the best grades?
TransDigm Group Incorporated consistently receives Buy and Outperform ratings from multiple top firms. Textron Inc. mostly holds Neutral or Hold ratings. This suggests stronger institutional confidence in TransDigm, potentially influencing investor sentiment and market valuation.
Risks specific to each company
The following categories identify critical pressure points and systemic threats facing TransDigm Group Incorporated and Textron Inc. in the 2026 market environment:
1. Market & Competition
TransDigm Group Incorporated
- Dominates niche aerospace components with strong margins but faces high competition risks from large defense contractors.
Textron Inc.
- Broad aerospace and defense portfolio offers diversification but faces intense competition in commercial and military segments.
2. Capital Structure & Debt
TransDigm Group Incorporated
- High debt-to-assets ratio (131%) signals aggressive leverage, raising financial risk despite strong quick ratio.
Textron Inc.
- Conservative debt profile with 19.5% debt-to-assets and strong interest coverage indicates solid financial stability.
3. Stock Volatility
TransDigm Group Incorporated
- Beta below 1 (0.9) suggests lower volatility, yet high P/E ratio implies sensitivity to earnings disappointments.
Textron Inc.
- Beta near 1 (0.98) reflects market-aligned volatility; more reasonable valuation cushions against sharp swings.
4. Regulatory & Legal
TransDigm Group Incorporated
- Faces regulatory scrutiny typical for aerospace suppliers, with potential risks from export controls and defense contracts.
Textron Inc.
- Exposure to military and commercial aviation subjects it to complex regulatory environments and compliance costs.
5. Supply Chain & Operations
TransDigm Group Incorporated
- Specialized components require reliable suppliers; any disruption can severely impact production and delivery schedules.
Textron Inc.
- Diverse product lines and global operations increase supply chain complexity, heightening operational risk.
6. ESG & Climate Transition
TransDigm Group Incorporated
- Limited disclosure on ESG initiatives may pose reputational and regulatory risks as climate policies tighten.
Textron Inc.
- More diversified operations offer opportunities to invest in greener technologies, but transition costs remain.
7. Geopolitical Exposure
TransDigm Group Incorporated
- Significant U.S. military business concentrates geopolitical risk in defense spending and foreign policy shifts.
Textron Inc.
- Global footprint exposes Textron to currency fluctuations and geopolitical tensions affecting international sales.
Which company shows a better risk-adjusted profile?
TransDigm’s highest risk is its stretched balance sheet with a 131% debt-to-assets ratio, threatening financial flexibility. Textron faces competitive pressure but maintains healthier leverage and robust interest coverage. Textron’s moderate valuation and stronger financial ratios signal a better risk-adjusted profile. The recent surge in TransDigm’s dividend yield to 12.55% raises a red flag, indicating possible strained cash flow allocation under debt stress.
Final Verdict: Which stock to choose?
TransDigm Group Incorporated (TDG) excels as a cash-generating powerhouse with a very favorable economic moat, driven by superior capital efficiency and strong income growth. Its main point of vigilance remains a stretched balance sheet with elevated debt levels, suggesting it suits portfolios seeking aggressive growth with tolerance for leverage risk.
Textron Inc. (TXT) offers a strategic moat anchored in stable operations and improving profitability, supported by a healthier balance sheet and lower financial risk. It delivers modest but consistent returns, fitting well within Growth at a Reasonable Price (GARP) portfolios that prioritize stability alongside growth potential.
If you prioritize aggressive capital deployment and strong free cash flow, TDG outshines with its sustainable competitive advantage despite leverage concerns. However, if you seek better financial stability and a more balanced risk profile, TXT offers superior downside protection with steady growth, commanding a more moderate valuation premium.
Disclaimer: Investment carries a risk of loss of initial capital. The past performance is not a reliable indicator of future results. Be sure to understand risks before making an investment decision.
Go Further
I encourage you to read the complete analyses of TransDigm Group Incorporated and Textron Inc. to enhance your investment decisions: