Home > Comparison > Industrials > BA vs TXT
The strategic rivalry between The Boeing Company and Textron Inc. shapes the aerospace and defense sector’s evolution. Boeing operates as a capital-intensive industrial giant with diversified commercial and defense segments. Textron, while also industrial, combines aerospace manufacturing with industrial vehicles and finance services, offering a more diversified operational model. This analysis will assess which company’s trajectory delivers a superior risk-adjusted return, guiding portfolio allocation amid shifting sector dynamics.
Table of contents
Companies Overview
The Boeing Company and Textron Inc. stand as pivotal players in the aerospace and defense industry, shaping global markets through innovation and scale.
The Boeing Company: Aerospace & Defense Giant
The Boeing Company dominates aerospace and defense with a diversified portfolio spanning commercial jetliners, military aircraft, satellites, and space systems. Its core revenue engine relies on delivering complex aerospace products and services worldwide. In 2026, Boeing focuses on expanding its Global Services segment, enhancing digital solutions and fleet support to sustain competitive advantage in a capital-intensive industry.
Textron Inc.: Diversified Industrial Innovator
Textron Inc. operates across aircraft manufacturing, defense systems, and industrial products, emphasizing broad market reach from business jets to armored vehicles. Its revenue arises from multiple segments including Textron Aviation and Bell helicopters, supported by after-sales services and financing. In 2026, Textron prioritizes advanced unmanned systems and integrated defense solutions, balancing innovation with its industrial product lines.
Strategic Collision: Similarities & Divergences
Both companies leverage aerospace and defense expertise but diverge in scale and strategy. Boeing pursues a large-scale, integrated aerospace platform, while Textron emphasizes agility through diversified industrial and defense segments. Their primary battleground lies in military and commercial aviation markets, where innovation and service integration dictate market share. Boeing’s profile signals heavyweight industrial dominance, whereas Textron offers a nimble, multifaceted investment appeal.
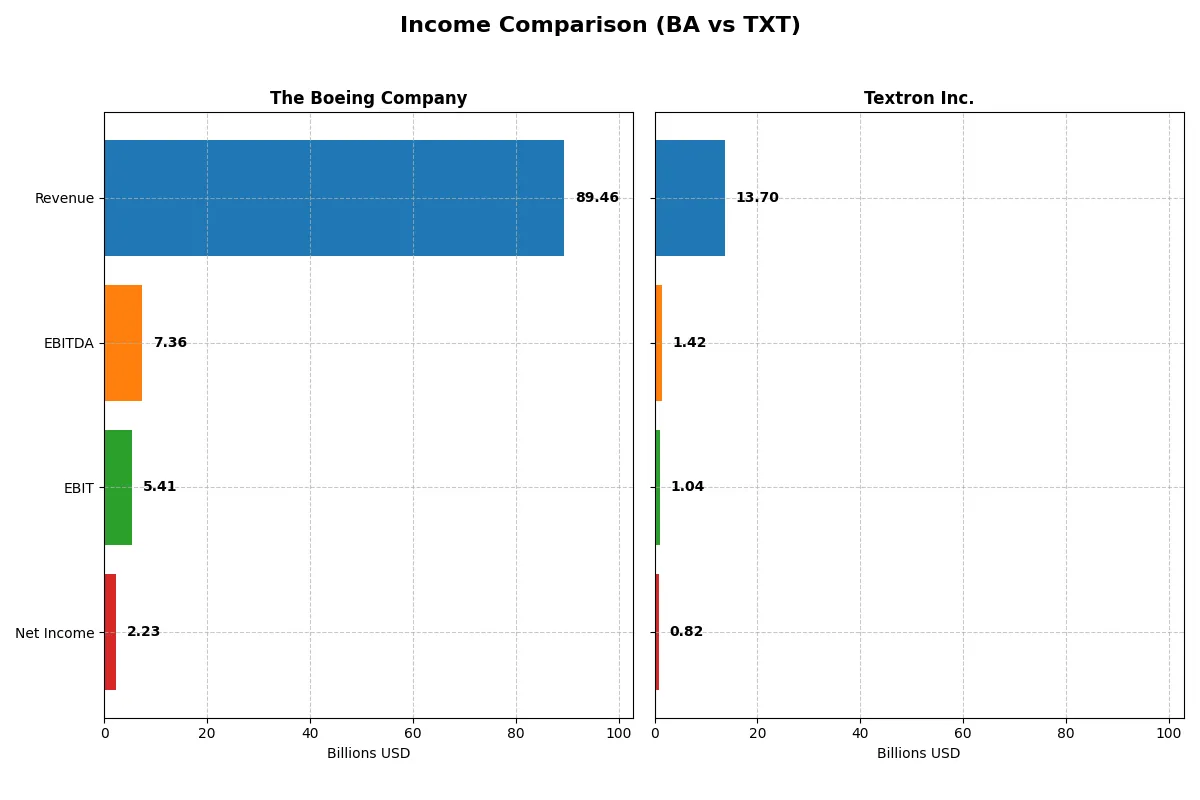
Income Statement Comparison
This data dissects the core profitability and scalability of both corporate engines to reveal who dominates the bottom line:
| Metric | The Boeing Company (BA) | Textron Inc. (TXT) |
|---|---|---|
| Revenue | 89.5B | 13.7B |
| Cost of Revenue | 85.2B | 11.2B |
| Operating Expenses | 9.7B | 1.6B |
| Gross Profit | 4.3B | 2.5B |
| EBITDA | 7.4B | 1.4B |
| EBIT | 5.4B | 1.0B |
| Interest Expense | 2.8B | 97M |
| Net Income | 2.2B | 824M |
| EPS | 2.49 | 5.11 |
| Fiscal Year | 2025 | 2025 |
Income Statement Analysis: The Bottom-Line Duel
This comparison reveals which company runs a more efficient and profitable business engine through their recent income statement performance.
The Boeing Company Analysis
Boeing’s revenue surged 34% in 2025 to $89.5B, reversing prior losses with net income hitting $2.24B. Gross margin improved to 4.8%, reflecting better cost control despite heavy operating expenses. The rebound from negative margins in 2024 signals regained momentum and operational efficiency after a challenging period.
Textron Inc. Analysis
Textron’s revenue remained flat at $13.7B in 2025, with net income steady at $824M. Its gross margin of 18.3% and net margin of 6.0% indicate consistent profitability and tighter expense management. However, lack of revenue growth contrasts with modest EPS gains, suggesting stable but limited expansion.
Margin Revival vs. Steady Profitability
Boeing’s sharp revenue and profit recovery outpaces Textron’s steady but stagnant top line. Boeing’s margin improvement amid scale gains marks a fundamental turnaround. Textron offers reliable profits without growth acceleration. Investors seeking dynamic recovery may favor Boeing, while cautious profiles may lean toward Textron’s consistency.
Financial Ratios Comparison
These vital ratios act as a diagnostic tool to expose the underlying fiscal health, valuation premiums, and capital efficiency of the companies compared below:
| Ratios | The Boeing Company (BA) | Textron Inc. (TXT) |
|---|---|---|
| ROE | 41.0% | 10.5% |
| ROIC | -6.7% | 6.9% |
| P/E | 74.1 | 19.0 |
| P/B | 30.3 | 2.0 |
| Current Ratio | 1.27 | 5.94 |
| Quick Ratio | 0.49 | 2.33 |
| D/E (Debt to Equity) | 9.92 | 0.45 |
| Debt-to-Assets | 32.2% | 19.5% |
| Interest Coverage | -1.95 | 8.81 |
| Asset Turnover | 0.53 | 0.76 |
| Fixed Asset Turnover | 5.73 | 5.29 |
| Payout ratio | 14.8% | 2.3% |
| Dividend yield | 0.20% | 0.12% |
| Fiscal Year | 2025 | 2025 |
Efficiency & Valuation Duel: The Vital Signs
Ratios act as a company’s DNA, revealing hidden risks and operational excellence behind headline financials.
The Boeing Company
Boeing displays a strong return on equity at 41%, signaling high shareholder profitability despite a weak net margin of 2.5%. The valuation looks stretched with a P/E of 74 and a P/B of 30, indicating expensive stock pricing. Dividend yield is minimal at 0.2%, reflecting limited cash returned to shareholders amid reinvestment challenges.
Textron Inc.
Textron shows moderate returns with a 10.5% ROE and a healthier net margin of 6%. The valuation is reasonable, with a P/E of 19 and P/B near 2, suggesting fair pricing. It balances shareholder returns with a focus on steady cash flow and controlled leverage, though dividend yield remains low at 0.12%.
Premium Valuation vs. Operational Safety
Boeing’s high ROE contrasts with stretched valuation and weak free cash flow, raising risk concerns. Textron offers a more balanced profile with moderate profitability and a favorable capital structure. Investors prioritizing operational stability may find Textron’s metrics more aligned with prudent risk management.
Which one offers the Superior Shareholder Reward?
I see The Boeing Company (BA) offers a near-zero dividend yield of 0.2% with a modest payout ratio of 14.8%, but it posts negative free cash flow (-$2.5/share) in 2025. Its buyback activity appears limited given cash constraints and heavy debt (debt-to-equity near 10x). Textron Inc. (TXT) yields a small 0.12% dividend with a low payout ratio (~2%), backed by robust free cash flow of $4.9/share and strong operating margins (~7.6%). TXT also maintains a steady buyback program, supported by a clean balance sheet (debt-to-equity 0.45). TXT’s distribution model is far more sustainable, balancing modest dividends and buybacks funded by reliable cash flow. I judge Textron delivers the superior total shareholder reward in 2026.
Comparative Score Analysis: The Strategic Profile
The radar chart reveals the fundamental DNA and trade-offs of The Boeing Company and Textron Inc., highlighting their core financial strengths and vulnerabilities:
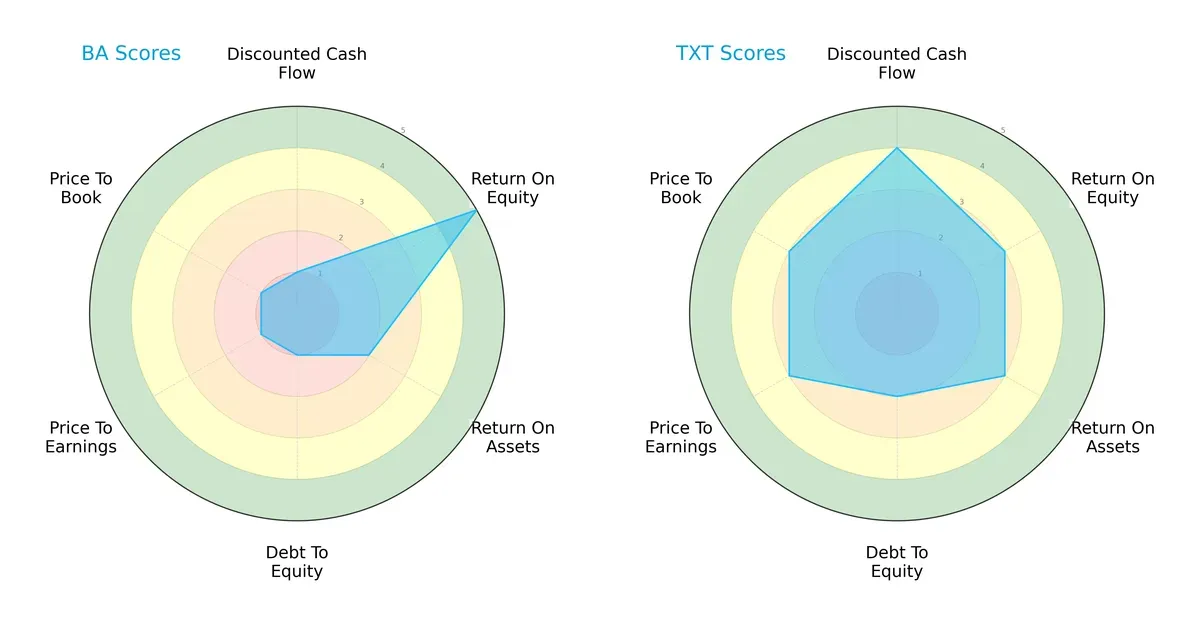
Textron exhibits a more balanced financial profile with solid DCF (4), ROE (3), ROA (3), and moderate leverage and valuation scores. Boeing leans heavily on its ROE (5) but suffers from weak DCF (1), high leverage (1), and poor valuation metrics (P/E and P/B both 1). Boeing’s profile depends on profitability efficiency, while Textron offers steadier overall financial health.
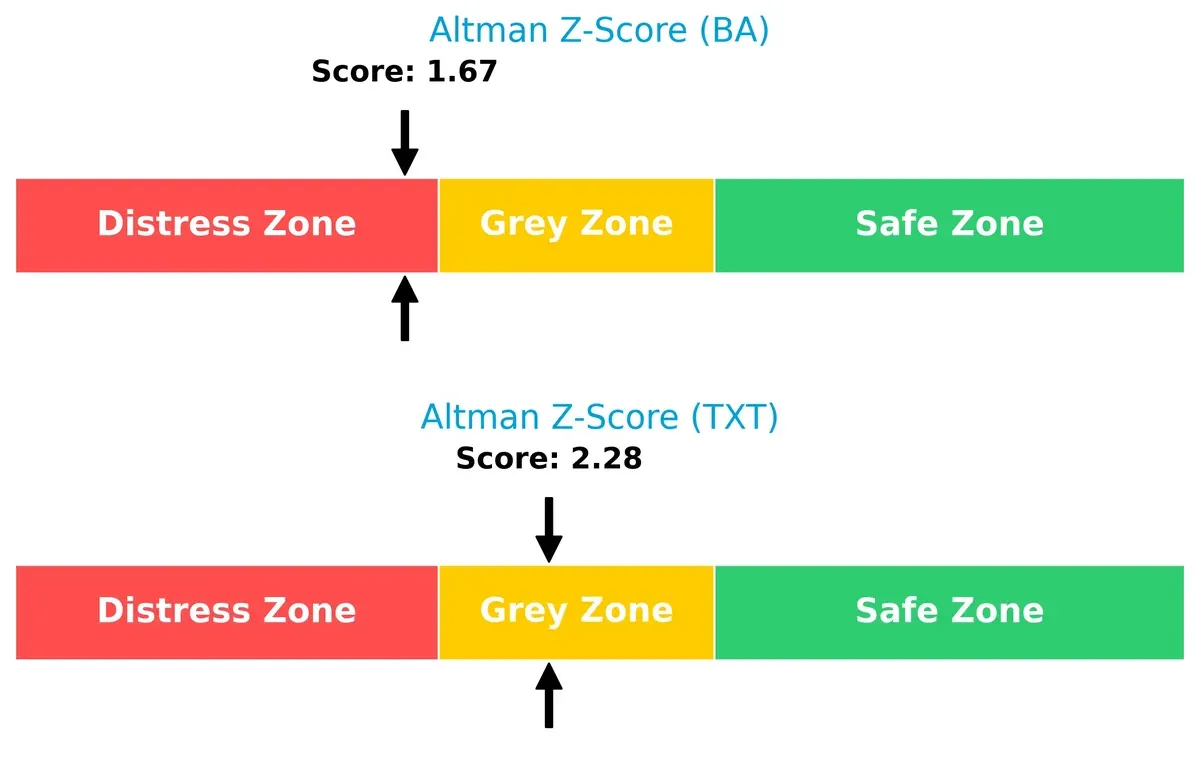
Bankruptcy Risk: Solvency Showdown
Textron’s Altman Z-Score at 2.28 places it in the grey zone, suggesting moderate bankruptcy risk. Boeing’s lower score of 1.67 signals distress and heightened long-term survival concerns in this cycle:
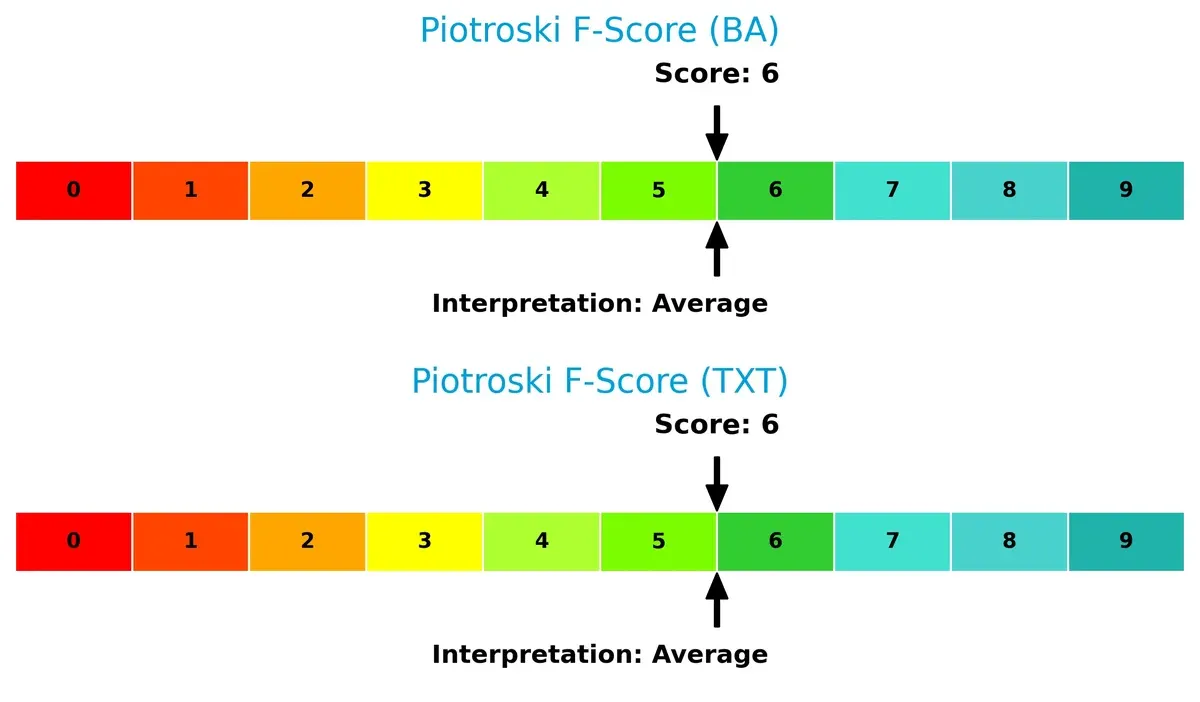
Financial Health: Quality of Operations
Both Boeing and Textron score a 6 on the Piotroski F-Score, indicating average financial health. Neither firm shows immediate red flags, but neither demonstrates peak operational strength either:
How are the two companies positioned?
This section dissects the operational DNA of Boeing and Textron by comparing their revenue distribution and internal dynamics. The goal is to confront their economic moats to identify which model offers the most resilient competitive advantage today.
Revenue Segmentation: The Strategic Mix
This visual comparison dissects how The Boeing Company and Textron Inc. diversify their income streams and highlights their primary sector bets:
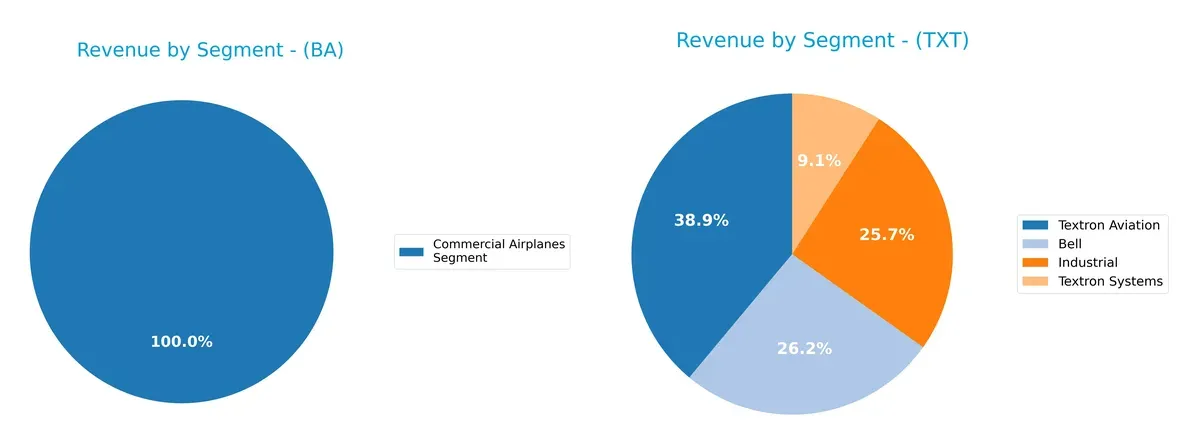
Boeing’s revenue pivots heavily on its Commercial Airplanes segment, which dwarfs other streams with $41.5B in 2025. Textron displays a balanced portfolio with Aviation ($5.3B), Bell ($3.6B), Industrial ($3.5B), and Systems ($1.2B) segments contributing evenly. Boeing’s concentration signals infrastructure dominance but elevates sector-specific risk. Textron’s mix reduces vulnerability, leveraging diversified industrial and aerospace footholds.
Strengths and Weaknesses Comparison
This table compares the Strengths and Weaknesses of The Boeing Company and Textron Inc.:
BA Strengths
- Diverse segments including Commercial Airplanes, Defense, and Global Services
- Strong US and broad global revenue base
- High ROE at 40.98%
- Favorable fixed asset turnover at 5.73
TXT Strengths
- Balanced revenue across Bell, Industrial, Aviation, and Systems
- Favorable WACC at 7.56% supports capital efficiency
- Strong liquidity metrics with quick ratio 2.33
- Low debt-to-equity at 0.45 indicates financial prudence
BA Weaknesses
- Negative ROIC at -6.71% signals capital inefficiency
- High P/E at 74.05 and P/B at 30.35 reflect overvaluation concerns
- Weak quick ratio at 0.49 and interest coverage at 1.95
- High debt-to-equity ratio of 9.92 raises leverage risks
TXT Weaknesses
- Unfavorable current ratio of 5.94 suggests excess current liabilities or asset management issues
- Relatively low ROE at 10.46% and net margin neutral at 6.01%
- Dividend yield low at 0.12% might deter income-focused investors
Both companies show diversified business models and global footprints. Boeing’s profitability metrics reveal challenges in capital efficiency and valuation, while Textron displays strong liquidity and conservative leverage but moderate profitability. These contrasts highlight distinct strategic priorities and financial health profiles.
The Moat Duel: Analyzing Competitive Defensibility
A structural moat protects long-term profits from relentless competition erosion. Without it, market share and margins erode quickly:
The Boeing Company: Complex Engineering & Scale Advantage
Boeing’s moat stems from its massive scale and deep engineering expertise, reflected in stable margins and improving revenue growth. New aerospace innovations in 2026 could either reinforce or strain this advantage.
Textron Inc.: Diversified Product Portfolio & Innovation Edge
Textron leverages a broad product mix and nimble innovation, contrasting Boeing’s scale. Its growing ROIC trend shows strengthening efficiency, with expansion in unmanned systems poised to disrupt markets further.
Scale Dominance vs. Diversification Agility
Boeing’s scale offers a wider moat but faltering ROIC signals risk. Textron’s improving profitability suggests a deeper moat in capital efficiency. I see Textron better positioned to defend market share amid evolving aerospace demands.
Which stock offers better returns?
Over the past 12 months, Boeing’s stock price surged 17.75%, showing clear acceleration and strong buyer dominance, while Textron’s shares declined 4.42% despite recent gains.
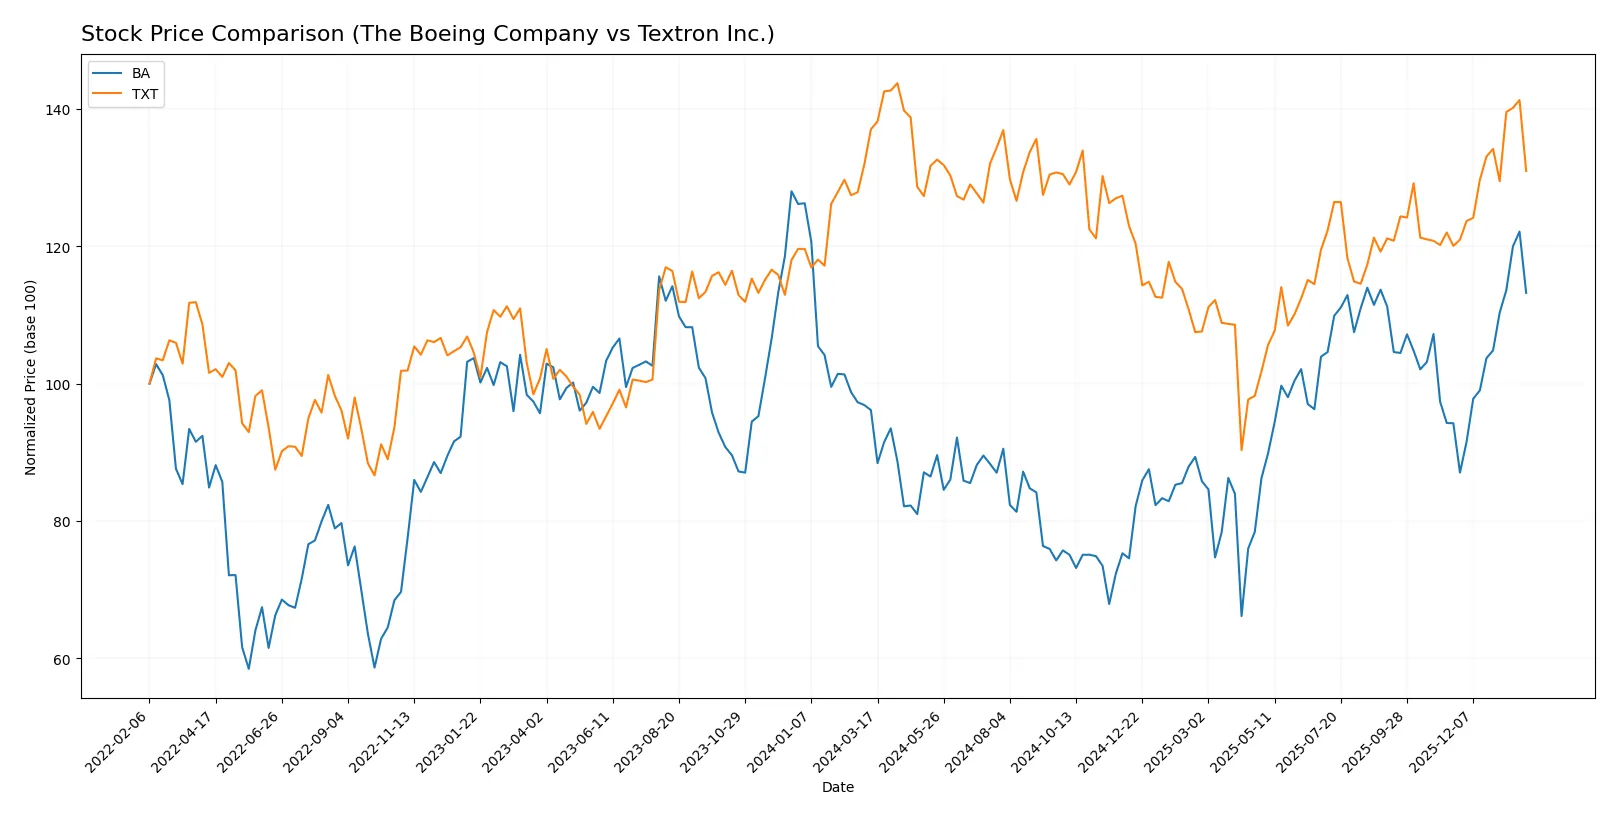
Trend Comparison
Boeing’s stock rose 17.75% over the past year, reflecting a bullish trend with accelerating momentum and a wide volatility range of 26.41 in standard deviation.
Textron’s stock fell 4.42% over the same period, marking a bearish trend despite positive recent momentum and lower volatility at 7.24 standard deviation.
Comparing both, Boeing delivered superior market performance with a sustained bullish trend, while Textron lagged, experiencing an overall bearish trajectory.
Target Prices
Analysts present a moderate to bullish consensus on both Boeing and Textron shares.
| Company | Target Low | Target High | Consensus |
|---|---|---|---|
| The Boeing Company | 150 | 298 | 256.73 |
| Textron Inc. | 92 | 115 | 102 |
Boeing’s consensus target of $257 exceeds its current $234 price, signaling upside potential. Textron’s $102 target also surpasses its $88 market price, suggesting modest growth expectations.

Don’t Let Luck Decide Your Entry Point
Optimize your entry points with our advanced ProRealTime indicators. You’ll get efficient buy signals with precise price targets for maximum performance. Start outperforming now!
How do institutions grade them?
The Boeing Company Grades
The table below summarizes recent institution grades for The Boeing Company.
| Grading Company | Action | New Grade | Date |
|---|---|---|---|
| Citigroup | Maintain | Buy | 2026-01-28 |
| UBS | Maintain | Buy | 2026-01-28 |
| RBC Capital | Maintain | Outperform | 2026-01-28 |
| JP Morgan | Maintain | Overweight | 2026-01-28 |
| Bernstein | Maintain | Outperform | 2026-01-15 |
| Citigroup | Maintain | Buy | 2026-01-13 |
| JP Morgan | Maintain | Overweight | 2025-12-19 |
| Susquehanna | Maintain | Positive | 2025-11-12 |
| Freedom Capital Markets | Upgrade | Buy | 2025-11-03 |
| JP Morgan | Maintain | Overweight | 2025-10-30 |
Textron Inc. Grades
Below are the recent institutional grades for Textron Inc.
| Grading Company | Action | New Grade | Date |
|---|---|---|---|
| JP Morgan | Maintain | Neutral | 2026-01-29 |
| Citigroup | Maintain | Neutral | 2026-01-29 |
| UBS | Maintain | Neutral | 2026-01-15 |
| Citigroup | Maintain | Neutral | 2026-01-13 |
| JP Morgan | Maintain | Neutral | 2025-10-27 |
| TD Cowen | Maintain | Hold | 2025-10-24 |
| UBS | Maintain | Neutral | 2025-10-24 |
| Barclays | Maintain | Overweight | 2025-07-29 |
| UBS | Upgrade | Neutral | 2025-07-28 |
| Susquehanna | Maintain | Positive | 2025-07-25 |
Which company has the best grades?
The Boeing Company consistently earns Buy, Outperform, and Overweight ratings, reflecting stronger institutional confidence. Textron’s grades mainly range from Neutral to Hold, indicating more cautious sentiment. Investors may interpret Boeing’s higher grades as signals of greater growth or stability potential.
Risks specific to each company
The following categories identify the critical pressure points and systemic threats facing both firms in the 2026 market environment:
1. Market & Competition
The Boeing Company
- Faces intense competition in commercial and defense aerospace, challenged by supply chain delays and market demand shifts.
Textron Inc.
- Competes in niche aerospace and defense segments with diversified industrial products, benefiting from less direct competition.
2. Capital Structure & Debt
The Boeing Company
- High debt-to-equity ratio (9.92) and weak interest coverage (1.95) raise financial risk concerns.
Textron Inc.
- Maintains low debt-to-equity (0.45) and strong interest coverage (10.72), supporting financial stability.
3. Stock Volatility
The Boeing Company
- Beta of 1.16 indicates above-market volatility, reflecting sensitivity to aerospace sector cycles.
Textron Inc.
- Beta near 1.00 suggests market-level volatility, providing relatively stable stock behavior.
4. Regulatory & Legal
The Boeing Company
- Faces stringent aerospace regulations and ongoing scrutiny post-737 MAX issues, increasing compliance costs and risks.
Textron Inc.
- Subject to defense contracting regulations but with fewer recent high-profile legal challenges.
5. Supply Chain & Operations
The Boeing Company
- Complex global supply chains remain vulnerable to disruption, affecting production schedules and costs.
Textron Inc.
- More diversified operations mitigate risks, though aerospace segments face similar supply vulnerabilities.
6. ESG & Climate Transition
The Boeing Company
- Pressure to reduce emissions in commercial jets and comply with evolving environmental standards.
Textron Inc.
- Faces challenges in industrial plastics and vehicle emissions but benefits from diversified ESG initiatives.
7. Geopolitical Exposure
The Boeing Company
- Global defense and commercial contracts expose Boeing to geopolitical tensions and export controls.
Textron Inc.
- International defense and aviation sales also sensitive, yet smaller scale limits exposure magnitude.
Which company shows a better risk-adjusted profile?
The Boeing Company’s greatest risk lies in its leveraged capital structure and operational complexity, threatening financial flexibility. Textron’s primary risk is its high current ratio, indicating possible inefficiencies in asset management. Overall, Textron presents a superior risk-adjusted profile, supported by stronger debt metrics and stable stock volatility. Boeing’s Altman Z-Score in the distress zone (1.67) contrasts with Textron’s healthier grey zone (2.28), underscoring my concern about Boeing’s financial fragility despite its market dominance.
Final Verdict: Which stock to choose?
The Boeing Company excels as a powerhouse in aerospace with a clear strength in operational scale and a bullish price momentum. However, its declining capital efficiency and heavy debt load are points of vigilance. It suits portfolios targeting aggressive growth with tolerance for volatility and cyclical risks.
Textron Inc. offers a strategic moat through diversified industrial operations and solid capital returns trending upward. It presents a safer balance sheet and more consistent profitability than Boeing. This makes Textron appealing for investors seeking Growth at a Reasonable Price (GARP) with a preference for stability.
If you prioritize bold growth and can weather financial leverage, Boeing outshines with its scale and market position despite efficiency challenges. However, if you seek steadier returns and better financial health, Textron offers better stability and a more favorable risk profile. Each fits distinct investor avatars balancing growth and prudence.
Disclaimer: Investment carries a risk of loss of initial capital. The past performance is not a reliable indicator of future results. Be sure to understand risks before making an investment decision.
Go Further
I encourage you to read the complete analyses of The Boeing Company and Textron Inc. to enhance your investment decisions: