Home > Comparison > Technology > TXN vs TSEM
The strategic rivalry between Texas Instruments Incorporated and Tower Semiconductor Ltd. shapes the semiconductor industry’s evolution. Texas Instruments operates as a diversified analog and embedded processing powerhouse, while Tower Semiconductor focuses on specialized analog mixed-signal foundry services. This clash pits a large-scale integrated manufacturer against a nimble contract producer. I analyze which company’s operational model and market positioning deliver the superior risk-adjusted return for a balanced portfolio seeking exposure to technology innovation.
Table of contents
Companies Overview
Texas Instruments and Tower Semiconductor both hold significant positions in the semiconductor industry, shaping global electronics markets.
Texas Instruments Incorporated: Analog and Embedded Processing Powerhouse
Texas Instruments dominates as a leading semiconductor designer and manufacturer, focusing on analog and embedded processing segments. Its revenue primarily stems from power management and signal chain products that serve industrial, automotive, and consumer markets. In 2026, Texas Instruments emphasizes innovation in power efficiency and expanding its embedded microcontroller offerings to capture broad-based electronics demand.
Tower Semiconductor Ltd.: Specialized Foundry Innovator
Tower Semiconductor operates as an independent semiconductor foundry specializing in customizable analog mixed-signal processes including SiGe, BiCMOS, and RF CMOS technologies. It generates revenue by providing wafer fabrication and design enablement services to fabless companies and integrated device manufacturers. The company’s 2026 strategy centers on enhancing process technologies and expanding capacity to serve automotive, aerospace, and medical sectors.
Strategic Collision: Similarities & Divergences
Texas Instruments pursues a vertically integrated model focusing on product innovation and direct sales, while Tower Semiconductor adopts a foundry service model emphasizing process customization and partner collaboration. They compete primarily in analog and mixed-signal semiconductor domains, targeting overlapping industrial and automotive markets. Their investment profiles differ sharply: Texas Instruments offers scale and diversification, whereas Tower Semiconductor presents specialized technology exposure with growth potential.
Income Statement Comparison
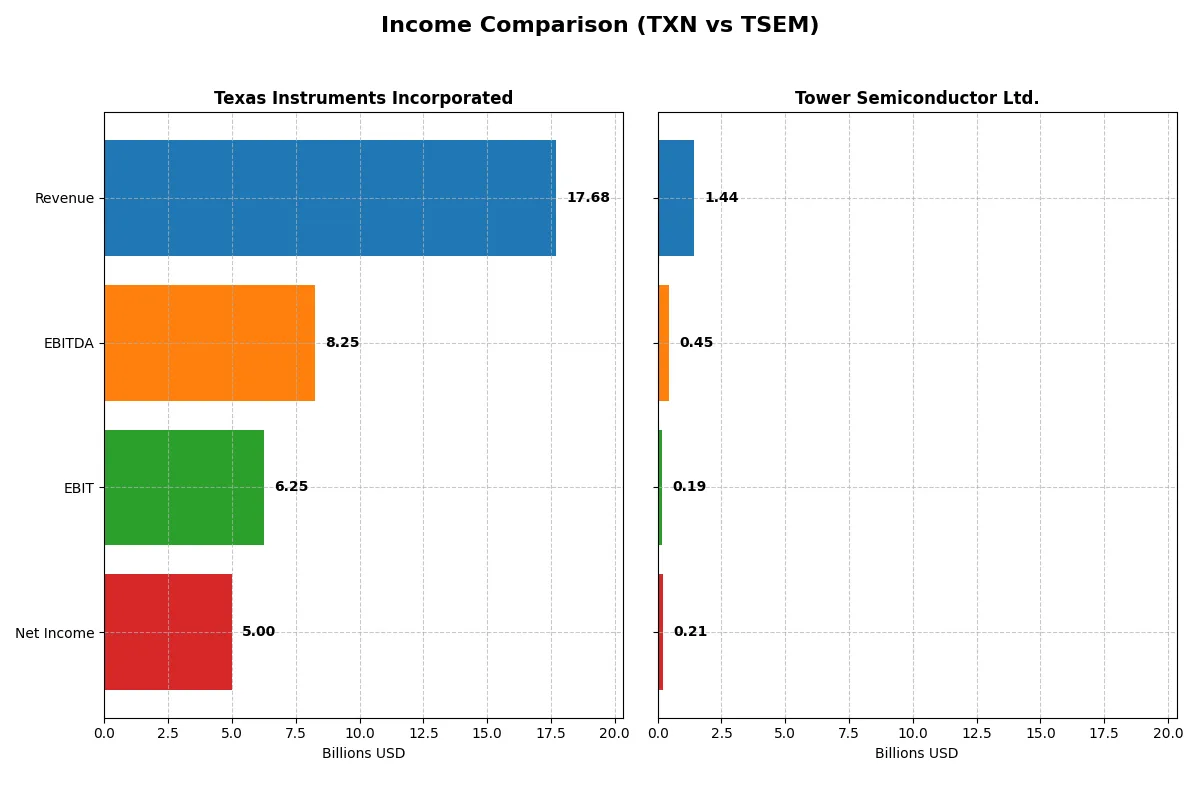
This data dissects the core profitability and scalability of both corporate engines to reveal who dominates the bottom line:
| Metric | Texas Instruments Incorporated (TXN) | Tower Semiconductor Ltd. (TSEM) |
|---|---|---|
| Revenue | 17.7B | 1.44B |
| Cost of Revenue | 7.60B | 1.10B |
| Operating Expenses | 4.06B | 148M |
| Gross Profit | 10.1B | 339M |
| EBITDA | 8.25B | 451M |
| EBIT | 6.25B | 185M |
| Interest Expense | 543M | 6M |
| Net Income | 5.00B | 208M |
| EPS | 5.45 | 1.87 |
| Fiscal Year | 2025 | 2024 |
Income Statement Analysis: The Bottom-Line Duel
This income statement comparison reveals the true efficiency and profitability of Texas Instruments and Tower Semiconductor’s corporate engines.
Texas Instruments Incorporated Analysis
Texas Instruments shows a revenue rebound to $17.7B in 2025 after a dip in 2024, with net income stabilizing near $5B. Its gross margin remains strong at 57%, and net margin holds a healthy 28%, signaling robust cost control. However, net margin declined slightly year-over-year, suggesting pressure on profitability despite solid revenue growth.
Tower Semiconductor Ltd. Analysis
Tower Semiconductor’s revenue plateaued around $1.44B in 2024, showing minimal growth. Net income halved year-over-year to $208M, dragging net margin down to 14.5%. Gross margin at 24% and EBIT margin at 12.9% reflect tighter profitability. The sharp decline in earnings and margins points to operational challenges despite positive long-term growth trends.
Verdict: Margin Strength vs. Earnings Volatility
Texas Instruments clearly leads in scale and margin efficiency, with superior profitability metrics and revenue momentum. Tower Semiconductor, though smaller, has demonstrated impressive long-term growth but currently suffers from margin compression and earnings volatility. For investors prioritizing stable, high-margin returns, Texas Instruments offers a more attractive profile amid evolving market cycles.
Financial Ratios Comparison
These vital ratios act as a diagnostic tool to expose the underlying fiscal health, valuation premiums, and capital efficiency of the companies compared below:
| Ratios | Texas Instruments (TXN) | Tower Semiconductor (TSEM) |
|---|---|---|
| ROE | 30.7% | 7.8% |
| ROIC | 16.5% | 6.4% |
| P/E | 31.5 | 27.5 |
| P/B | 9.7 | 2.2 |
| Current Ratio | 4.35 | 6.18 |
| Quick Ratio | 2.83 | 5.23 |
| D/E | 0.86 | 0.07 |
| Debt-to-Assets | 40.6% | 5.9% |
| Interest Coverage | 11.1 | 32.6 |
| Asset Turnover | 0.51 | 0.47 |
| Fixed Asset Turnover | 1.44 | 1.11 |
| Payout Ratio | 100% | 0% |
| Dividend Yield | 3.17% | 0% |
| Fiscal Year | 2025 | 2024 |
Efficiency & Valuation Duel: The Vital Signs
Financial ratios act as a company’s DNA, unveiling hidden risks and operational excellence critical for informed investing decisions.
Texas Instruments Incorporated
Texas Instruments shows robust profitability with a 30.7% ROE and a strong 28.3% net margin, signaling operational efficiency. However, its valuation appears stretched, with a high P/E of 31.5 and P/B of 9.7. The stock offers a 3.17% dividend yield, reflecting solid shareholder returns alongside consistent reinvestment in R&D.
Tower Semiconductor Ltd.
Tower Semiconductor posts a modest 7.8% ROE and a 14.5% net margin, indicating moderate profitability but less operational efficiency. Its P/E of 27.5 is relatively high given the returns. The company pays no dividend, focusing on growth through R&D and maintaining a strong balance sheet with minimal debt.
Premium Valuation vs. Operational Safety
Texas Instruments commands a premium valuation but delivers superior profitability and shareholder returns. Tower Semiconductor is less profitable and more conservatively valued, emphasizing growth over payouts. Investors seeking strong income and efficiency may prefer Texas Instruments, while those prioritizing growth and low debt might lean toward Tower Semiconductor.
Which one offers the Superior Shareholder Reward?
I see Texas Instruments (TXN) delivers a balanced distribution with a 3.17% dividend yield and a near-100% payout ratio, fully covered by free cash flow (2.86/share). TXN also runs steady buybacks, reinforcing shareholder value. Conversely, Tower Semiconductor (TSEM) pays no dividend, focusing on reinvestment with minimal free cash flow (0.11/share) and sporadic buybacks. TXN’s model is more sustainable, blending cash returns and buybacks, while TSEM’s growth strategy carries higher execution risks. In 2026, I judge TXN offers the superior total return profile for long-term investors.
Comparative Score Analysis: The Strategic Profile
The radar chart reveals the fundamental DNA and trade-offs of Texas Instruments Incorporated and Tower Semiconductor Ltd., highlighting their strategic financial strengths and weaknesses:

Texas Instruments excels in profitability with top-tier ROE and ROA scores (5 each), but its financial leverage is a red flag, scoring very low (1) on debt-to-equity. Tower Semiconductor shows a more balanced leverage profile (score 4) and decent asset efficiency (ROA 4), yet it lacks Texas Instruments’ profitability edge (ROE 3). Valuation metrics suggest Texas Instruments trades at a premium (low P/E and P/B scores), whereas Tower Semiconductor’s valuation appears more moderate. Overall, Texas Instruments relies heavily on operational efficiency, while Tower Semiconductor offers a steadier financial structure.
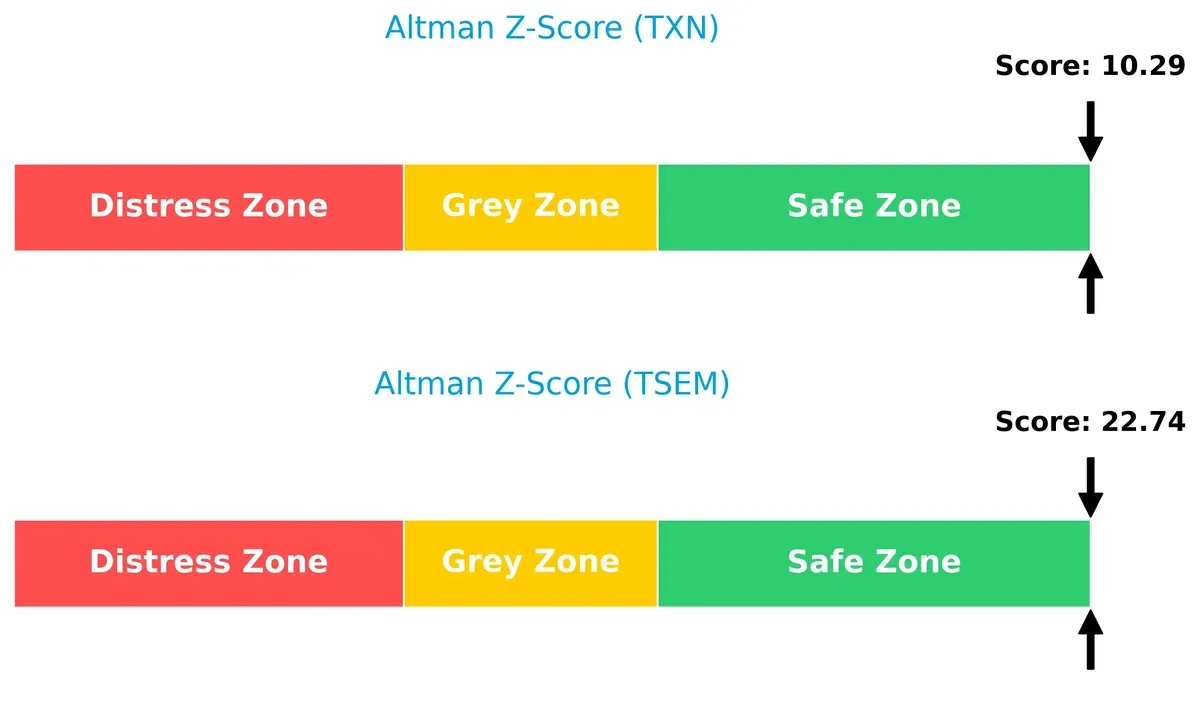
Bankruptcy Risk: Solvency Showdown
Texas Instruments and Tower Semiconductor both reside safely above bankruptcy risk thresholds. Tower Semiconductor’s Altman Z-Score of 22.7 far surpasses Texas Instruments’ 10.3, implying a stronger cushion against economic downturns:
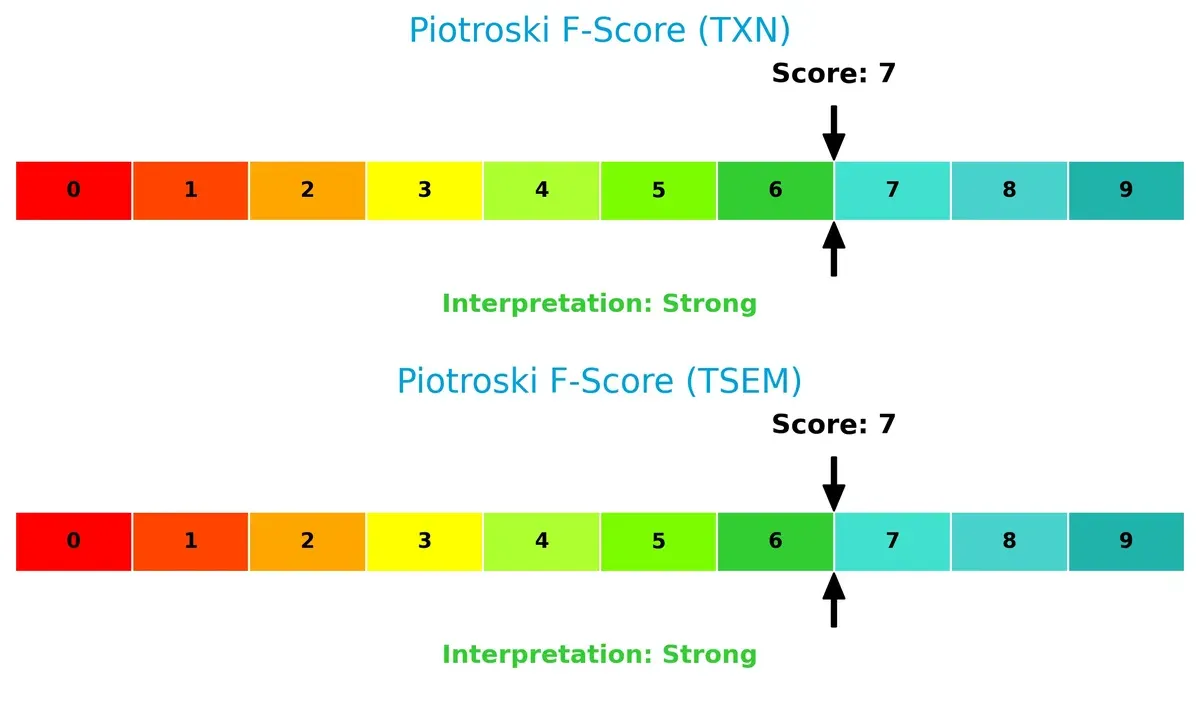
Financial Health: Quality of Operations
Both firms share a strong Piotroski F-Score of 7, indicating solid financial health and operational quality. Neither company reveals immediate red flags in internal metrics, reflecting robust profitability, liquidity, and efficiency:
How are the two companies positioned?
This section dissects the operational DNA of Texas Instruments and Tower Semiconductor by comparing their revenue distribution and internal dynamics. The goal is to confront their economic moats and identify which model offers the most resilient competitive advantage today.
Revenue Segmentation: The Strategic Mix
The following visual comparison dissects how Texas Instruments Incorporated and Tower Semiconductor Ltd. diversify their income streams, revealing their primary sector bets and strategic focus:
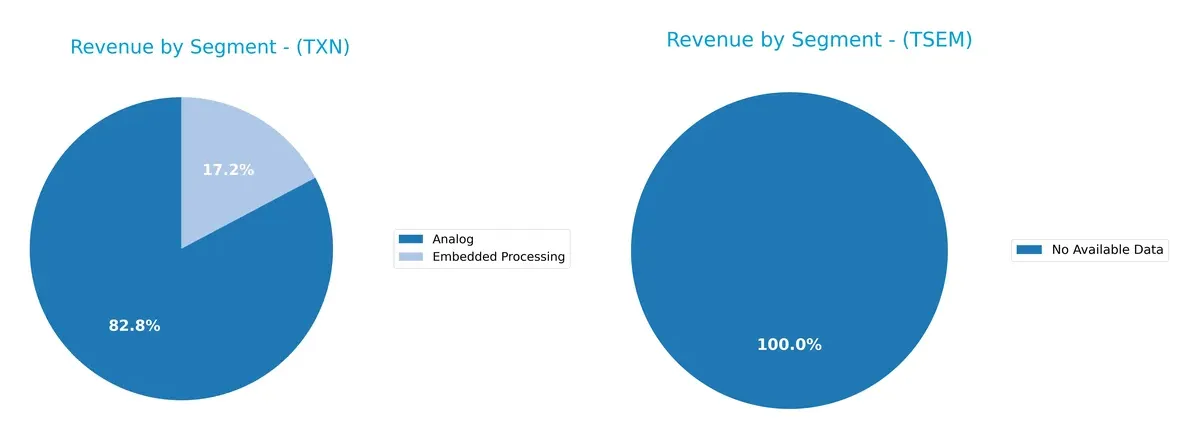
Texas Instruments anchors its revenue in Analog, generating $12.2B in 2024, dwarfing its Embedded Processing at $2.5B. This concentration signals a strong ecosystem lock-in around Analog technology. Tower Semiconductor lacks available data, preventing segmentation comparison. Texas Instruments’ reliance on Analog implies infrastructure dominance but also concentration risk if market shifts occur. Its secondary segments add modest diversification, stabilizing revenue without diluting core expertise.
Strengths and Weaknesses Comparison
This table compares the Strengths and Weaknesses of Texas Instruments Incorporated and Tower Semiconductor Ltd.:
Texas Instruments Incorporated Strengths
- High net margin of 28.28% demonstrates strong profitability
- Robust ROE at 30.73% signals efficient capital use
- Favorable quick ratio of 2.83 supports liquidity
- Diverse revenue streams across Analog and Embedded Processing
- Significant global presence including US, China, and EMEA
- Solid dividend yield at 3.17%
Tower Semiconductor Ltd. Strengths
- Favorable net margin of 14.47% shows profitability
- WACC lower than TXN at 7.98% suggests cheaper capital costs
- Very low debt-to-equity at 0.07 reduces financial risk
- Excellent interest coverage of 31.57 indicates strong debt servicing
- Favorable quick ratio of 5.23 supports liquidity
- Low leverage with 5.87% debt to assets
Texas Instruments Incorporated Weaknesses
- High PE ratio at 31.53 may imply overvaluation risk
- Elevated PB ratio of 9.69 suggests expensive equity
- Unfavorable current ratio of 4.35 could indicate working capital issues
- Moderate debt-to-assets at 40.62% increases leverage risk
- Asset turnover at 0.51 signals moderate asset efficiency
- Some revenue concentration in Analog segment
Tower Semiconductor Ltd. Weaknesses
- Lower ROE at 7.83% reflects weaker profitability
- Unfavorable current ratio of 6.18 raises liquidity concerns
- Asset turnover at 0.47 is below TXN, indicating lower efficiency
- Unfavorable PE of 27.54 may reflect market pricing concerns
- Zero dividend yield implies no income return to shareholders
- Less diversified revenue data limits visibility on market share
Overall, Texas Instruments exhibits strong profitability and global diversification but faces valuation and liquidity questions. Tower Semiconductor shows financial prudence with low leverage and solid coverage ratios but struggles with lower profitability and less clear market diversification. These factors shape each company’s strategic priorities around capital efficiency and market expansion.
The Moat Duel: Analyzing Competitive Defensibility
A structural moat shields long-term profits from competitive erosion. Without it, gains vanish under relentless market pressure:
Texas Instruments Incorporated: Durable Cost Advantage
Texas Instruments leverages scale and manufacturing efficiency, sustaining a high ROIC of 8.3% above WACC. Its stable analog and embedded processing segments underpin margin resilience in 2026. However, declining ROIC signals caution as competition intensifies.
Tower Semiconductor Ltd.: Emerging Niche Innovator
Tower Semiconductor’s moat stems from specialized process technologies and customization. Unlike Texas Instruments, it currently generates negative economic profits but shows improving ROIC trends. Expansion into new mixed-signal applications could deepen its competitive footing in 2026.
Scale Efficiency vs. Technological Specialization
Texas Instruments holds a wider moat with its strong value creation despite shrinking profitability. Tower Semiconductor’s growing ROIC hints at future promise but remains a value destroyer today. Texas Instruments is better positioned to defend market share long term.
Which stock offers better returns?
The past year reveals sharp price increases for both Texas Instruments and Tower Semiconductor, with distinct acceleration and strong buyer dominance shaping their trading dynamics.
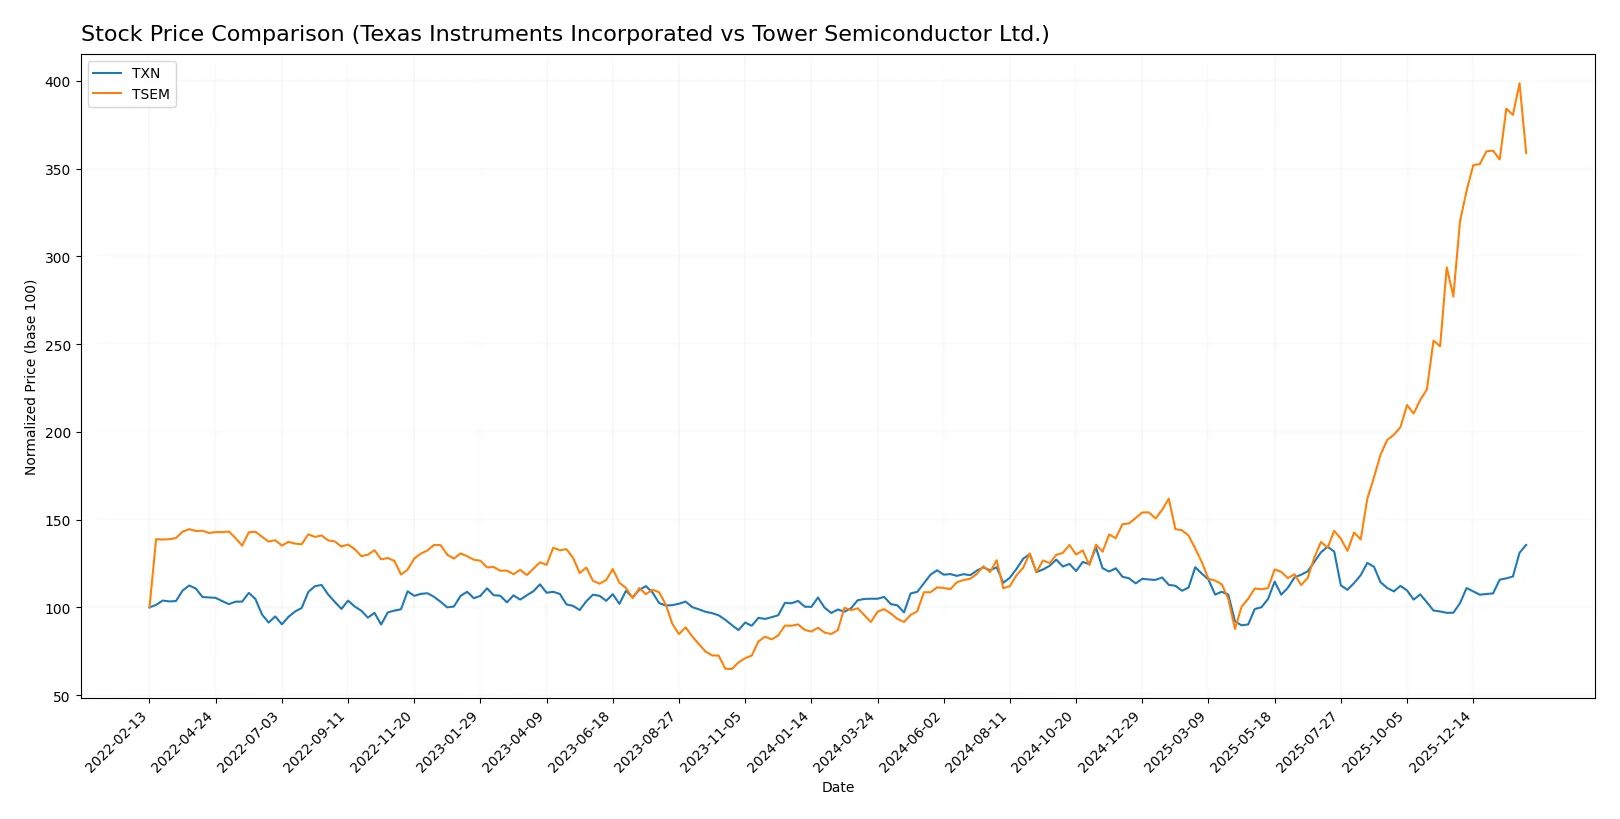
Trend Comparison
Texas Instruments’ stock rose 29.21% over the past 12 months, showing a bullish trend with accelerating momentum and a high volatility level of 16.23%. The price ranged between 147.6 and 222.92.
Tower Semiconductor’s stock surged 291.48% over the same period, marking a strong bullish trend with acceleration. Volatility was higher at 26.92%, with prices moving from 29.65 to 134.73.
Tower Semiconductor outpaced Texas Instruments in market performance, delivering significantly higher returns and stronger price acceleration over the past year.
Target Prices
Analysts present a mixed but generally optimistic target consensus for Texas Instruments and Tower Semiconductor.
| Company | Target Low | Target High | Consensus |
|---|---|---|---|
| Texas Instruments Incorporated | 160 | 260 | 204.64 |
| Tower Semiconductor Ltd. | 66 | 125 | 96 |
Texas Instruments’ target consensus at 204.64 sits below its current price of 222.92, signaling cautious optimism. Tower Semiconductor’s consensus target of 96 is well below its 121.28 price, indicating expected downside or market correction.

Don’t Let Luck Decide Your Entry Point
Optimize your entry points with our advanced ProRealTime indicators. You’ll get efficient buy signals with precise price targets for maximum performance. Start outperforming now!
How do institutions grade them?
Here is a summary of recent institutional grades for Texas Instruments Incorporated and Tower Semiconductor Ltd.:
Texas Instruments Incorporated Grades
The table below lists institutional grades for Texas Instruments Incorporated as of January 2026.
| Grading Company | Action | New Grade | Date |
|---|---|---|---|
| Jefferies | Maintain | Hold | 2026-01-28 |
| Cantor Fitzgerald | Maintain | Neutral | 2026-01-28 |
| Goldman Sachs | Maintain | Sell | 2026-01-28 |
| Truist Securities | Maintain | Hold | 2026-01-28 |
| Deutsche Bank | Maintain | Hold | 2026-01-28 |
| Stifel | Maintain | Hold | 2026-01-28 |
| UBS | Maintain | Buy | 2026-01-28 |
| B of A Securities | Upgrade | Neutral | 2026-01-28 |
| Wells Fargo | Maintain | Equal Weight | 2026-01-28 |
| JP Morgan | Maintain | Overweight | 2026-01-28 |
Tower Semiconductor Ltd. Grades
The table below shows institutional grades assigned to Tower Semiconductor Ltd. in late 2025 and early 2026.
| Grading Company | Action | New Grade | Date |
|---|---|---|---|
| Benchmark | Maintain | Buy | 2026-01-09 |
| Wedbush | Downgrade | Neutral | 2025-12-31 |
| Benchmark | Maintain | Buy | 2025-11-11 |
| Susquehanna | Maintain | Positive | 2025-11-11 |
| Wedbush | Maintain | Outperform | 2025-11-11 |
| Barclays | Maintain | Equal Weight | 2025-11-11 |
| Benchmark | Maintain | Buy | 2025-09-08 |
| Susquehanna | Maintain | Positive | 2025-08-05 |
| Benchmark | Maintain | Buy | 2025-08-05 |
| Benchmark | Maintain | Buy | 2025-08-04 |
Which company has the best grades?
Tower Semiconductor generally receives stronger buy and positive ratings, while Texas Instruments shows more hold and neutral grades. This suggests Tower may appeal to growth investors, whereas Texas Instruments faces more cautious sentiment.
Risks specific to each company
The following categories identify the critical pressure points and systemic threats facing both firms in the 2026 market environment:
1. Market & Competition
Texas Instruments Incorporated
- Dominates analog and embedded processing with strong brand and scale. Faces intense competition in diversified semiconductor markets.
Tower Semiconductor Ltd.
- Independent foundry with niche mixed-signal focus but smaller scale. Vulnerable to larger foundry competitors.
2. Capital Structure & Debt
Texas Instruments Incorporated
- Moderate leverage with debt-to-assets at 41%. Interest coverage strong at 11.5x but debt-to-equity score very unfavorable.
Tower Semiconductor Ltd.
- Low leverage, debt-to-assets below 6%, interest coverage excellent at 31.6x. Capital structure is conservative and stable.
3. Stock Volatility
Texas Instruments Incorporated
- Beta near market at 0.995 suggests average volatility aligned with Nasdaq tech sector.
Tower Semiconductor Ltd.
- Lower beta at 0.891 indicates slightly less volatility, offering steadier price movement.
4. Regulatory & Legal
Texas Instruments Incorporated
- US-based, subject to strong regulatory scrutiny but benefits from stable legal framework.
Tower Semiconductor Ltd.
- Based in Israel, exposed to complex regulatory environments and evolving international trade rules.
5. Supply Chain & Operations
Texas Instruments Incorporated
- Large global footprint with diversified supply chain reduces risk but complexity remains.
Tower Semiconductor Ltd.
- Smaller scale supply chain focused on specialized wafer fabrication, increasing operational risks.
6. ESG & Climate Transition
Texas Instruments Incorporated
- Established ESG programs, with emphasis on energy efficiency and sustainability in production.
Tower Semiconductor Ltd.
- Emerging ESG efforts, but smaller scale limits ability to invest heavily in climate transition initiatives.
7. Geopolitical Exposure
Texas Instruments Incorporated
- Primarily US operations with limited direct geopolitical risk but exposed to global market tensions.
Tower Semiconductor Ltd.
- Israeli headquarters and global operations expose firm to Middle East geopolitical volatility and trade disruptions.
Which company shows a better risk-adjusted profile?
Texas Instruments faces significant capital structure risks due to higher leverage, despite strong operating metrics and market dominance. Tower Semiconductor’s low leverage and strong interest coverage greatly reduce financial risk. However, Tower’s geopolitical exposure and smaller scale increase operational vulnerability. I see Tower’s conservative balance sheet as a meaningful buffer against market shocks, giving it a marginally better risk-adjusted profile. Recent sharp stock declines in Tower (-11%) highlight investor concern over external uncertainties despite solid fundamentals.
Final Verdict: Which stock to choose?
Texas Instruments Incorporated’s superpower lies in its robust capital efficiency and consistent value creation. Its strong ROIC well above WACC reflects a durable competitive edge. However, its declining profitability and stretched valuation ratios signal a point of vigilance. TXN suits investors targeting steady income and moderate growth in established portfolios.
Tower Semiconductor Ltd. builds its moat on improving profitability trends and a pristine balance sheet with minimal debt. Its growth in ROIC signals operational improvement, though it currently sheds economic value. Compared to TXN, TSEM offers greater growth potential but with higher volatility, fitting a growth-at-a-reasonable-price (GARP) or opportunistic growth portfolio.
If you prioritize capital efficiency and resilient dividend income, TXN is the compelling choice due to its proven ability to create value despite some margin pressures. However, if you seek higher growth with improving profitability and lower leverage, TSEM offers better upside potential and financial stability for risk-tolerant growth investors willing to accept a less mature moat.
Disclaimer: Investment carries a risk of loss of initial capital. The past performance is not a reliable indicator of future results. Be sure to understand risks before making an investment decision.
Go Further
I encourage you to read the complete analyses of Texas Instruments Incorporated and Tower Semiconductor Ltd. to enhance your investment decisions: