Home > Comparison > Technology > TXN vs STM
The strategic rivalry between Texas Instruments Incorporated and STMicroelectronics N.V. shapes the semiconductor industry’s evolution. Texas Instruments, a U.S.-based leader, focuses on analog and embedded processing with a capital-intensive model. STMicroelectronics, a European giant, blends automotive, industrial, and digital ICs through diversified segments. This analysis pits long-term stability against dynamic growth, aiming to identify which trajectory offers superior risk-adjusted returns for a balanced portfolio in 2026.
Table of contents
Companies Overview
Texas Instruments and STMicroelectronics dominate the global semiconductor landscape with distinct strategic approaches.
Texas Instruments Incorporated: Analog and Embedded Processing Leader
Texas Instruments commands the semiconductor market with a strong focus on analog and embedded processing products. It generates revenue by designing and selling power management and signal processing semiconductors globally. In 2026, Texas Instruments emphasizes innovation in battery management and microcontrollers, targeting industrial, automotive, and personal electronics sectors with robust, high-margin products.
STMicroelectronics N.V.: Diverse Semiconductor Innovator
STMicroelectronics operates across automotive, analog, MEMS, and microcontroller segments, offering a broad semiconductor portfolio. It earns revenue from automotive ICs, sensors, microcontrollers, and digital ICs, serving global markets. The 2026 strategy prioritizes integration of GaN power transistors, wireless charging, and secure microcontrollers, aiming to strengthen its foothold in automotive and industrial electronics.
Strategic Collision: Similarities & Divergences
Both companies focus on semiconductors but diverge in business models: Texas Instruments leverages a highly integrated analog and embedded processing ecosystem, while STMicroelectronics pursues a diversified, multi-segment approach. The primary battleground is automotive and industrial applications. Texas Instruments offers a stable, margin-rich profile; STMicroelectronics presents growth potential with broader market exposure and innovation in emerging technologies.
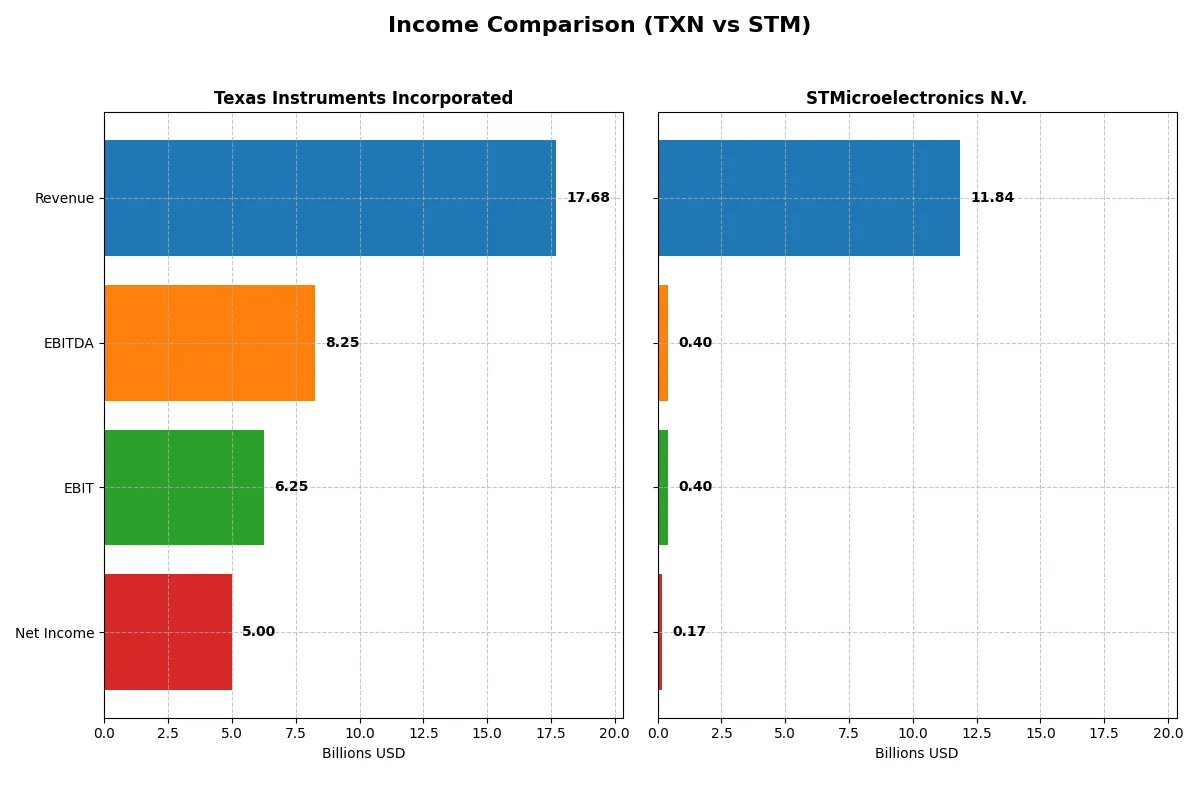
Income Statement Comparison
This data dissects the core profitability and scalability of both corporate engines to reveal who dominates the bottom line:
| Metric | Texas Instruments Incorporated (TXN) | STMicroelectronics N.V. (STM) |
|---|---|---|
| Revenue | 17.7B | 11.8B |
| Cost of Revenue | 7.6B | 7.8B |
| Operating Expenses | 4.1B | 3.7B |
| Gross Profit | 10.1B | 4.0B |
| EBITDA | 8.3B | 401M |
| EBIT | 6.3B | 401M |
| Interest Expense | 543M | 0 |
| Net Income | 5.0B | 167M |
| EPS | 5.45 | 0.19 |
| Fiscal Year | 2025 | 2025 |
Income Statement Analysis: The Bottom-Line Duel
This income statement comparison exposes how Texas Instruments and STMicroelectronics convert revenue into profit, revealing each firm’s operational efficiency.
Texas Instruments Incorporated Analysis
Texas Instruments (TXN) shows a mixed revenue trend, declining overall but rising 13% from 2024 to 2025, reaching $17.7B. Net income fell 35% over five years but edged up 4.8% in the latest year to $5B. Margins remain robust: gross margin stands at 57%, net margin at 28%, signaling strong cost control and profit retention despite recent challenges.
STMicroelectronics N.V. Analysis
STMicroelectronics (STM) faces a persistent revenue decline, sliding 7% over five years and 11% in the last year to $11.8B. Net income collapsed 92% over the same period to just $167M in 2025. Margins are thin, with a gross margin around 34% and net margin barely above 1%, reflecting margin pressure and operational inefficiency in the latest fiscal year.
Margin Strength vs. Shrinking Scale
Texas Instruments clearly outperforms STMicroelectronics in profitability and margin sustainability. TXN’s ability to maintain high margins amid fluctuating revenues contrasts starkly with STM’s steep earnings declines and razor-thin net margins. Investors seeking stability and efficiency will find TXN’s profile more compelling than STM’s struggling growth and profitability.
Financial Ratios Comparison
These vital ratios act as a diagnostic tool to expose the underlying fiscal health, valuation premiums, and capital efficiency of the companies compared below:
| Ratios | Texas Instruments (TXN) | STMicroelectronics (STM) |
|---|---|---|
| ROE | 30.7% | 0.9% |
| ROIC | 16.5% | 0.7% |
| P/E | 31.5 | 0 |
| P/B | 9.7 | 0 |
| Current Ratio | 4.35 | 3.36 |
| Quick Ratio | 2.83 | 2.43 |
| D/E | 0.86 | 0.12 |
| Debt-to-Assets | 40.6% | 8.6% |
| Interest Coverage | 11.1 | 0 |
| Asset Turnover | 0.51 | 0.48 |
| Fixed Asset Turnover | 1.44 | 1.07 |
| Payout Ratio | 100.0% | 0% |
| Dividend Yield | 3.17% | 0% |
| Fiscal Year | 2025 | 2025 |
Efficiency & Valuation Duel: The Vital Signs
Financial ratios act as the company’s DNA, revealing hidden risks and operational excellence behind headline numbers.
Texas Instruments Incorporated
Texas Instruments delivers robust profitability with a 30.7% ROE and 28.3% net margin, signaling efficient capital use. The stock trades at a stretched P/E of 31.5 and a high P/B of 9.7, suggesting premium valuation. Shareholders benefit from a 3.17% dividend yield, reflecting steady income alongside reinvestment in R&D at 11.8% of revenue.
STMicroelectronics N.V.
STMicroelectronics shows weak profitability with a 0.93% ROE and 1.4% net margin, indicating operational challenges. Its valuation metrics appear favorable due to a zero P/E and P/B, but these reflect underlying losses or accounting quirks. No dividend is paid, as the company prioritizes heavy R&D spending at 17.3%, aiming for future growth amid current inefficiencies.
Premium Valuation vs. Operational Safety
Texas Instruments combines strong profitability with a premium valuation, balancing shareholder returns and reinvestment. STMicroelectronics offers a cheaper valuation but struggles with profitability and returns. Investors seeking stability may prefer Texas Instruments, while those tolerant of risk might consider STMicroelectronics’ growth profile.
Which one offers the Superior Shareholder Reward?
I compare Texas Instruments (TXN) and STMicroelectronics (STM) on dividend yield, payout ratios, and buyback intensity. TXN delivers a 3.17% dividend yield with nearly 100% payout, backed by solid free cash flow of 2.86/share in 2025. STM yields only 1.28% with a 18% payout ratio, reflecting a cautious distribution. TXN’s buybacks appear more aggressive and sustainable, supported by robust operating margins above 34%, while STM’s thin 3.4% gross margin and minimal free cash flow raise concerns. I conclude TXN offers a superior total return profile in 2026, balancing yield, buybacks, and cash flow strength.
Comparative Score Analysis: The Strategic Profile
The radar chart reveals the fundamental DNA and trade-offs of Texas Instruments and STMicroelectronics, illustrating their core financial strengths and weaknesses:
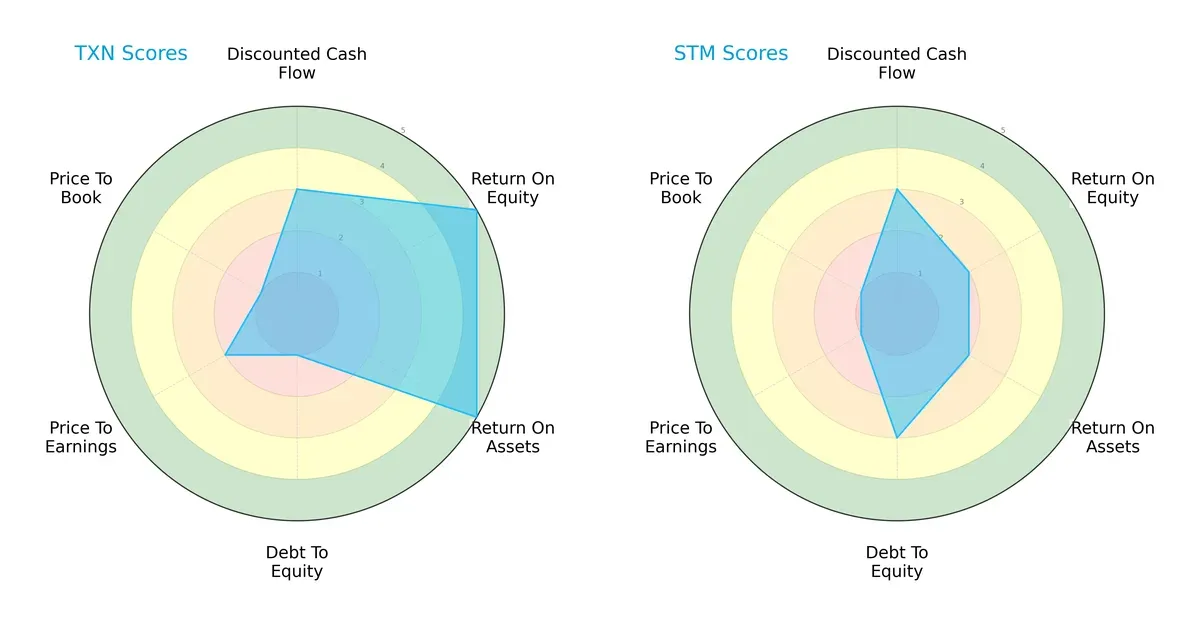
Texas Instruments dominates in profitability with top ROE and ROA scores of 5 versus STMicroelectronics’ moderate 2s. Both score evenly on discounted cash flow at 3. Texas Instruments’ balance sheet is weaker, suffering a very unfavorable debt-to-equity score of 1, compared to STMicroelectronics’ moderate 3. Valuation metrics (P/E and P/B) are a red flag for both, scoring low at 2 and 1 respectively. Overall, Texas Instruments shows a more balanced profit generation edge but carries higher financial risk, while STMicroelectronics maintains moderate profitability with better leverage control.
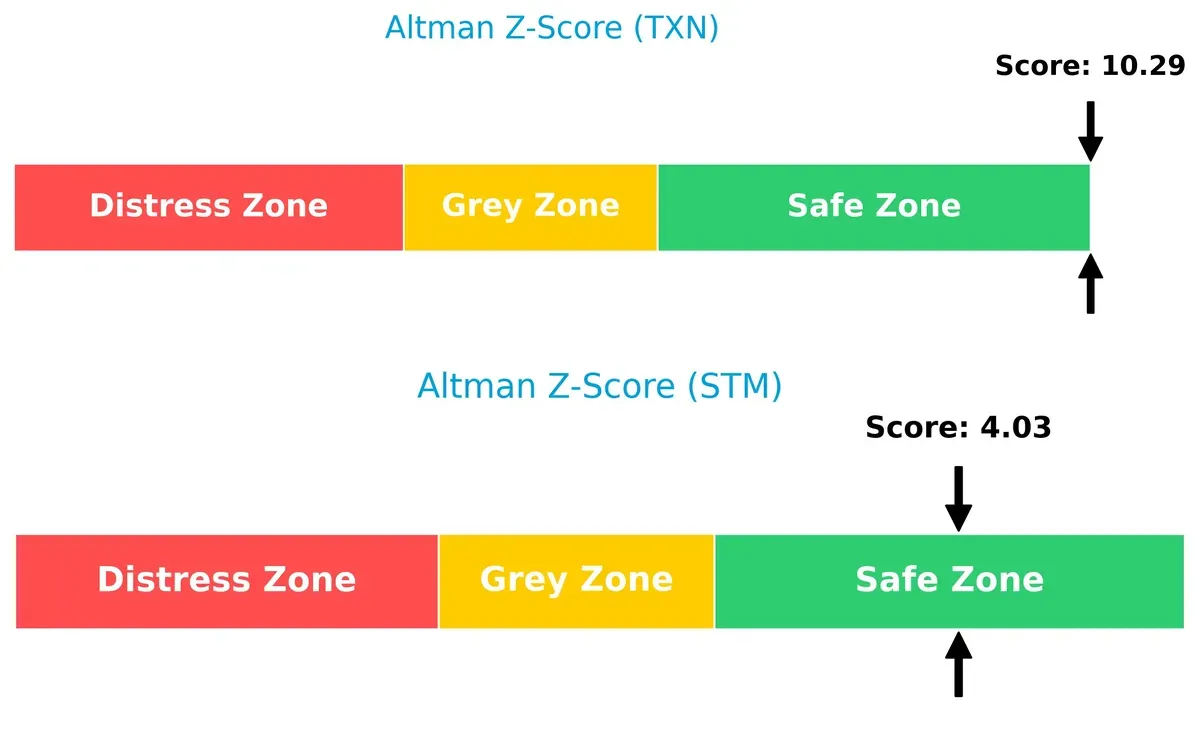
Bankruptcy Risk: Solvency Showdown
Texas Instruments’ Altman Z-Score of 10.3 significantly outpaces STMicroelectronics’ 4.0, both safely above the distress threshold, indicating robust solvency and low bankruptcy risk for both firms in the current cycle:
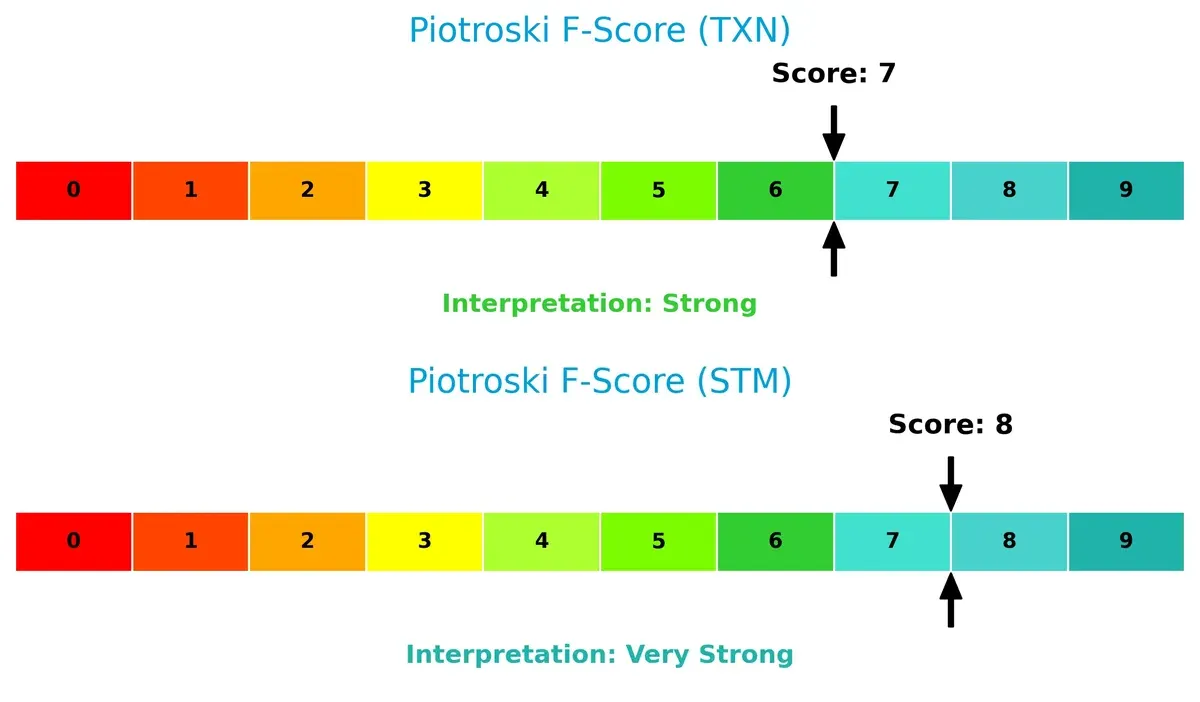
Financial Health: Quality of Operations
STMicroelectronics edges Texas Instruments with a Piotroski F-Score of 8 versus 7, signaling slightly stronger internal financial health. Both companies are financially sound, but Texas Instruments shows minor red flags in operational efficiency and leverage compared to STMicroelectronics’ very strong fundamentals:
How are the two companies positioned?
This section dissects the operational DNA of Texas Instruments and STMicroelectronics by comparing their revenue distribution and internal strengths and weaknesses. The goal is to confront their economic moats and identify which model offers the most resilient, sustainable advantage in today’s market.
Revenue Segmentation: The Strategic Mix
This comparison dissects how Texas Instruments and STMicroelectronics diversify their income streams and where their primary sector bets lie:
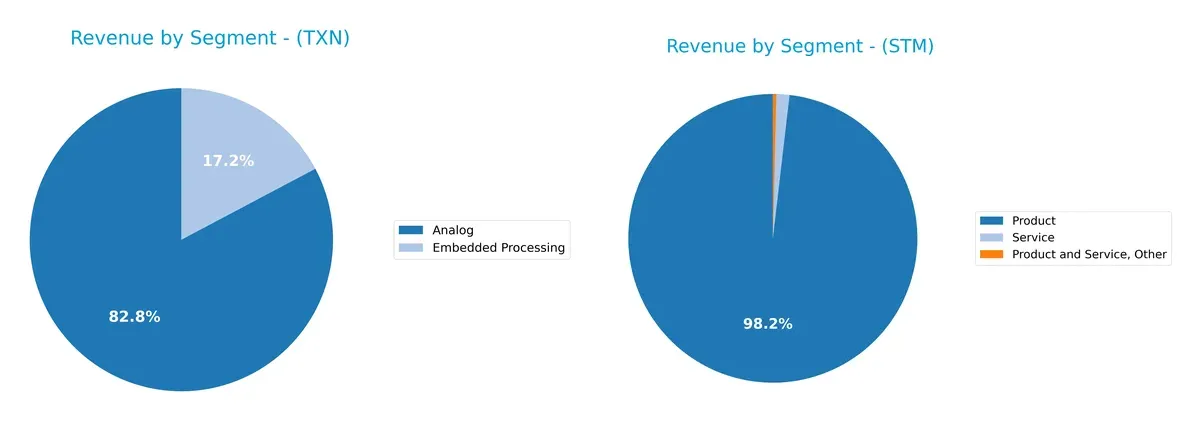
Texas Instruments anchors its revenue in Analog at $12.2B for 2024, with Embedded Processing at $2.5B, showing moderate diversification. STMicroelectronics relies heavily on a broad Product category at $13.2B, with minimal Service and Other revenues. Texas Instruments’ focus on Analog signals a strong moat in precision components, while ST’s concentrated Product revenue exposes it to cyclical risks but benefits from integrated device ecosystems.
Strengths and Weaknesses Comparison
This table compares the Strengths and Weaknesses of Texas Instruments and STMicroelectronics:
Texas Instruments Strengths
- Strong profitability with net margin 28.28% and ROE 30.73%
- Robust dividend yield 3.17%
- Diverse product segments including Analog and Embedded Processing
- Significant global presence with strong US and Asia revenues
- Favorable interest coverage ratio 11.52
STMicroelectronics Strengths
- Low debt levels with debt-to-assets 8.6% and debt-to-equity 0.12
- Favorable P/E and P/B ratios indicating potential valuation upside
- Solid quick ratio 2.43
- Infinite interest coverage signals strong ability to cover interest expense
- Geographic diversification across Singapore, Switzerland, US, and Europe
Texas Instruments Weaknesses
- Elevated P/E at 31.53 and high P/B ratio 9.69 may limit valuation upside
- Unfavorable current ratio 4.35 suggests potential liquidity inefficiencies
- Neutral debt-to-equity and asset turnover metrics limit operational leverage
STMicroelectronics Weaknesses
- Weak profitability with net margin 1.41%, ROE 0.93%, and ROIC 0.67%
- No dividend yield impacting income-focused investors
- Unfavorable asset turnover 0.48
- Unfavorable current ratio 3.36 indicates liquidity constraints
Texas Instruments demonstrates robust profitability and strong global diversification, supporting a resilient business model. STMicroelectronics shows financial conservatism with low leverage but faces challenges in profitability and asset utilization, which may pressure its strategic growth options.
The Moat Duel: Analyzing Competitive Defensibility
A structural moat is the only true safeguard for long-term profits against relentless competition and market commoditization:
Texas Instruments Incorporated: Cost Advantage and Operational Efficiency
Texas Instruments leverages its cost advantage through scale in analog semiconductors, reflected in a strong 57% gross margin and stable 35% EBIT margin. Despite a declining ROIC trend, its deep integration in industrial and automotive markets supports future moat resilience in 2026.
STMicroelectronics N.V.: Diversified Product Portfolio with Execution Challenges
STMicroelectronics relies on product diversification across analog, MEMS, and microcontrollers but suffers from weak profitability and a negative ROIC spread versus WACC. This indicates value destruction and raises concerns about sustaining its moat amid intensifying semiconductor competition in 2026.
Cost Leadership vs. Product Breadth: The Moat Showdown
Texas Instruments holds the deeper moat with consistent value creation and superior margins. STMicroelectronics’ value destruction and profitability decline leave it vulnerable. TI is better positioned to defend market share through operational scale and focused capital allocation.
Which stock offers better returns?
The past year shows Texas Instruments’ shares gaining strongly, while STMicroelectronics faces a significant decline despite recent partial recovery.
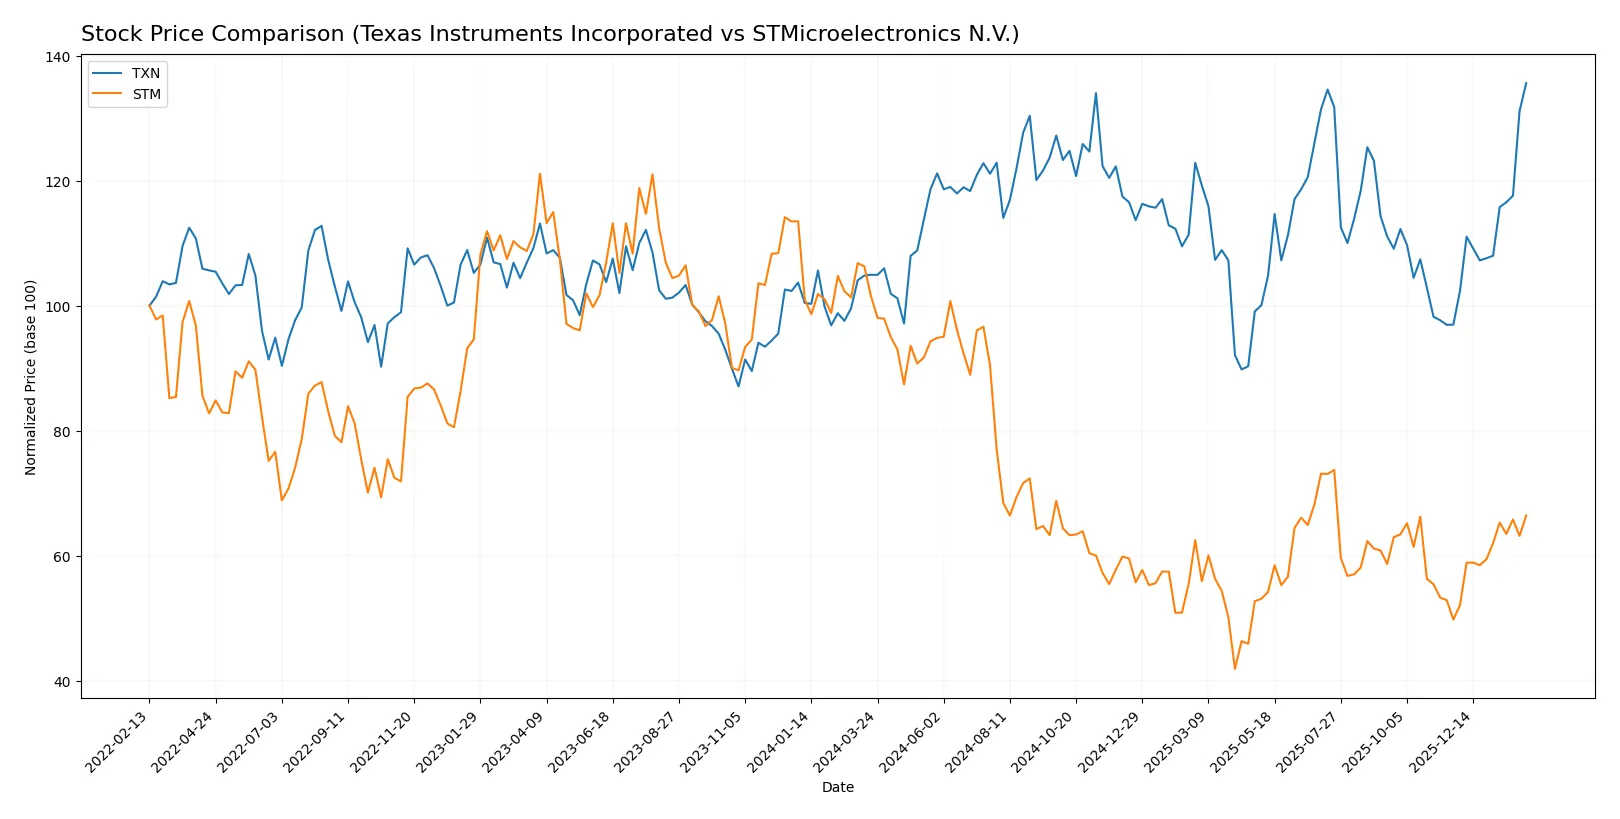
Trend Comparison
Texas Instruments (TXN) posts a bullish 29.21% gain over 12 months, with accelerating momentum and a high volatility of 16.23%. The stock hit a peak of 222.92 and a low of 147.6.
STMicroelectronics (STM) ends the year with a bearish -34.6% drop, accelerating downward but with lower volatility at 6.54%. Its high was 44.85 and low 18.49 during this period.
TXN outperforms STM markedly, delivering positive returns versus STM’s steep loss, despite both showing recent price acceleration.
Target Prices
Analysts present a mixed but constructive outlook for Texas Instruments and STMicroelectronics.
| Company | Target Low | Target High | Consensus |
|---|---|---|---|
| Texas Instruments Incorporated | 160 | 260 | 205 |
| STMicroelectronics N.V. | 28 | 45 | 38 |
Texas Instruments trades above its target consensus, signaling cautious optimism. STMicroelectronics’ consensus exceeds its current price, indicating potential upside according to analysts.

Don’t Let Luck Decide Your Entry Point
Optimize your entry points with our advanced ProRealTime indicators. You’ll get efficient buy signals with precise price targets for maximum performance. Start outperforming now!
How do institutions grade them?
The following tables summarize institutional grades for Texas Instruments Incorporated and STMicroelectronics N.V.:
Texas Instruments Incorporated Grades
The table below presents recent grades from notable financial institutions:
| Grading Company | Action | New Grade | Date |
|---|---|---|---|
| Jefferies | Maintain | Hold | 2026-01-28 |
| Cantor Fitzgerald | Maintain | Neutral | 2026-01-28 |
| Goldman Sachs | Maintain | Sell | 2026-01-28 |
| Truist Securities | Maintain | Hold | 2026-01-28 |
| Deutsche Bank | Maintain | Hold | 2026-01-28 |
| Stifel | Maintain | Hold | 2026-01-28 |
| UBS | Maintain | Buy | 2026-01-28 |
| B of A Securities | Upgrade | Neutral | 2026-01-28 |
| Wells Fargo | Maintain | Equal Weight | 2026-01-28 |
| JP Morgan | Maintain | Overweight | 2026-01-28 |
STMicroelectronics N.V. Grades
The table below shows recent grades from recognized grading firms:
| Grading Company | Action | New Grade | Date |
|---|---|---|---|
| TD Cowen | Maintain | Buy | 2025-10-24 |
| Susquehanna | Maintain | Positive | 2025-10-22 |
| Susquehanna | Maintain | Positive | 2025-07-25 |
| Baird | Upgrade | Outperform | 2025-07-22 |
| Susquehanna | Maintain | Positive | 2025-07-22 |
| Jefferies | Upgrade | Buy | 2025-02-19 |
| Bernstein | Downgrade | Market Perform | 2025-02-05 |
| Susquehanna | Maintain | Positive | 2025-01-31 |
| Barclays | Downgrade | Underweight | 2025-01-22 |
| JP Morgan | Downgrade | Neutral | 2024-12-09 |
Which company has the best grades?
STMicroelectronics holds a stronger consensus with multiple “Buy” and “Positive” ratings, including an “Outperform” upgrade. Texas Instruments shows more mixed grades, balancing “Hold,” “Neutral,” and some “Buy” recommendations. Investors may view STMicroelectronics’s more frequent positive upgrades as a signal of stronger institutional confidence relative to Texas Instruments.
Risks specific to each company
The following categories outline the critical pressure points and systemic threats facing Texas Instruments Incorporated (TXN) and STMicroelectronics N.V. (STM) in the 2026 market environment:
1. Market & Competition
Texas Instruments Incorporated (TXN)
- Dominates analog and embedded processing with strong market share and brand moat.
STMicroelectronics N.V. (STM)
- Faces intense competition in automotive and MEMS segments with narrower margins.
2. Capital Structure & Debt
Texas Instruments Incorporated (TXN)
- Moderate leverage with debt-to-equity at 0.86; interest coverage robust at 11.5x.
STMicroelectronics N.V. (STM)
- Low leverage with debt-to-equity 0.12; virtually no interest burden, indicating conservative risk.
3. Stock Volatility
Texas Instruments Incorporated (TXN)
- Beta near 1.0 suggests average volatility aligned with market.
STMicroelectronics N.V. (STM)
- Beta 1.32 signals higher price swings and market sensitivity.
4. Regulatory & Legal
Texas Instruments Incorporated (TXN)
- U.S.-based with exposure to evolving semiconductor export controls.
STMicroelectronics N.V. (STM)
- European headquarters with EU regulatory complexity and trade compliance risks.
5. Supply Chain & Operations
Texas Instruments Incorporated (TXN)
- Well-established supply chain; diversified manufacturing reduces disruption risk.
STMicroelectronics N.V. (STM)
- Broader product range increases operational complexity and supply chain vulnerability.
6. ESG & Climate Transition
Texas Instruments Incorporated (TXN)
- Strong focus on energy-efficient analog products supports ESG credentials.
STMicroelectronics N.V. (STM)
- MEMS and sensors align with sustainability trends but face regulatory scrutiny.
7. Geopolitical Exposure
Texas Instruments Incorporated (TXN)
- U.S.-China tensions pose export and supply risks but offset by diversified markets.
STMicroelectronics N.V. (STM)
- European location exposes STM to EU-China trade tensions and regional political risks.
Which company shows a better risk-adjusted profile?
Texas Instruments faces its greatest risk from geopolitical tensions impacting U.S. semiconductor exports, while STMicroelectronics is hampered by weak profitability and higher stock volatility. TXN’s robust profitability and capital structure provide a stronger risk-adjusted profile. STM’s higher beta and narrower margins elevate investment risk despite lower leverage. The recent Altman Z-Score of 10.3 for TXN versus 4.0 for STM highlights TXN’s superior financial safety margin in turbulent markets.
Final Verdict: Which stock to choose?
Texas Instruments Incorporated’s superpower lies in its strong and consistent value creation, driven by an economic moat that delivers high returns on invested capital. Its key point of vigilance is the declining ROIC trend, which suggests pressure on future profitability. It suits portfolios aiming for steady, slightly favorable growth with moderate risk tolerance.
STMicroelectronics N.V. offers a strategic moat rooted in its relatively low leverage and strong balance sheet, which provides a safety cushion. However, it currently struggles with profitability and value creation, reflecting a more challenging operating environment. It fits investors seeking turnaround opportunities with a GARP (Growth at a Reasonable Price) profile, accepting higher risk for potential recovery.
If you prioritize stable value creation and a proven economic moat, Texas Instruments outshines due to its robust capital efficiency despite some weakening trends. However, if you seek a riskier play with a focus on balance sheet strength and potential rebound, STMicroelectronics offers better stability and a lower leverage profile. Both carry risks, so alignment with your risk tolerance and investment horizon is paramount.
Disclaimer: Investment carries a risk of loss of initial capital. The past performance is not a reliable indicator of future results. Be sure to understand risks before making an investment decision.
Go Further
I encourage you to read the complete analyses of Texas Instruments Incorporated and STMicroelectronics N.V. to enhance your investment decisions: