Home > Comparison > Technology > TXN vs SLAB
The strategic rivalry between Texas Instruments Incorporated and Silicon Laboratories Inc. defines the current trajectory of the semiconductor industry. Texas Instruments operates as a capital-intensive semiconductor manufacturing giant with a broad analog and embedded processing portfolio. Silicon Laboratories, a fabless semiconductor company, specializes in high-margin, analog-intensive mixed-signal solutions for IoT applications. This analysis contrasts their business models to identify which offers superior risk-adjusted returns for a diversified portfolio.
Table of contents
Companies Overview
Texas Instruments and Silicon Laboratories are pivotal players in the semiconductor industry, shaping technology trends with distinct approaches.
Texas Instruments Incorporated: Analog & Embedded Processing Powerhouse
Texas Instruments dominates as a leading semiconductor manufacturer with a diverse product portfolio spanning Analog and Embedded Processing segments. It generates revenue by designing and selling power management and signal processing chips globally. In 2026, its strategic focus remains on expanding industrial and automotive applications, leveraging its deep expertise to maintain a robust market position.
Silicon Laboratories Inc.: Fabless Innovator in IoT Solutions
Silicon Laboratories operates as a fabless semiconductor company specializing in analog-intensive mixed-signal solutions for the Internet of Things. Its revenue stems from wireless microcontrollers and sensors used in smart home, industrial automation, and medical devices. The company prioritizes growth in connected IoT markets, emphasizing innovation and flexible sales channels in 2026 to capture emerging opportunities.
Strategic Collision: Similarities & Divergences
Both firms excel in semiconductors but pursue contrasting models: Texas Instruments integrates manufacturing with broad industrial focus, while Silicon Labs relies on a fabless model targeting IoT niches. Their competition centers on market share in analog and mixed-signal chips. Investors will notice Texas Instruments offers scale and stability, whereas Silicon Laboratories presents a higher-beta, innovation-driven profile with growth potential.
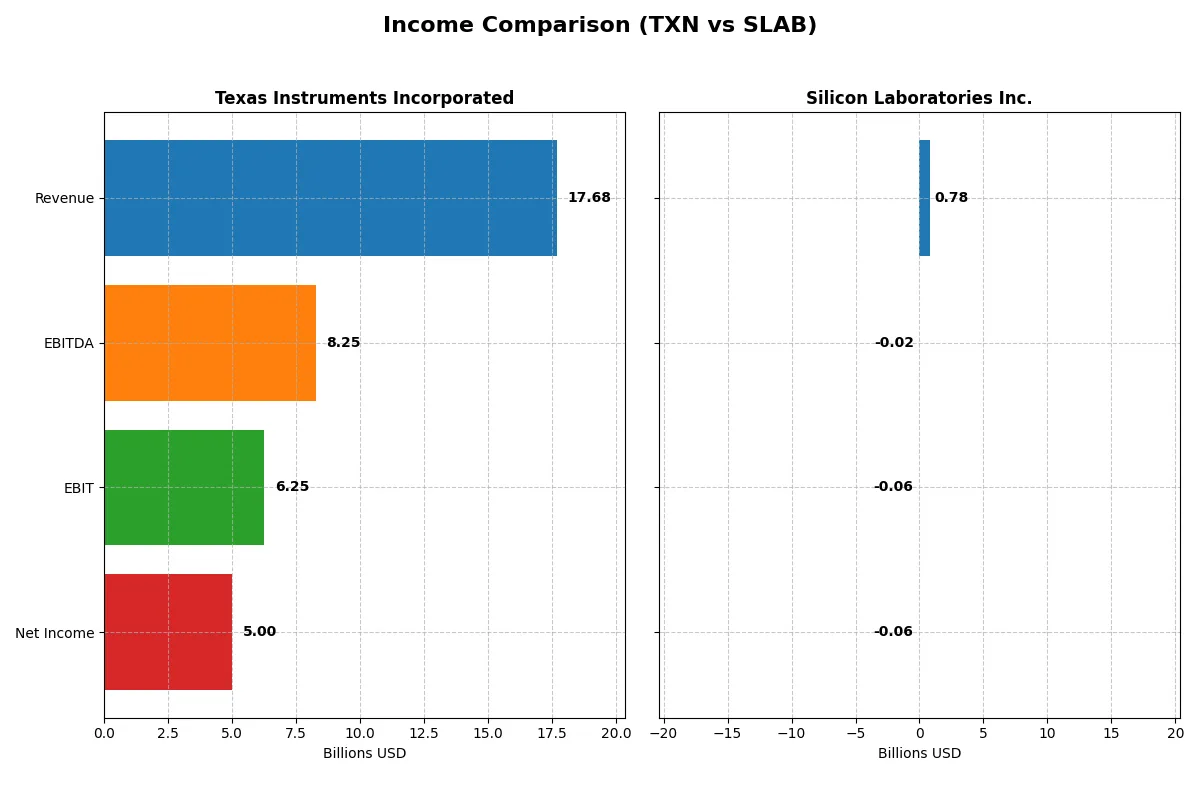
Income Statement Comparison
This data dissects the core profitability and scalability of both corporate engines to reveal who dominates the bottom line:
| Metric | Texas Instruments Incorporated (TXN) | Silicon Laboratories Inc. (SLAB) |
|---|---|---|
| Revenue | 17.7B | 785M |
| Cost of Revenue | 7.6B | 328M |
| Operating Expenses | 4.1B | 528M |
| Gross Profit | 10.1B | 457M |
| EBITDA | 8.3B | -19M |
| EBIT | 6.3B | -57M |
| Interest Expense | 543M | 1M |
| Net Income | 5.0B | -65M |
| EPS | 5.45 | -1.98 |
| Fiscal Year | 2025 | 2025 |
Income Statement Analysis: The Bottom-Line Duel
The forthcoming income statement comparison reveals which company runs the more efficient and profitable corporate engine over recent years.
Texas Instruments Incorporated Analysis
Texas Instruments posted revenues fluctuating around $17B-$20B from 2021 to 2025, ending with $17.7B in 2025. Net income trended downward overall, hitting $5B in 2025 from $7.7B in 2021. Gross margins remain robust near 57%, with net margins steady at 28%. Despite a slight dip in net margin, TI sustains strong operational efficiency and healthy earnings per share growth.
Silicon Laboratories Inc. Analysis
Silicon Laboratories showed revenue growth from $720M in 2021 to $785M in 2025, a 34% one-year surge in 2025. However, net income remains negative at -$65M in 2025 despite improving margins. Gross margin is solid at 58%, but EBIT and net margins are unfavorable, reflecting ongoing challenges in profitability. Recent momentum suggests operational improvements but profitability remains elusive.
Margin Strength vs. Profit Scale
Texas Instruments clearly outperforms in net income scale and margin stability, delivering $5B net income versus Silicon Labs’ losses. TI’s consistent profitability and margin control provide a fundamentally stronger profile. Silicon Labs offers high growth potential, but investors will note its persistent net losses and margin struggles. TI’s proven earnings power appeals more to income-focused investors.
Financial Ratios Comparison
These vital ratios act as a diagnostic tool to expose the underlying fiscal health, valuation premiums, and capital efficiency of each company:
| Ratios | Texas Instruments (TXN) | Silicon Laboratories (SLAB) |
|---|---|---|
| ROE | 30.7% | -5.9% |
| ROIC | 16.5% | -6.3% |
| P/E | 31.5 | -66.5 |
| P/B | 9.69 | 3.94 |
| Current Ratio | 4.35 | 4.69 |
| Quick Ratio | 2.83 | 4.02 |
| D/E | 0.95 | 0 |
| Debt-to-Assets | 44.5% | 0% |
| Interest Coverage | 11.1 | -72.3 |
| Asset Turnover | 0.51 | 0.62 |
| Fixed Asset Turnover | 1.44 | 6.10 |
| Payout ratio | 100.0% | 0% |
| Dividend yield | 3.17% | 0% |
| Fiscal Year | 2025 | 2025 |
Efficiency & Valuation Duel: The Vital Signs
Financial ratios serve as a company’s DNA, unveiling hidden risks and operational strengths essential for any investor’s toolkit.
Texas Instruments Incorporated
Texas Instruments delivers robust profitability with a 30.7% ROE and a strong 28.3% net margin, signaling operational excellence. Its valuation appears stretched, with a P/E of 31.5 and a P/B of 9.7. The company rewards shareholders with a 3.17% dividend yield, reflecting steady cash returns alongside focused R&D reinvestment.
Silicon Laboratories Inc.
Silicon Laboratories shows weak profitability, with a negative ROE of -5.9% and an -8.3% net margin, highlighting ongoing operational challenges. Its P/E ratio is negative, suggesting valuation difficulties, while a P/B of 3.9 remains moderate. The firm does not pay dividends, instead channeling resources aggressively into R&D, which accounts for 45% of revenues.
Premium Valuation vs. Operational Safety
Texas Instruments offers superior profitability and consistent shareholder returns despite a premium valuation. Silicon Laboratories struggles with losses and lacks shareholder payouts, increasing risk. Investors seeking operational safety and income may prefer Texas Instruments, while those focusing on growth through heavy R&D might consider Silicon Laboratories’ high-risk profile.
Which one offers the Superior Shareholder Reward?
I compare Texas Instruments and Silicon Laboratories on dividends, buybacks, and sustainability. Texas Instruments yields 3.17% with a near 100% payout ratio, fully covered by free cash flow. Its consistent buybacks amplify total returns. Silicon Labs pays no dividend but reinvests heavily in growth, showing negative margins and volatile cash flows. Its buyback activity is minimal, signaling a riskier, growth-focused model. I see Texas Instruments’ balanced yield and buyback strategy as more sustainable and rewarding for 2026 investors.
Comparative Score Analysis: The Strategic Profile
The radar chart reveals the fundamental DNA and trade-offs of Texas Instruments and Silicon Laboratories, illustrating their distinct financial strengths and vulnerabilities:
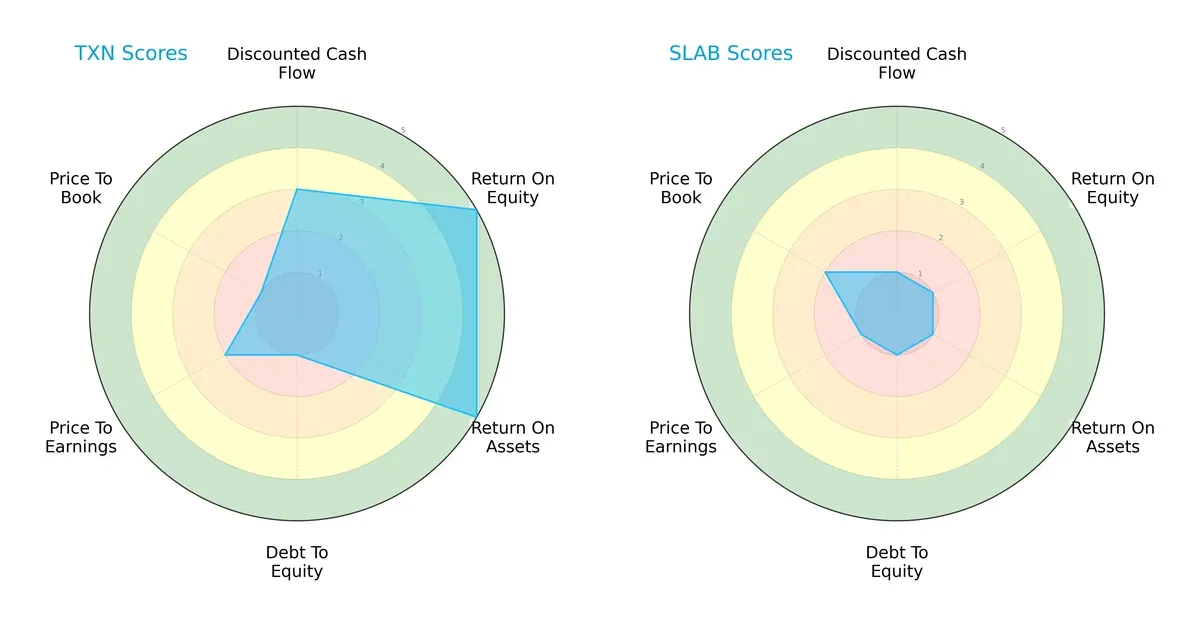
Texas Instruments dominates in profitability with top ROE (5) and ROA (5) scores, signaling efficient asset and equity utilization. However, its debt-to-equity score (1) flags high leverage risk. Silicon Laboratories scores uniformly low across all metrics, reflecting financial strain and weak operational efficiency. TI’s profile is more balanced, leveraging operational excellence despite leverage concerns, while SLAB depends heavily on its limited valuation edge (P/B score 2), which remains unfavorable.
Bankruptcy Risk: Solvency Showdown
Texas Instruments and Silicon Laboratories both sit comfortably in the safe zone by Altman Z-Score standards, suggesting strong long-term survival prospects in this market cycle:
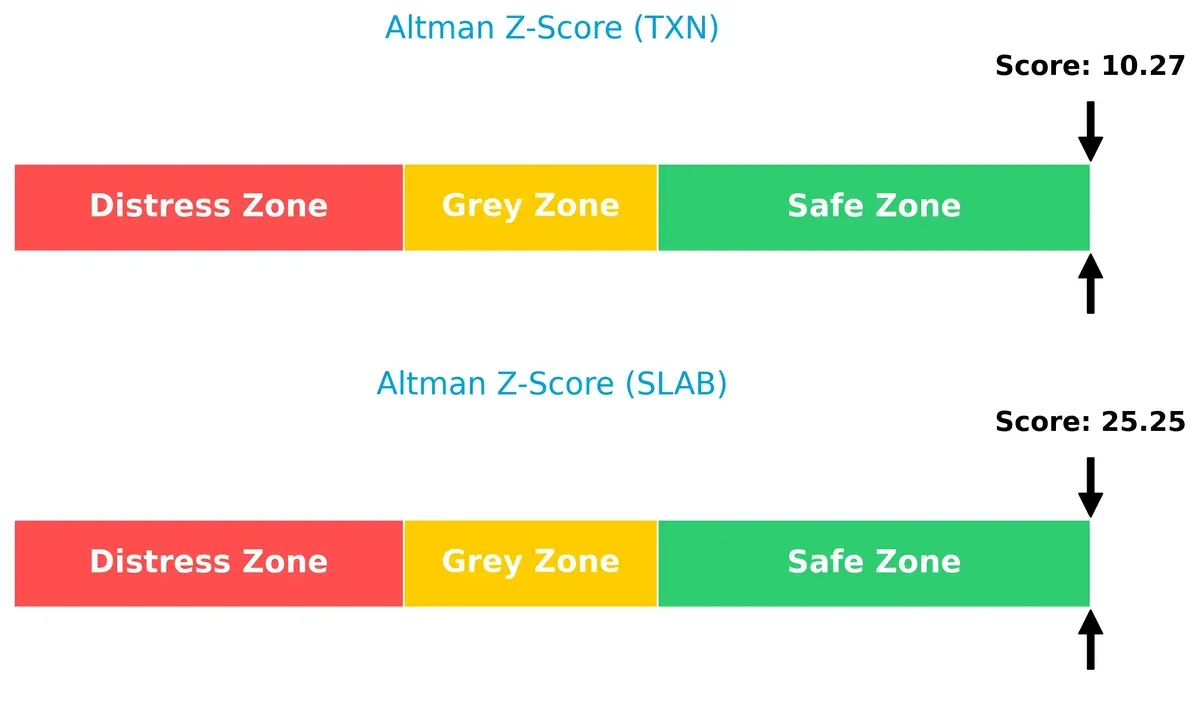
Texas Instruments posts a solid 10.3, confirming robust solvency despite leverage. Silicon Laboratories shows an even higher 25.2, indicating exceptional bankruptcy resilience, likely due to lower operating scale and financial structure differences.
Financial Health: Quality of Operations
Texas Instruments leads with a strong Piotroski F-Score of 7, signaling solid internal financial health and operational quality. Silicon Laboratories scores a moderate 4, raising internal metric red flags:
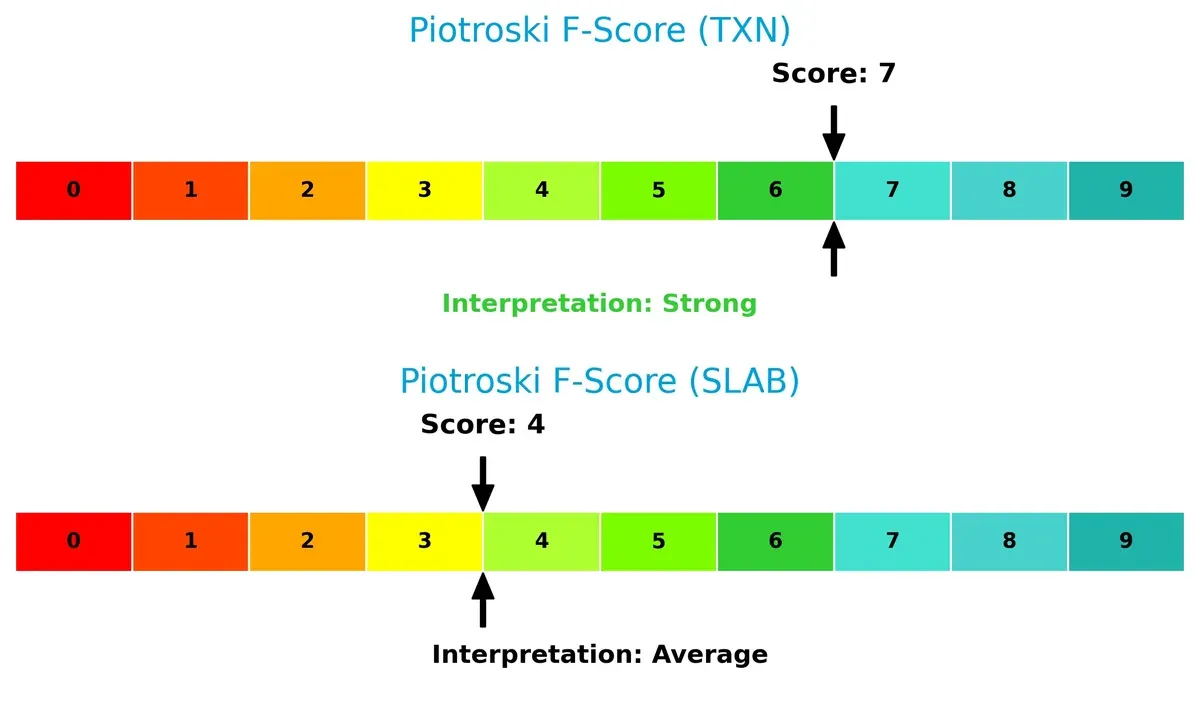
TI’s score reflects efficient profitability, liquidity, and leverage management. SLAB’s middling 4 suggests inconsistent financial strength, warranting caution in investment decisions.
How are the two companies positioned?
This section dissects TXN and SLAB’s operational DNA by comparing revenue distribution and internal dynamics. The goal is to confront their economic moats to reveal which model offers the most resilient, sustainable advantage today.
Revenue Segmentation: The Strategic Mix
This visual comparison dissects how Texas Instruments and Silicon Laboratories diversify income streams and reveals their primary sector bets:
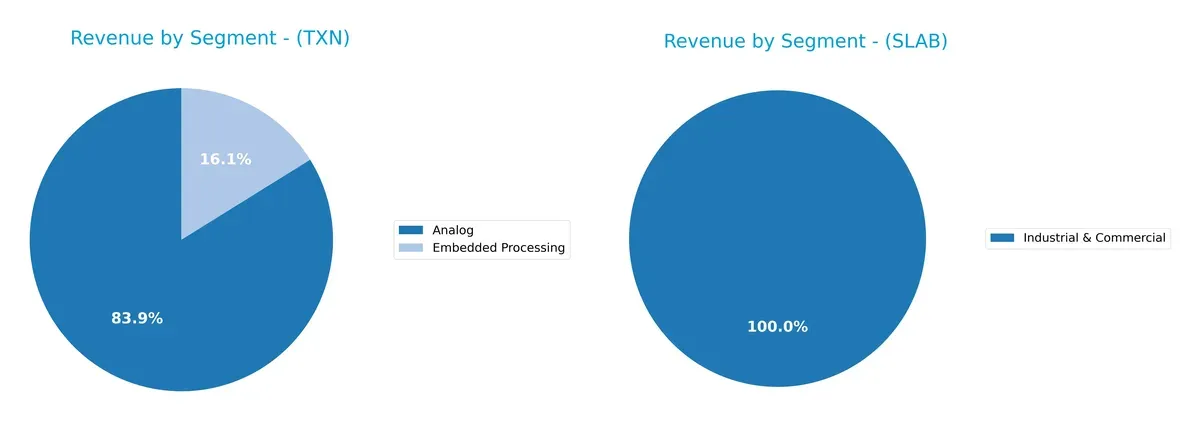
Texas Instruments anchors its revenue in Analog at $14B (2025), with Embedded Processing trailing at $2.7B. This concentration underscores a dominant moat in analog semiconductors. Silicon Laboratories, by contrast, pivots solely on Industrial & Commercial, generating $445M, reflecting narrower diversification and higher concentration risk. TI’s broad portfolio supports ecosystem lock-in, while SLAB’s reliance on one segment signals vulnerability to market shifts within industrial technology.
Strengths and Weaknesses Comparison
This table compares the Strengths and Weaknesses of Texas Instruments and Silicon Laboratories:
Texas Instruments Strengths
- Strong profitability with 28.3% net margin and 30.7% ROE
- Favorable ROIC at 16.5% well above WACC
- Diversified revenue streams including Analog and Embedded Processing
- Global presence with significant revenue in US, China, and EMEA
- Solid dividend yield at 3.17%
- Healthy quick ratio at 2.83
Silicon Laboratories Strengths
- No debt, zero debt-to-assets ratio
- Favorable quick ratio at 4.02
- High fixed asset turnover at 6.1
- Presence in Industrial & Commercial segment
- Positive valuation metric (PE ratio) due to negative earnings
- Geographic diversification including China, Taiwan, and US
Texas Instruments Weaknesses
- Unfavorable valuation with PE at 31.5 and PB at 9.7
- Unusually high current ratio at 4.35 may indicate inefficient asset use
- Neutral debt levels at 0.95 debt-to-equity
- Asset turnover moderate at 0.51
- Exposure to competitive global markets
Silicon Laboratories Weaknesses
- Negative profitability with -8.3% net margin and -5.9% ROE
- Unfavorable ROIC at -6.3%, below WACC of 10.9%
- Negative interest coverage at -58.4 signals financial stress
- No dividend yield
- Unfavorable PB at 3.94
- High proportion of unfavorable ratios at 57%
Texas Instruments demonstrates a robust profitability and diversified global footprint, although valuation and current asset efficiency raise caution. Silicon Laboratories shows financial vulnerabilities despite strengths in asset utilization and debt avoidance, indicating challenges in profitability and capital efficiency.
The Moat Duel: Analyzing Competitive Defensibility
A structural moat is the only shield protecting long-term profits from relentless competitive erosion. Here’s how Texas Instruments and Silicon Laboratories stack up:
Texas Instruments Incorporated: Cost Advantage and Scale Moat
Texas Instruments leverages a formidable cost advantage rooted in scale and manufacturing expertise. This manifests in a strong 57% gross margin and stable 28% net margin. In 2026, expansion in analog and embedded processing markets could deepen its moat despite a slight ROIC decline.
Silicon Laboratories Inc.: Niche Innovation with Limited Moat
Silicon Labs relies on specialized mixed-signal products tailored to IoT applications, contrasting TI’s broad cost moat. Despite impressive 34% revenue growth and margin improvements, its negative ROIC and net margin signal profitability challenges. Future innovation could disrupt niches but risks remain high.
Verdict: Cost Leadership vs. Niche Innovation
Texas Instruments holds the deeper moat with consistent value creation and high margins. Silicon Labs’ niche focus shows promise but suffers from value destruction and profitability headwinds. TI is better positioned to defend market share long term.
Which stock offers better returns?
Over the past 12 months, Texas Instruments and Silicon Laboratories exhibited strong bullish trends with accelerating price gains and rising buyer dominance, reflecting robust investor interest and market momentum.
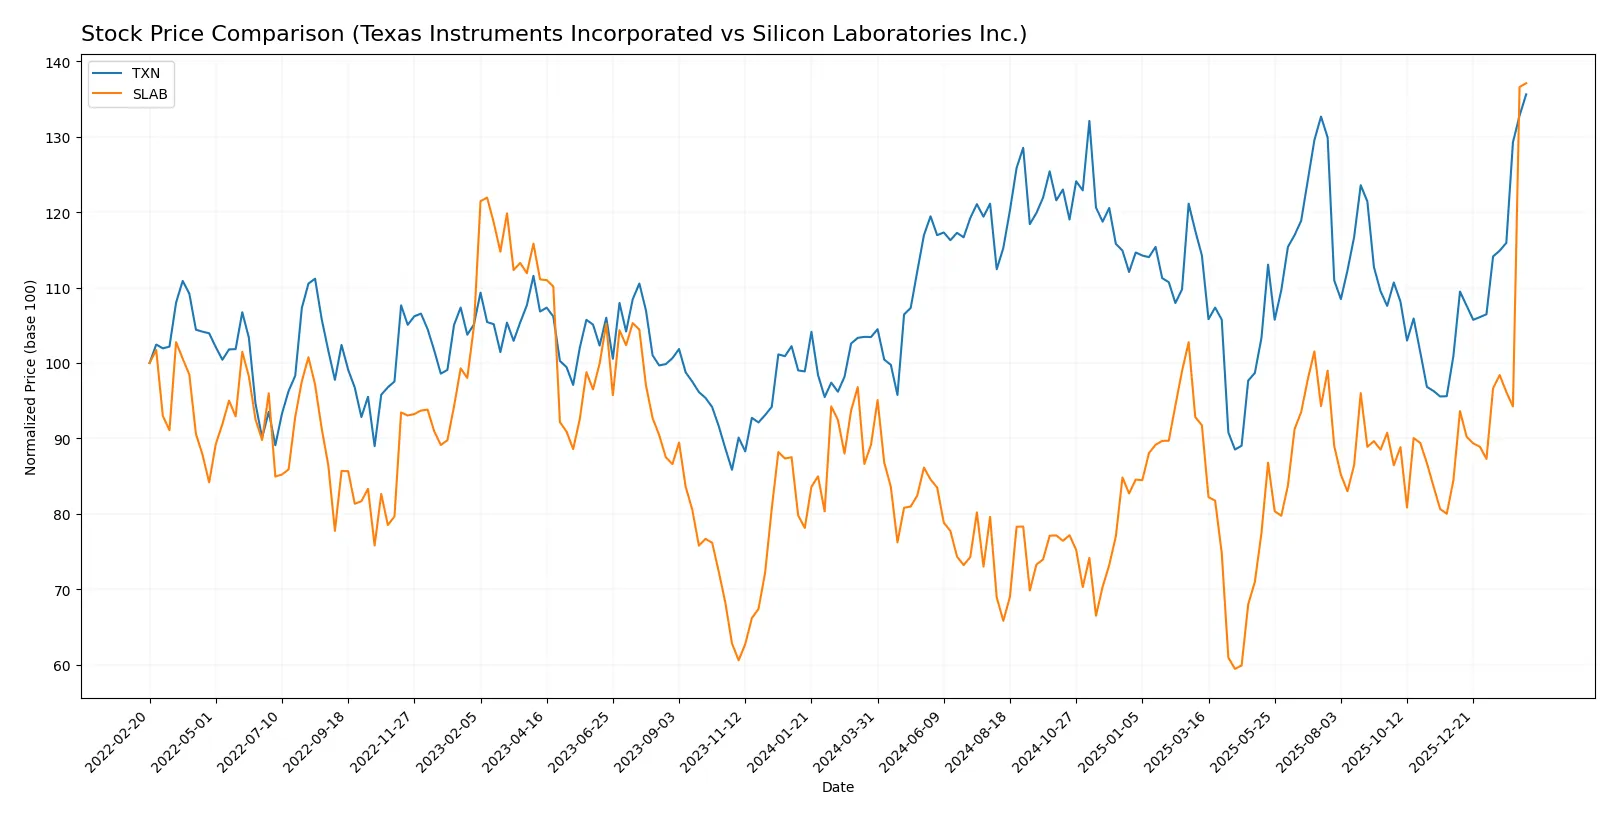
Trend Comparison
Texas Instruments posted a 31.12% price increase over 12 months, showing acceleration with a high of 226.16 and low of 147.6, supported by a 16.56 volatility measure.
Silicon Laboratories gained 53.82% over the same period, also accelerating, with a high of 207.27 and low of 89.82, and slightly higher volatility at 18.09.
Silicon Laboratories outperformed Texas Instruments, delivering the highest market return with a 53.82% gain versus 31.12%.
Target Prices
Analysts present a bullish consensus for Texas Instruments and Silicon Laboratories with solid upside potential.
| Company | Target Low | Target High | Consensus |
|---|---|---|---|
| Texas Instruments Inc. | 160 | 260 | 204.64 |
| Silicon Laboratories Inc. | 160 | 231 | 211.60 |
The consensus targets imply modest upside for Texas Instruments from its current 226.16 price, while Silicon Laboratories’ target slightly exceeds its 207.27 market price, signaling positive analyst sentiment.

Don’t Let Luck Decide Your Entry Point
Optimize your entry points with our advanced ProRealTime indicators. You’ll get efficient buy signals with precise price targets for maximum performance. Start outperforming now!
How do institutions grade them?
Texas Instruments Incorporated Grades
Here are the latest grades from reputable financial institutions for Texas Instruments Incorporated:
| Grading Company | Action | New Grade | Date |
|---|---|---|---|
| Rosenblatt | Maintain | Buy | 2026-02-05 |
| Mizuho | Maintain | Underperform | 2026-01-28 |
| Keybanc | Maintain | Overweight | 2026-01-28 |
| Goldman Sachs | Maintain | Sell | 2026-01-28 |
| B of A Securities | Upgrade | Neutral | 2026-01-28 |
| Cantor Fitzgerald | Maintain | Neutral | 2026-01-28 |
| JP Morgan | Maintain | Overweight | 2026-01-28 |
| Benchmark | Maintain | Buy | 2026-01-28 |
| Truist Securities | Maintain | Hold | 2026-01-28 |
Silicon Laboratories Inc. Grades
Below are the recent grades from established grading firms for Silicon Laboratories Inc.:
| Grading Company | Action | New Grade | Date |
|---|---|---|---|
| Citigroup | Maintain | Neutral | 2026-02-06 |
| RBC Capital | Maintain | Sector Perform | 2026-02-05 |
| Benchmark | Downgrade | Hold | 2026-02-04 |
| Needham | Downgrade | Hold | 2026-02-04 |
| Keybanc | Downgrade | Sector Weight | 2026-02-04 |
| Morgan Stanley | Maintain | Equal Weight | 2025-08-06 |
| Susquehanna | Maintain | Neutral | 2025-08-06 |
| Barclays | Maintain | Equal Weight | 2025-08-05 |
| Susquehanna | Maintain | Neutral | 2025-07-22 |
| Stifel | Maintain | Buy | 2025-07-18 |
Which company has the best grades?
Texas Instruments shows a wider range of ratings including multiple Buy and Overweight grades, indicating stronger institutional confidence. Silicon Laboratories has mostly Neutral to Hold grades with several recent downgrades, suggesting a more cautious outlook. Investors might view Texas Instruments as currently favored by analysts.
Risks specific to each company
The following categories identify critical pressure points and systemic threats facing Texas Instruments Incorporated and Silicon Laboratories Inc. in the 2026 market environment:
1. Market & Competition
Texas Instruments Incorporated
- Dominates analog and embedded processing markets with strong brand and scale. Faces competition in industrial and automotive segments.
Silicon Laboratories Inc.
- Operates in niche mixed-signal and IoT markets with less scale. Highly exposed to innovation cycles and competitive pressure.
2. Capital Structure & Debt
Texas Instruments Incorporated
- Moderate leverage (D/E 0.95), interest coverage strong at 11.52x, stable balance sheet.
Silicon Laboratories Inc.
- Virtually no debt, zero interest burden, but negative interest coverage due to losses signals financial stress.
3. Stock Volatility
Texas Instruments Incorporated
- Beta near 1.0 (0.995) indicates market-level volatility.
Silicon Laboratories Inc.
- Higher beta (1.536) suggests greater stock price swings and higher risk.
4. Regulatory & Legal
Texas Instruments Incorporated
- Subject to standard semiconductor industry regulations; stable compliance history.
Silicon Laboratories Inc.
- Faces typical fabless semiconductor regulatory risks, with additional exposure in China and international IoT regulations.
5. Supply Chain & Operations
Texas Instruments Incorporated
- Large, diversified manufacturing and distribution network reduces supply chain risks.
Silicon Laboratories Inc.
- Fabless model limits capital expenditure but increases reliance on third-party foundries, adding operational risk.
6. ESG & Climate Transition
Texas Instruments Incorporated
- Established ESG initiatives and energy-efficient product lines support climate transition.
Silicon Laboratories Inc.
- Emerging ESG focus but smaller scale may limit resources for comprehensive climate strategy.
7. Geopolitical Exposure
Texas Instruments Incorporated
- Global footprint includes exposure to US-China tensions but diversified end markets mitigate risk.
Silicon Laboratories Inc.
- Significant exposure to China and international IoT markets heightens geopolitical sensitivities.
Which company shows a better risk-adjusted profile?
Texas Instruments faces its biggest risk in valuation multiples, which appear stretched relative to fundamentals. Silicon Laboratories’ core risk is persistent negative profitability and financial weakness. Despite Silicon Labs’ higher volatility and operational risks, Texas Instruments’ strong balance sheet and robust profitability provide a safer risk-adjusted profile. Recent data shows Texas Instruments’ Altman Z-Score well within the safe zone (10.3), signaling financial resilience. Conversely, Silicon Labs suffers from negative margins and a fragile interest coverage ratio, warranting caution.
Final Verdict: Which stock to choose?
Texas Instruments Incorporated (TXN) shines as a cash-generating powerhouse with a robust economic moat. Its ability to sustain returns well above its cost of capital marks it as a value creator. However, investors should watch its gradually declining ROIC, signaling potential pressure on future profitability. TXN suits portfolios seeking steady, long-term growth with moderate risk.
Silicon Laboratories Inc. (SLAB) offers a strategic moat rooted in innovation and aggressive R&D spending, fueling rapid revenue expansion. Its asset-light model and negligible debt improve financial flexibility versus TXN. Yet, SLAB’s current value destruction and weak profitability pose significant risks. It fits investors with a high tolerance for volatility aiming for growth at a reasonable price.
If you prioritize stable value creation and proven capital efficiency, TXN is the compelling choice due to its consistent economic profits and strong cash flow. However, if you seek high-growth potential and can tolerate financial volatility, SLAB offers superior top-line acceleration and innovation-driven upside. Both present distinct analytical scenarios aligned with different investor risk profiles.
Disclaimer: Investment carries a risk of loss of initial capital. The past performance is not a reliable indicator of future results. Be sure to understand risks before making an investment decision.
Go Further
I encourage you to read the complete analyses of Texas Instruments Incorporated and Silicon Laboratories Inc. to enhance your investment decisions: