Home > Comparison > Technology > TXN vs NXPI
The strategic rivalry between Texas Instruments Incorporated and NXP Semiconductors N.V. shapes the semiconductor industry’s evolution. Texas Instruments operates as a capital-intensive analog and embedded processing powerhouse, while NXP focuses on diversified semiconductor solutions including automotive and IoT applications. This analysis contrasts their distinct operational models and growth trajectories. I aim to identify which company offers the superior risk-adjusted return for a balanced, technology-focused portfolio in 2026.
Table of contents
Companies Overview
Texas Instruments and NXP Semiconductors dominate key segments of the global semiconductor market with distinct strategic approaches.
Texas Instruments: Analog Powerhouse and Embedded Innovator
Texas Instruments leads in analog and embedded processing semiconductors, driving revenue through power management and signal conditioning products. Its broad industrial and automotive applications anchor its market position. In 2026, Texas Instruments sharpens focus on battery-management solutions and microcontrollers, reinforcing its competitive edge in efficient power and embedded systems.
NXP Semiconductors: Connectivity and Sensor Specialist
NXP Semiconductors excels in wireless connectivity and sensor technology, monetizing through microcontrollers and application processors embedded in automotive and IoT devices. The company’s 2026 strategy intensifies investment in secure communication and environmental sensing, targeting growth in automotive and IoT sectors with advanced RF and security controllers.
Strategic Collision: Analog Strength vs. Connectivity Innovation
Texas Instruments pursues a broad analog and embedded portfolio, emphasizing power efficiency and industrial reliability. NXP adopts a more connectivity-centric and sensor-driven model, focusing on secure IoT and automotive applications. Their primary battleground lies in automotive and industrial markets, where analog meets sensor innovation. Investors face contrasting profiles: Texas Instruments offers mature analog leadership, while NXP bets on growth through connectivity and security advances.
Income Statement Comparison
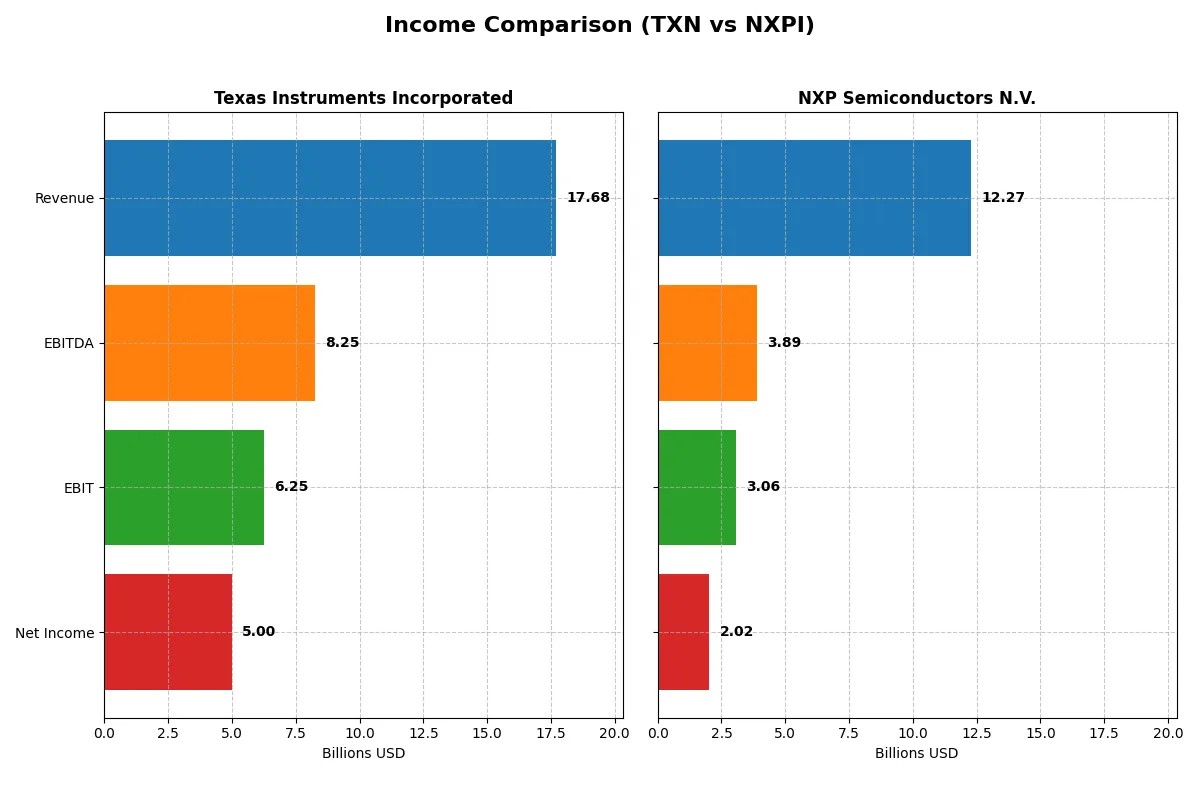
This data dissects the core profitability and scalability of both corporate engines to reveal who dominates the bottom line:
| Metric | Texas Instruments Inc. (TXN) | NXP Semiconductors N.V. (NXPI) |
|---|---|---|
| Revenue | 17.7B | 12.3B |
| Cost of Revenue | 7.6B | 5.6B |
| Operating Expenses | 4.1B | 3.4B |
| Gross Profit | 10.1B | 6.7B |
| EBITDA | 8.3B | 3.9B |
| EBIT | 6.3B | 3.1B |
| Interest Expense | 543M | 384M |
| Net Income | 5.0B | 2.0B |
| EPS | 5.45 | 8.00 |
| Fiscal Year | 2025 | 2025 |
Income Statement Analysis: The Bottom-Line Duel
This income statement comparison reveals each company’s efficiency and profitability engine through key revenue and margin trends.
Texas Instruments Incorporated Analysis
Texas Instruments shows a mixed revenue trajectory, dropping overall by 3.6% from 2021 to 2025, yet growing 13% in the last year. Net income fell sharply by 35.6% over five years but edged up 4.8% last year. Margins remain robust with a 57% gross margin and a strong 28% net margin, underscoring efficient cost control and solid profitability momentum in 2025.
NXP Semiconductors N.V. Analysis
NXP’s revenue rose 10.9% over five years but declined 2.7% in the last year, reflecting recent headwinds. Net income increased 8% overall but contracted 18% last year. Its gross margin at 54% and net margin at 16% are healthy but notably thinner than Texas Instruments’, indicating less pricing power or higher expenses. The 2025 results suggest some loss of momentum after steady growth.
Margin Strength vs. Growth Resilience
Texas Instruments delivers superior margin strength and recent profitability momentum despite longer-term declines. NXP excels in overall revenue and net income growth but faces near-term margin pressure. For investors prioritizing margin durability, Texas Instruments leads; those focused on growth may find NXP’s profile more appealing, though with higher volatility.
Financial Ratios Comparison
These vital ratios act as a diagnostic tool to expose the underlying fiscal health, valuation premiums, and capital efficiency of the companies compared below:
| Ratios | Texas Instruments (TXN) | NXP Semiconductors (NXPI) |
|---|---|---|
| ROE | 30.7% | 20.1% |
| ROIC | 16.5% | 11.0% |
| P/E | 31.5 | 27.1 |
| P/B | 9.69 | 5.45 |
| Current Ratio | 4.35 | 2.05 |
| Quick Ratio | 2.83 | 1.38 |
| D/E | 0.86 | 1.22 |
| Debt-to-Assets | 40.6% | 46.0% |
| Interest Coverage | 11.1 | 8.62 |
| Asset Turnover | 0.51 | 0.46 |
| Fixed Asset Turnover | 1.44 | 4.12 |
| Payout Ratio | 99.96% | 50.7% |
| Dividend Yield | 3.17% | 1.87% |
| Fiscal Year | 2025 | 2025 |
Efficiency & Valuation Duel: The Vital Signs
Ratios act as a company’s DNA, revealing hidden operational strengths and risks that financial statements alone often conceal.
Texas Instruments Incorporated
Texas Instruments posts a robust 30.7% ROE and a strong 28.3% net margin, signaling solid profitability. Its P/E of 31.5 and P/B of 9.7 suggest an expensive valuation. The firm offers a healthy 3.17% dividend yield, rewarding shareholders while maintaining steady reinvestment in R&D at 11.8% of revenue.
NXP Semiconductors N.V.
NXP Semiconductors delivers a respectable 20.1% ROE and a 16.5% net margin, reflecting decent profitability but notably below Texas Instruments. Its valuation is less stretched, with a P/E of 27.1 and P/B of 5.5. NXP yields 1.87%, indicating moderate shareholder returns amid significant R&D investment at 18.3% of sales.
Premium Valuation vs. Balanced Efficiency
Texas Instruments commands a premium valuation with superior returns, but at a higher price and leverage. NXP offers a more balanced valuation and greater R&D emphasis but lower profitability. Risk-tolerant investors may lean toward Texas Instruments’ yield and efficiency, while growth-focused investors might prefer NXP’s innovation investment profile.
Which one offers the Superior Shareholder Reward?
I see Texas Instruments (TXN) delivers a higher dividend yield around 3.17% with nearly full payout coverage, signaling strong FCF reliability. NXP (NXPI) pays a lower yield near 1.87%, with a modest 50% payout ratio, preserving cash for growth. TXN’s buyback activity is robust, enhancing total returns, while NXPI focuses more on reinvestment given its lower dividend and higher capex coverage. Historically, TXN’s generous distributions and sustainable cash flow underpin a superior total return profile. I conclude TXN offers a more attractive shareholder reward in 2026.
Comparative Score Analysis: The Strategic Profile
The radar chart reveals the fundamental DNA and trade-offs of Texas Instruments and NXP Semiconductors, highlighting their core financial strengths and weaknesses:
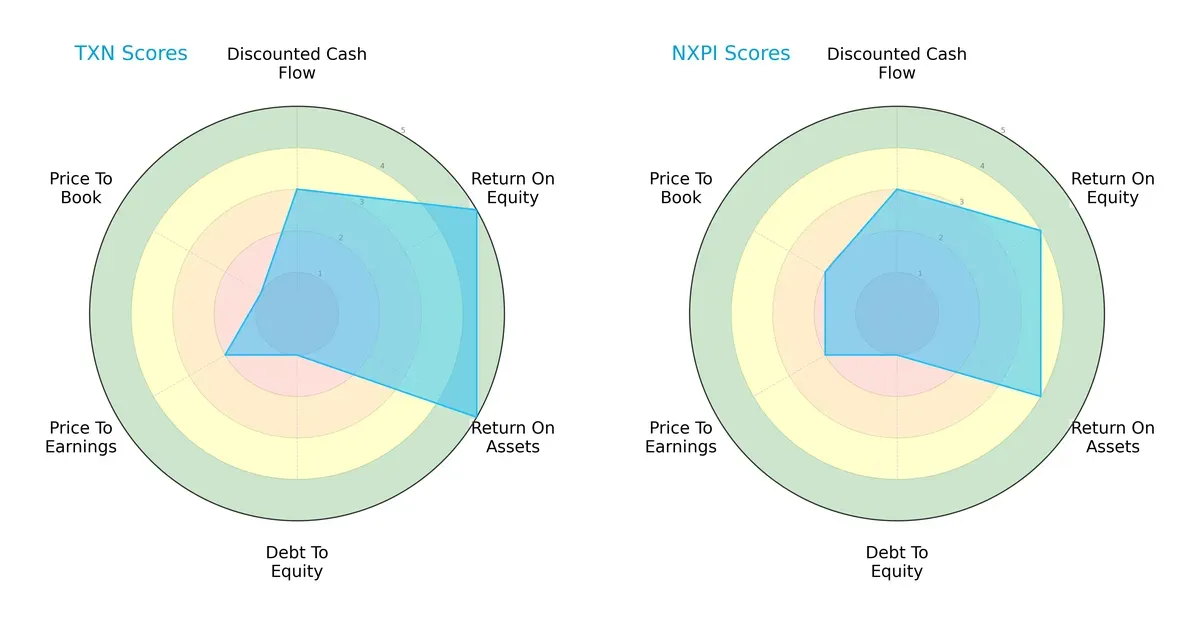
Texas Instruments leads with superior profitability metrics, scoring 5 in ROE and ROA compared to NXP’s 4, signaling more efficient capital and asset use. Both firms share moderate DCF and P/E scores (3 and 2 respectively), but Texas Instruments’ valuation is less attractive with a very unfavorable P/B score of 1 versus NXP’s moderate 2. Debt levels are equally concerning, with both scoring very unfavorable 1 in Debt/Equity. Overall, Texas Instruments shows a more balanced profitability profile, while NXP leans on moderate valuation metrics.
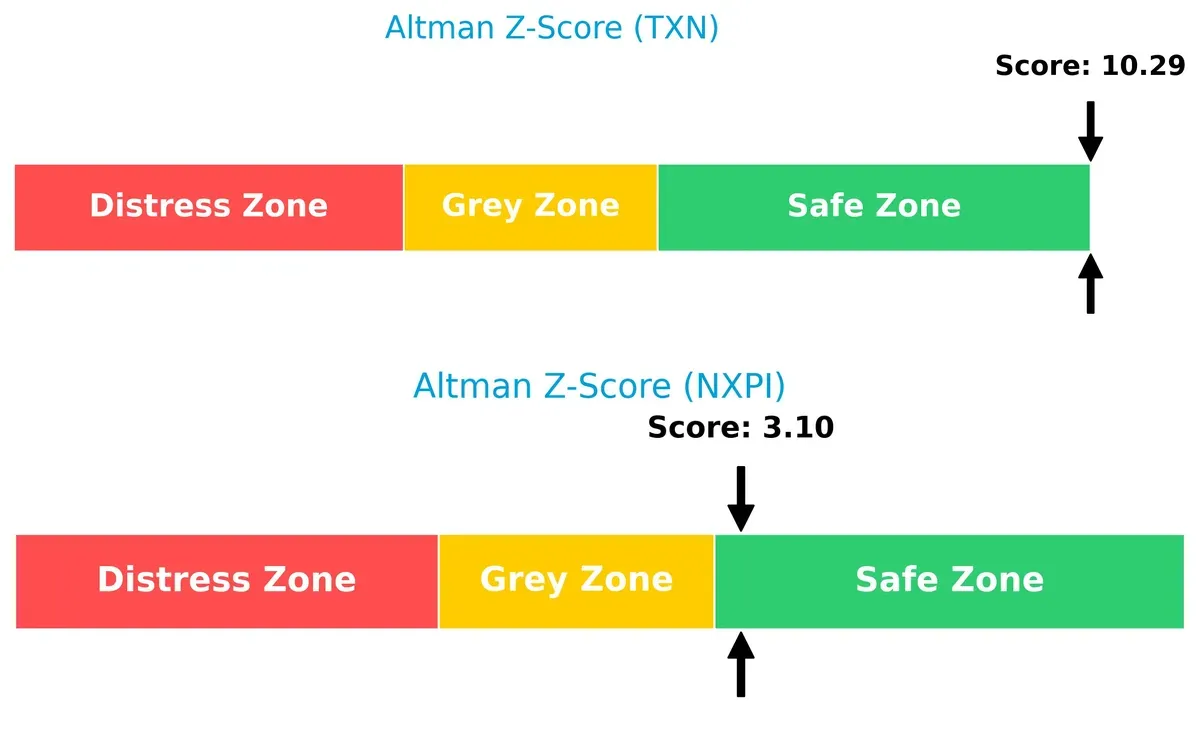
Bankruptcy Risk: Solvency Showdown
Texas Instruments’ Altman Z-Score of 10.3 far exceeds NXP’s 3.1, placing it deep in the safe zone. This gap implies Texas Instruments has a much stronger buffer against bankruptcy risk in the current cycle:
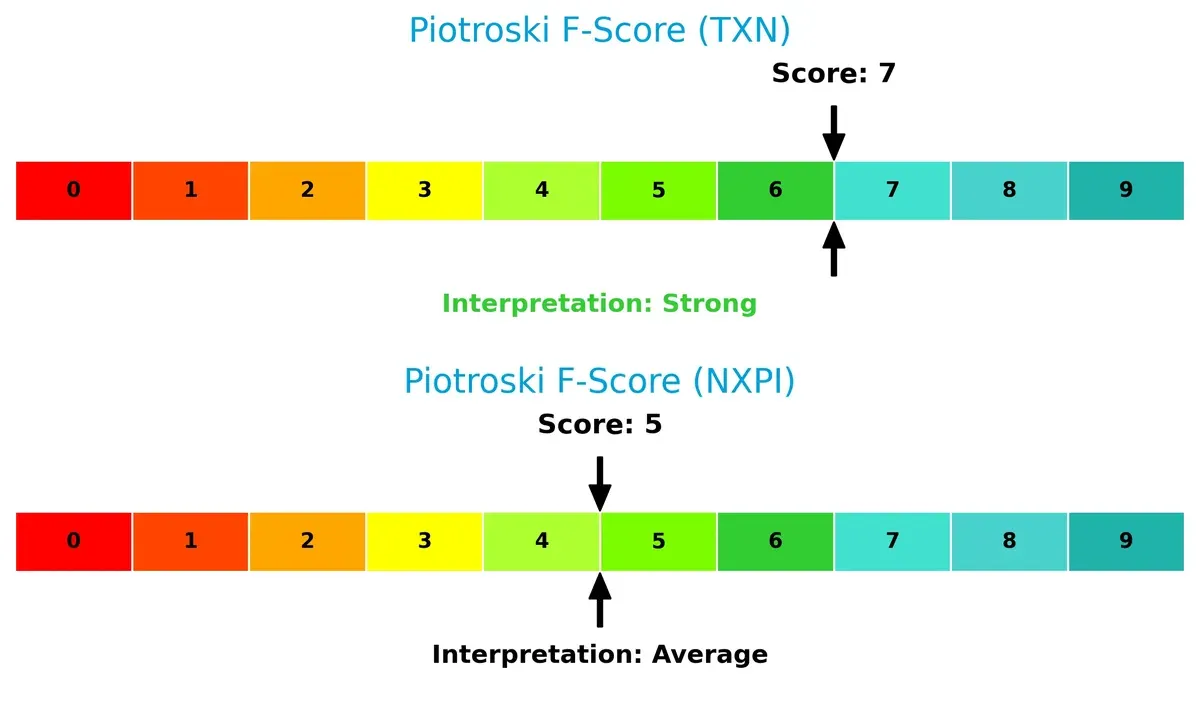
Financial Health: Quality of Operations
Texas Instruments scores a robust 7 on the Piotroski F-Score, indicating strong operational quality. NXP’s 5 suggests average financial health with potential internal red flags compared to Texas Instruments’ superior score:
How are the two companies positioned?
This section dissects the operational DNA of TXN and NXPI by comparing their revenue distribution by segment and internal dynamics. The goal is to confront their economic moats to identify which model offers the most resilient and sustainable advantage today.
Revenue Segmentation: The Strategic Mix
This visual comparison dissects how Texas Instruments and NXP Semiconductors diversify their income streams and reveals where their primary sector bets lie:
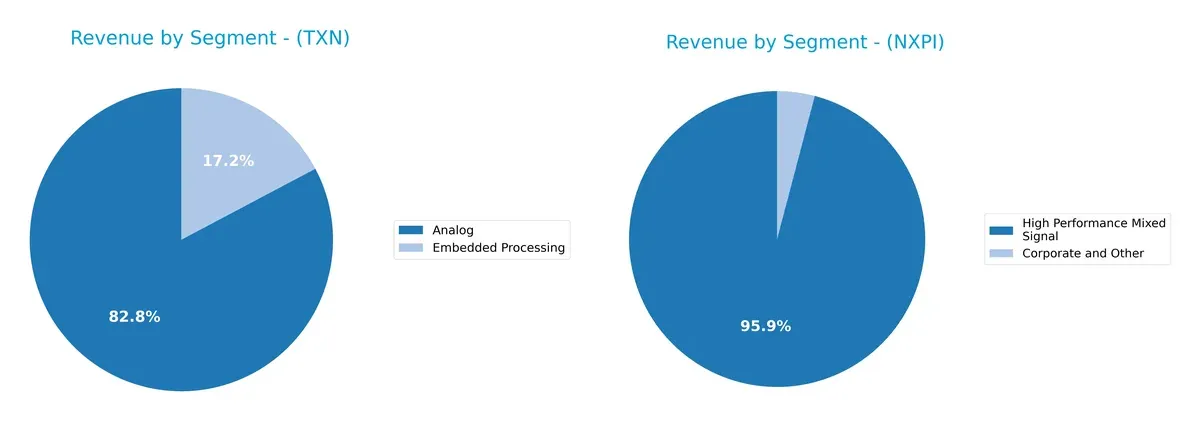
Texas Instruments anchors its revenue heavily in Analog, with $12.2B in 2024, supported by $2.5B in Embedded Processing. This mix shows moderate diversification but a strong reliance on Analog’s ecosystem lock-in. NXP Semiconductors pivots almost entirely on High Performance Mixed Signal, generating $9B in 2018, with a smaller Standard Products segment. NXP’s concentration signals infrastructure dominance but also heightens concentration risk compared to Texas Instruments’ broader base.
Strengths and Weaknesses Comparison
This table compares the Strengths and Weaknesses of Texas Instruments (TXN) and NXP Semiconductors (NXPI):
TXN Strengths
- Higher net margin at 28.28%
- Superior ROE of 30.73%
- Favorable ROIC at 16.52%
- Strong quick ratio of 2.83
- Well-diversified revenue segments including Analog and Embedded Processing
- Significant global presence with large US and Asia sales
NXPI Strengths
- Favorable net margin at 16.47%
- Solid ROE of 20.1%
- Favorable ROIC of 11.03%
- Strong current and quick ratios (2.05 and 1.38)
- High fixed asset turnover at 4.12
- Balanced geographic exposure across China, US, and Europe
TXN Weaknesses
- Unfavorable P/E (31.53) and P/B (9.69) ratios suggest overvaluation
- Very high current ratio (4.35) may indicate inefficient asset use
- Moderate debt levels (debt/equity 0.86)
- Asset turnover moderate at 0.51
NXPI Weaknesses
- Unfavorable P/E (27.14) and P/B (5.45) ratios indicate valuation concerns
- Higher debt/equity ratio at 1.22 signals stronger leverage
- Asset turnover low at 0.46
- Dividend yield neutral at 1.87%
Both companies show favorable profitability and global diversification. TXN excels in profitability metrics but faces valuation and liquidity efficiency challenges. NXPI maintains balanced financial health with higher leverage and lower asset efficiency. These factors highlight differing strategic priorities in financial and operational management.
The Moat Duel: Analyzing Competitive Defensibility
A structural moat is the sole shield protecting long-term profits from relentless competitive erosion. Let’s dissect the moats of Texas Instruments and NXP Semiconductors:
Texas Instruments Incorporated: Intangible Assets & Cost Advantage
Texas Instruments relies on a potent combination of intangible assets and cost advantage. Its 57% gross margin and 35% EBIT margin reflect operational efficiency and pricing power. However, its declining ROIC trend warns of emerging challenges in sustaining profitability through 2026.
NXP Semiconductors N.V.: Innovation-Driven Niche Focus
NXP’s moat stems from innovation in automotive and IoT semiconductors, differentiating it from Texas Instruments’ broader analog portfolio. Despite a lower 25% EBIT margin and negative ROIC spread, NXP’s expanding revenue base signals potential for market disruption and future moat expansion.
Economic Moats in Focus: Value Creation vs. Market Innovation
Texas Instruments holds a wider moat with a ROIC comfortably above WACC, signaling value creation despite profitability pressures. NXP’s moat is narrower, with value erosion risks but upside from niche innovation. Texas Instruments better defends its market share today, though NXP’s growth could reshape the competitive landscape.
Which stock offers better returns?
Stock prices of Texas Instruments and NXP Semiconductors show contrasting movements over the past year, reflecting divergent trading dynamics and investor sentiment.
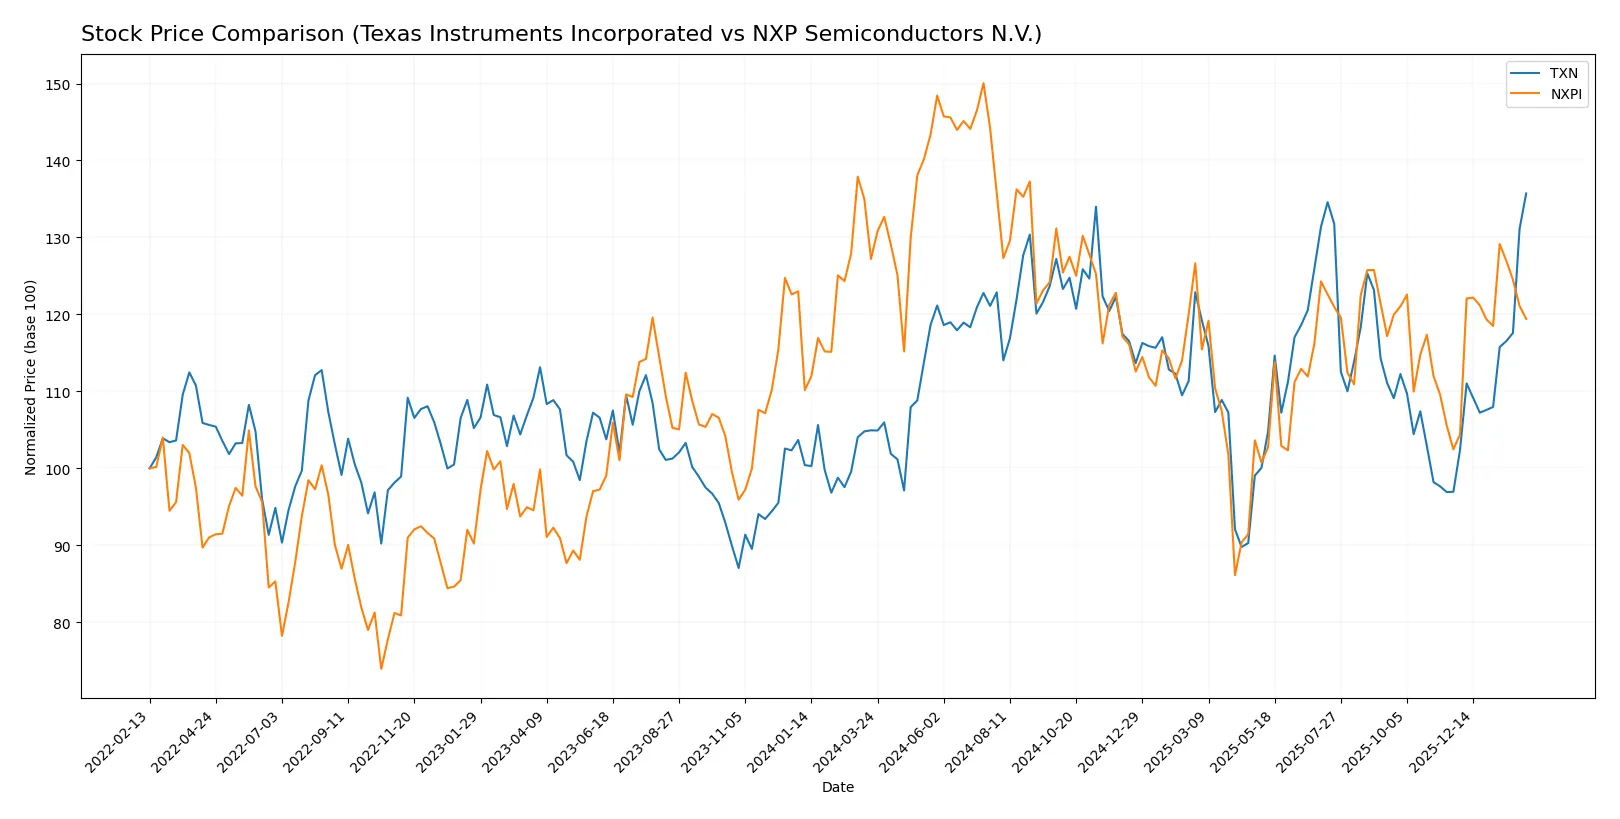
Trend Comparison
Texas Instruments’ stock price rose 29.32% over the past 12 months, marking a bullish trend with accelerating gains and a high near 223.11. Volatility measured by a 16.23 standard deviation supports dynamic price movement.
NXP Semiconductors declined 6.11% over the same period, reflecting a bearish trend despite accelerating price action. Its higher volatility, with a 24.1 standard deviation, indicates greater price fluctuations.
Texas Instruments outperformed NXP, delivering the highest market returns with a strong bullish trend versus NXP’s bearish trajectory over the past year.
Target Prices
Analysts show a positive outlook for Texas Instruments and NXP Semiconductors, with moderate upside potential.
| Company | Target Low | Target High | Consensus |
|---|---|---|---|
| Texas Instruments Incorporated | 160 | 260 | 204.64 |
| NXP Semiconductors N.V. | 215 | 280 | 250 |
The consensus target for Texas Instruments is slightly below its current price of 221, suggesting limited near-term upside. NXP’s target consensus of 250 offers about 13% potential above its current price of 222, indicating stronger growth expectations.

Don’t Let Luck Decide Your Entry Point
Optimize your entry points with our advanced ProRealTime indicators. You’ll get efficient buy signals with precise price targets for maximum performance. Start outperforming now!
How do institutions grade them?
Texas Instruments Incorporated Grades
Below is a summary of recent institutional grades for Texas Instruments Incorporated:
| Grading Company | Action | New Grade | Date |
|---|---|---|---|
| Jefferies | Maintain | Hold | 2026-01-28 |
| Cantor Fitzgerald | Maintain | Neutral | 2026-01-28 |
| Goldman Sachs | Maintain | Sell | 2026-01-28 |
| Truist Securities | Maintain | Hold | 2026-01-28 |
| Deutsche Bank | Maintain | Hold | 2026-01-28 |
| Stifel | Maintain | Hold | 2026-01-28 |
| UBS | Maintain | Buy | 2026-01-28 |
| B of A Securities | Upgrade | Neutral | 2026-01-28 |
| Wells Fargo | Maintain | Equal Weight | 2026-01-28 |
| JP Morgan | Maintain | Overweight | 2026-01-28 |
NXP Semiconductors N.V. Grades
These are the latest institutional grades for NXP Semiconductors N.V.:
| Grading Company | Action | New Grade | Date |
|---|---|---|---|
| Evercore ISI Group | Maintain | Outperform | 2026-02-04 |
| B of A Securities | Maintain | Buy | 2026-02-04 |
| Truist Securities | Maintain | Buy | 2026-02-04 |
| Mizuho | Maintain | Outperform | 2026-02-04 |
| Citigroup | Maintain | Buy | 2026-02-04 |
| JP Morgan | Maintain | Neutral | 2026-02-04 |
| Needham | Maintain | Buy | 2026-02-03 |
| Citigroup | Maintain | Buy | 2026-01-15 |
| Wells Fargo | Maintain | Overweight | 2026-01-15 |
| Truist Securities | Maintain | Buy | 2025-12-19 |
Which company has the best grades?
NXP Semiconductors holds generally stronger and more consistent buy/outperform ratings than Texas Instruments. This suggests more institutional confidence in NXP’s near-term growth potential, which may influence investor sentiment and valuation trends.
Risks specific to each company
The following categories identify the critical pressure points and systemic threats facing both firms in the 2026 market environment:
1. Market & Competition
Texas Instruments Incorporated
- Strong analog and embedded processing segments support leadership but face intense semiconductor competition.
NXP Semiconductors N.V.
- Broad product portfolio in automotive and IoT markets faces fierce rivalry and rapid technological shifts.
2. Capital Structure & Debt
Texas Instruments Incorporated
- Moderate debt-to-equity (0.86) with strong interest coverage (11.52) signals manageable leverage risk.
NXP Semiconductors N.V.
- Higher debt-to-equity (1.22) raises financial risk despite adequate interest coverage (7.97).
3. Stock Volatility
Texas Instruments Incorporated
- Beta near 1 (0.995) indicates stock moves roughly with the market, implying moderate volatility.
NXP Semiconductors N.V.
- Higher beta (1.458) suggests greater stock price swings and market sensitivity.
4. Regulatory & Legal
Texas Instruments Incorporated
- US-based with exposure to evolving semiconductor export controls and IP regulations.
NXP Semiconductors N.V.
- European-headquartered with global operations, facing complex regulatory landscapes including EU and US trade policies.
5. Supply Chain & Operations
Texas Instruments Incorporated
- Direct sales model mitigates distributor dependency but global supply chain risks persist.
NXP Semiconductors N.V.
- Diverse international footprint increases supply chain complexity and vulnerability to geopolitical disruptions.
6. ESG & Climate Transition
Texas Instruments Incorporated
- Growing ESG initiatives needed to address energy-intensive manufacturing impacts.
NXP Semiconductors N.V.
- Greater pressure to align with EU climate directives and sustainability standards.
7. Geopolitical Exposure
Texas Instruments Incorporated
- US-China tensions impact exports, but domestic base offers some geopolitical insulation.
NXP Semiconductors N.V.
- Exposure to multiple countries including China and Europe heightens geopolitical risk.
Which company shows a better risk-adjusted profile?
Texas Instruments faces its largest risk in market competition amid semiconductor cycles but benefits from a robust balance sheet and moderate volatility. NXP’s biggest risk lies in higher leverage and complex geopolitical exposure, compounded by greater stock volatility. TI’s stronger interest coverage and safer Altman Z-score bolster its risk-adjusted profile. Recent data show TI’s conservative current ratio contrasts with NXP’s higher debt, justifying prudence on NXP’s financial leverage. Overall, Texas Instruments demonstrates a better risk-adjusted position in today’s challenging semiconductor landscape.
Final Verdict: Which stock to choose?
Texas Instruments stands out as a cash-generating powerhouse with a robust moat, consistently creating value above its cost of capital. Its point of vigilance lies in a declining ROIC trend and stretched valuation metrics. It suits investors aiming for aggressive growth with a tolerance for premium pricing risk.
NXP Semiconductors leverages a strategic moat through deep R&D investment and a strong foothold in automotive and industrial markets. It offers relative safety with a more moderate valuation and solid free cash flow yield, fitting well in portfolios seeking growth at a reasonable price with a focus on stability.
If you prioritize uncompromising value creation and long-term aggressive growth, Texas Instruments is the compelling choice due to its superior profitability and market leadership. However, if you seek a more balanced risk profile with steady innovation and reasonable valuation, NXP Semiconductors offers better stability and growth potential. Both have merits, but their appeal depends on your appetite for risk and growth horizon.
Disclaimer: Investment carries a risk of loss of initial capital. The past performance is not a reliable indicator of future results. Be sure to understand risks before making an investment decision.
Go Further
I encourage you to read the complete analyses of Texas Instruments Incorporated and NXP Semiconductors N.V. to enhance your investment decisions: