Home > Comparison > Technology > TXN vs MCHP
The strategic rivalry between Texas Instruments Incorporated and Microchip Technology Incorporated shapes the semiconductor industry’s evolution. Texas Instruments operates as a diversified analog and embedded processing powerhouse, while Microchip Technology focuses on embedded control solutions and specialized microcontrollers. This head-to-head reflects a contrast between broad-based industrial scale and targeted innovation. This analysis aims to identify which trajectory offers superior risk-adjusted returns for a diversified portfolio in the fast-evolving technology sector.
Table of contents
Companies Overview
Texas Instruments and Microchip Technology dominate key segments of the semiconductor industry with distinct strategic approaches.
Texas Instruments Incorporated: Analog and Embedded Processing Leader
Texas Instruments drives revenue primarily through its Analog and Embedded Processing segments, supplying power management and microcontroller products globally. Its strategy in 2026 emphasizes expanding industrial and automotive markets while leveraging robust direct sales and distributor networks. The company’s focus on high-margin analog solutions secures its competitive edge in semiconductors.
Microchip Technology Incorporated: Embedded Control Innovator
Microchip Technology specializes in embedded control solutions, offering diverse microcontrollers, analog, and memory products worldwide. Its 2026 strategy revolves around enhancing smart, connected devices with secure and programmable microcontrollers, targeting automotive, industrial, and communications sectors. The company’s broad product portfolio and licensing technologies underscore its growth ambitions.
Strategic Collision: Similarities & Divergences
Both companies prioritize embedded systems but differ in scope; Texas Instruments leads with analog dominance, while Microchip champions programmable microcontrollers. Their battle for industrial and automotive market share highlights contrasting philosophies: Texas Instruments’ closed ecosystem versus Microchip’s flexible, license-driven model. This divergence defines their unique risk and growth profiles for investors.
Income Statement Comparison
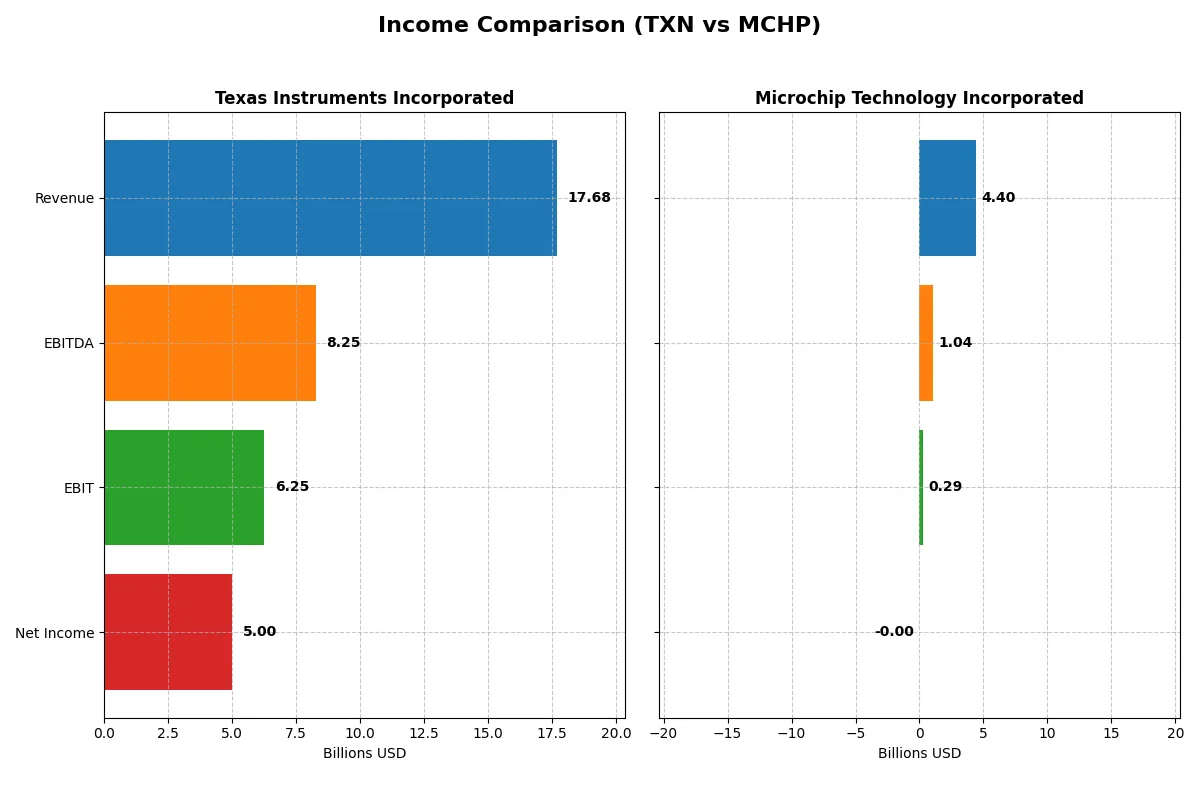
This data dissects the core profitability and scalability of both corporate engines to reveal who dominates the bottom line:
| Metric | Texas Instruments Incorporated (TXN) | Microchip Technology Incorporated (MCHP) |
|---|---|---|
| Revenue | 17.7B | 4.4B |
| Cost of Revenue | 7.6B | 1.9B |
| Operating Expenses | 4.1B | 2.2B |
| Gross Profit | 10.1B | 2.5B |
| EBITDA | 8.3B | 1.0B |
| EBIT | 6.3B | 0.3B |
| Interest Expense | 0.5B | 0.3B |
| Net Income | 5.0B | -0.5M |
| EPS | 5.45 | -0.005 |
| Fiscal Year | 2025 | 2025 |
Income Statement Analysis: The Bottom-Line Duel
This income statement comparison reveals which company drives profitability and efficiency through its core operations.
Texas Instruments Incorporated Analysis
Texas Instruments (TXN) shows a mixed revenue trajectory, peaking at $20B in 2022 before settling at $17.7B in 2025. Despite a 13% revenue growth in the last year, net income declined overall by 36%. TXN sustains robust margins with a gross margin of 57% and net margin near 28%, reflecting efficient cost control and stable earnings quality in 2025.
Microchip Technology Incorporated Analysis
Microchip Technology (MCHP) reveals a steep revenue drop from $8.4B in 2023 to $4.4B in 2025, with net income turning negative last year. Its gross margin remains solid at 56%, but net margin falls to nearly zero, highlighting margin compression and operational challenges. The sharp decline in EBIT and net income signals deteriorating profitability and momentum.
Margin Power vs. Revenue Scale
TXN outperforms MCHP by maintaining strong margins and positive net income despite moderate revenue volatility. MCHP struggles with a collapsing top line and negative bottom line, eroding investor confidence. TXN’s profile suits those favoring resilient profit generation; MCHP’s volatile performance suggests higher risk and uncertainty.
Financial Ratios Comparison
These vital ratios act as a diagnostic tool to expose the underlying fiscal health, valuation premiums, and capital efficiency of the two companies:
| Ratios | Texas Instruments (TXN) | Microchip Technology (MCHP) |
|---|---|---|
| ROE | 30.7% | -0.01% |
| ROIC | 16.5% | -0.03% |
| P/E | 31.5 | -52,021 |
| P/B | 9.69 | 3.67 |
| Current Ratio | 4.35 | 2.59 |
| Quick Ratio | 2.83 | 1.47 |
| D/E (Debt to Equity) | 0.86 | 0.80 |
| Debt-to-Assets | 40.6% | 36.9% |
| Interest Coverage | 11.1 | 1.18 |
| Asset Turnover | 0.51 | 0.29 |
| Fixed Asset Turnover | 1.44 | 3.72 |
| Payout Ratio | 100.0% | -1951.4% |
| Dividend Yield | 3.17% | 3.75% |
| Fiscal Year | 2025 | 2025 |
Efficiency & Valuation Duel: The Vital Signs
Financial ratios act as the company’s DNA, revealing hidden risks and operational excellence behind headline numbers.
Texas Instruments Incorporated
Texas Instruments displays robust profitability with a 30.7% ROE and a strong 28.3% net margin, signaling operational efficiency. Its valuation appears stretched with a high P/E of 31.5 and P/B near 9.7. The company rewards shareholders with a 3.17% dividend yield, balancing capital allocation between steady income and R&D investment.
Microchip Technology Incorporated
Microchip suffers from unfavorable profitability, posting negative net margin and ROE, indicating operational challenges. Despite a distorted P/E due to losses, its P/B of 3.7 is reasonable. The firm maintains a 3.75% dividend yield but struggles with low interest coverage and weak asset turnover, reflecting financial and operational stress.
Premium Valuation vs. Operational Safety
Texas Instruments commands a premium valuation supported by strong profitability and shareholder returns. Microchip’s weaker returns and financial stress pose higher risk. Investors seeking operational resilience and steady dividends may prefer Texas Instruments, while Microchip fits those willing to tolerate volatility for potential turnaround gains.
Which one offers the Superior Shareholder Reward?
I observe Texas Instruments (TXN) delivers a more sustainable shareholder reward than Microchip Technology (MCHP) in 2026. TXN’s dividend yield hovers around 3.17% with near 100% payout, supported by solid free cash flow (FCF) coverage of 0.36x. Its consistent buybacks amplify returns, balancing capital return and reinvestment. In contrast, MCHP offers a higher 3.75% dividend yield but reports negative net margins and erratic profitability, casting doubt on dividend sustainability. MCHP’s buyback program is less reliable amid financial leverage near 2.17x and weaker operating cash flow ratios. Historically in semiconductors, TXN’s disciplined capital allocation and robust margins translate into steadier total returns. Hence, I favor TXN for superior total shareholder return and risk-managed income in 2026.
Comparative Score Analysis: The Strategic Profile
The radar chart reveals the fundamental DNA and trade-offs of Texas Instruments and Microchip Technology in key financial dimensions:
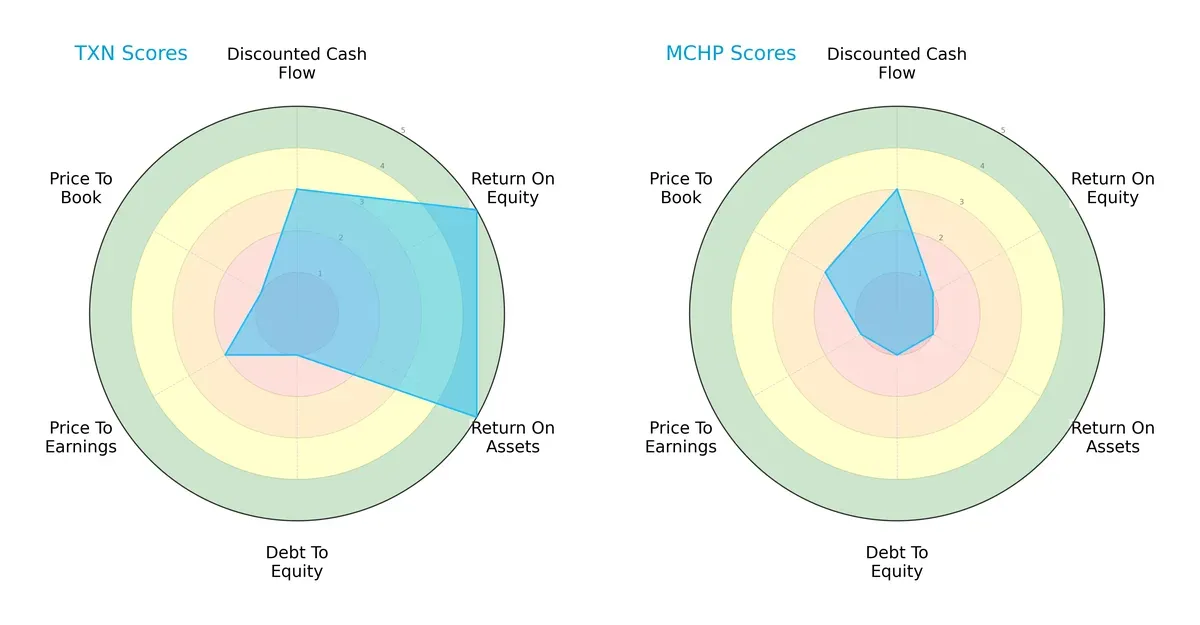
Texas Instruments dominates in profitability with top ROE and ROA scores (5 each) versus Microchip’s weak 1s. Both share a low debt-to-equity score of 1, signaling high leverage risk. Texas Instruments shows a more balanced profile, blending strong returns with moderate DCF and P/E valuations. Microchip relies heavily on a neutral DCF score but suffers across profitability and valuation metrics, indicating strategic vulnerabilities.
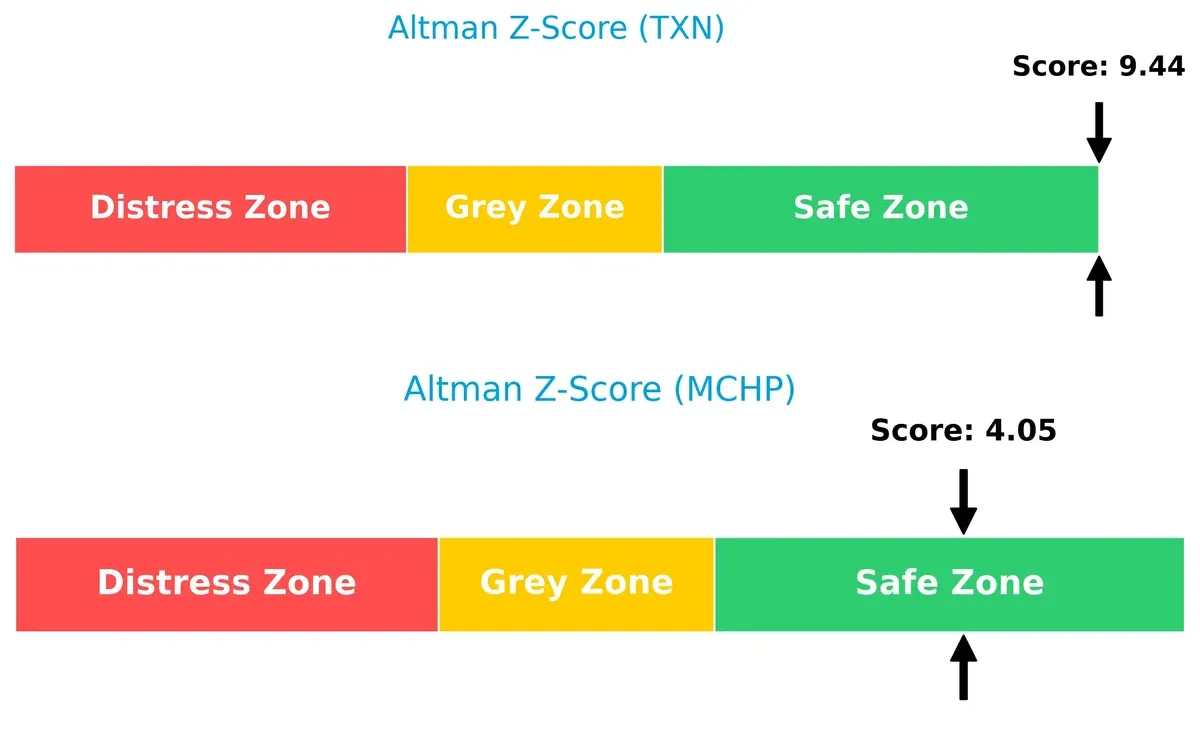
Bankruptcy Risk: Solvency Showdown
Texas Instruments’ Altman Z-score of 9.44 far outpaces Microchip’s 4.05, placing both in the safe zone but highlighting Texas Instruments’ superior financial resilience in this cycle:
Financial Health: Quality of Operations
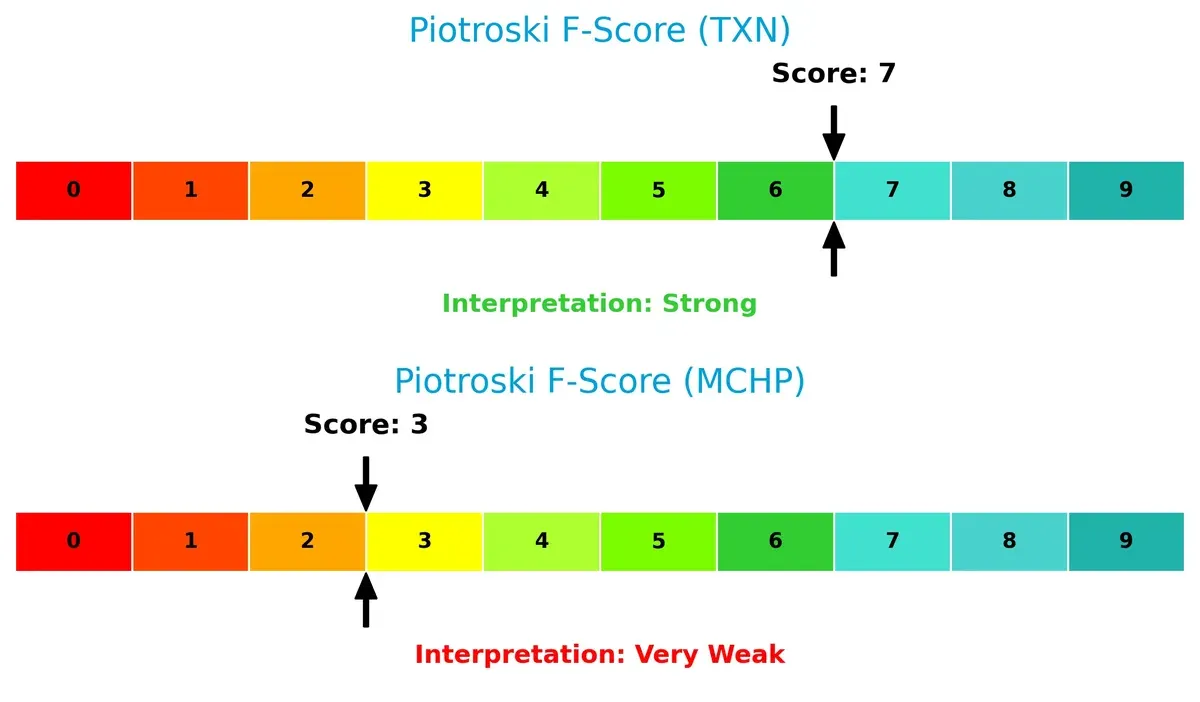
Texas Instruments scores a robust 7 on the Piotroski F-Score, indicating strong operational health. Microchip’s 3 signals red flags across internal financial metrics:
How are the two companies positioned?
This section dissects the operational DNA of Texas Instruments and Microchip by comparing their revenue distribution by segment and internal dynamics. The final objective is to confront their economic moats to reveal which business model delivers the most resilient competitive advantage in today’s market.
Revenue Segmentation: The Strategic Mix
This comparison dissects how Texas Instruments and Microchip Technology diversify their income streams and highlights their primary sector bets:
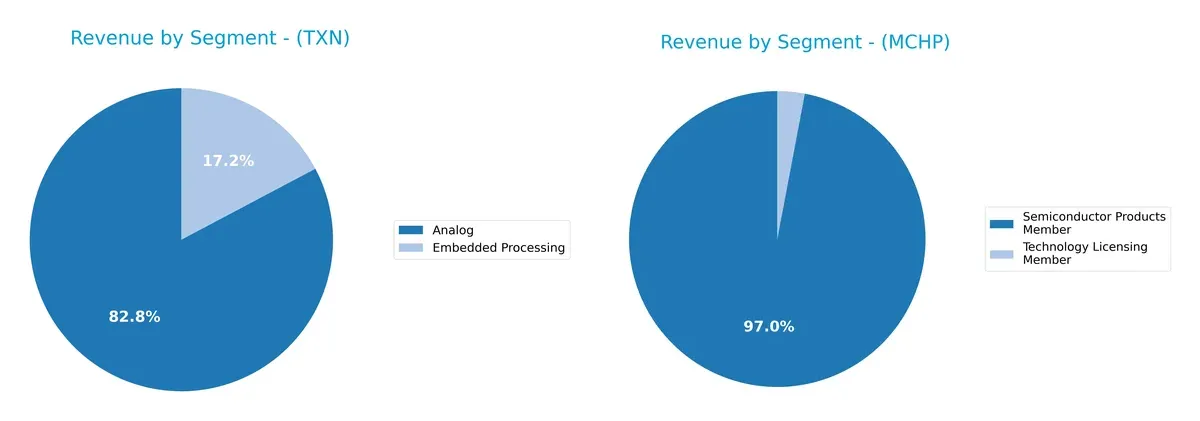
Texas Instruments relies heavily on its Analog segment, which dwarfs Embedded Processing with $12.2B in 2024. This concentration anchors TI’s stronghold in analog infrastructure. Microchip Technology’s revenue, dominated by Semiconductor Products at $7.5B, shows less diversification, with minimal licensing income. TI’s more balanced mix mitigates concentration risk, while Microchip’s focus pivots on semiconductor sales, exposing it to cyclical semiconductor demand swings.
Strengths and Weaknesses Comparison
This table compares the strengths and weaknesses of Texas Instruments and Microchip Technology based on diversification, profitability, financials, innovation, global presence, and market share:
Texas Instruments Strengths
- High net margin (28.28%) and ROE (30.73%) indicate strong profitability
- Favorable quick ratio (2.83) supports liquidity
- Diverse revenue segments including Analog and Embedded Processing
- Global sales spread across US, China, EMEA, and Asia
- Attractive dividend yield (3.17%) enhances shareholder value
Microchip Technology Strengths
- Favorable PE due to negative earnings, suggesting market growth expectations
- Strong fixed asset turnover (3.72) reflects efficient asset use
- Favorable current (2.59) and quick ratios (1.47) indicate solid short-term liquidity
- Steady dividend yield (3.75%) supports income investors
- Revenue driven by Semiconductor Products and Technology Licensing
Texas Instruments Weaknesses
- Unfavorable PE (31.53) and PB (9.69) imply overvaluation concerns
- High current ratio (4.35) may indicate inefficient asset management
- Neutral debt-to-equity (0.86) and debt-to-assets (40.62%) could limit flexibility
- Asset turnover is moderate (0.51), suggesting room for operational improvement
Microchip Technology Weaknesses
- Negative profitability metrics: net margin (-0.01%), ROE (-0.01%), ROIC (-0.03%)
- Unfavorable interest coverage (1.15) signals vulnerability to rising debt costs
- Low asset turnover (0.29) highlights operational inefficiency
- Unfavorable PB ratio (3.67) may reflect market skepticism
Overall, Texas Instruments exhibits robust profitability and global diversification but faces valuation and efficiency challenges. Microchip Technology shows liquidity and asset efficiency strengths but struggles with profitability and debt service capacity. These contrasts impact their strategic priorities around operational improvements and financial health management.
The Moat Duel: Analyzing Competitive Defensibility
A structural moat alone shields long-term profits from relentless competitive erosion. Let’s dissect how Texas Instruments and Microchip defend their turf:
Texas Instruments Incorporated: Intangible Assets Powerhouse
Texas Instruments leverages deep intangible assets and scale to sustain high ROIC, showing margin stability near 35%. Its broad analog and embedded processing portfolio strengthens its moat. New product innovation and expanding industrial applications should deepen this advantage in 2026.
Microchip Technology Incorporated: Cost Advantage Struggler
Microchip’s moat centers on cost advantages in embedded control solutions but lags TXN in profitability. Its negative ROIC versus WACC signals value destruction amid fierce competition. However, opportunities in specialized microcontrollers and security could offer a turnaround if execution improves.
Verdict: Scale Moat vs. Cost Efficiency in a Margin Squeeze
Texas Instruments commands a wider and deeper moat through its intangible assets and robust returns. Microchip’s shrinking ROIC and margin pressure expose vulnerabilities. TXN is better positioned to defend market share against competitive threats in 2026.
Which stock offers better returns?
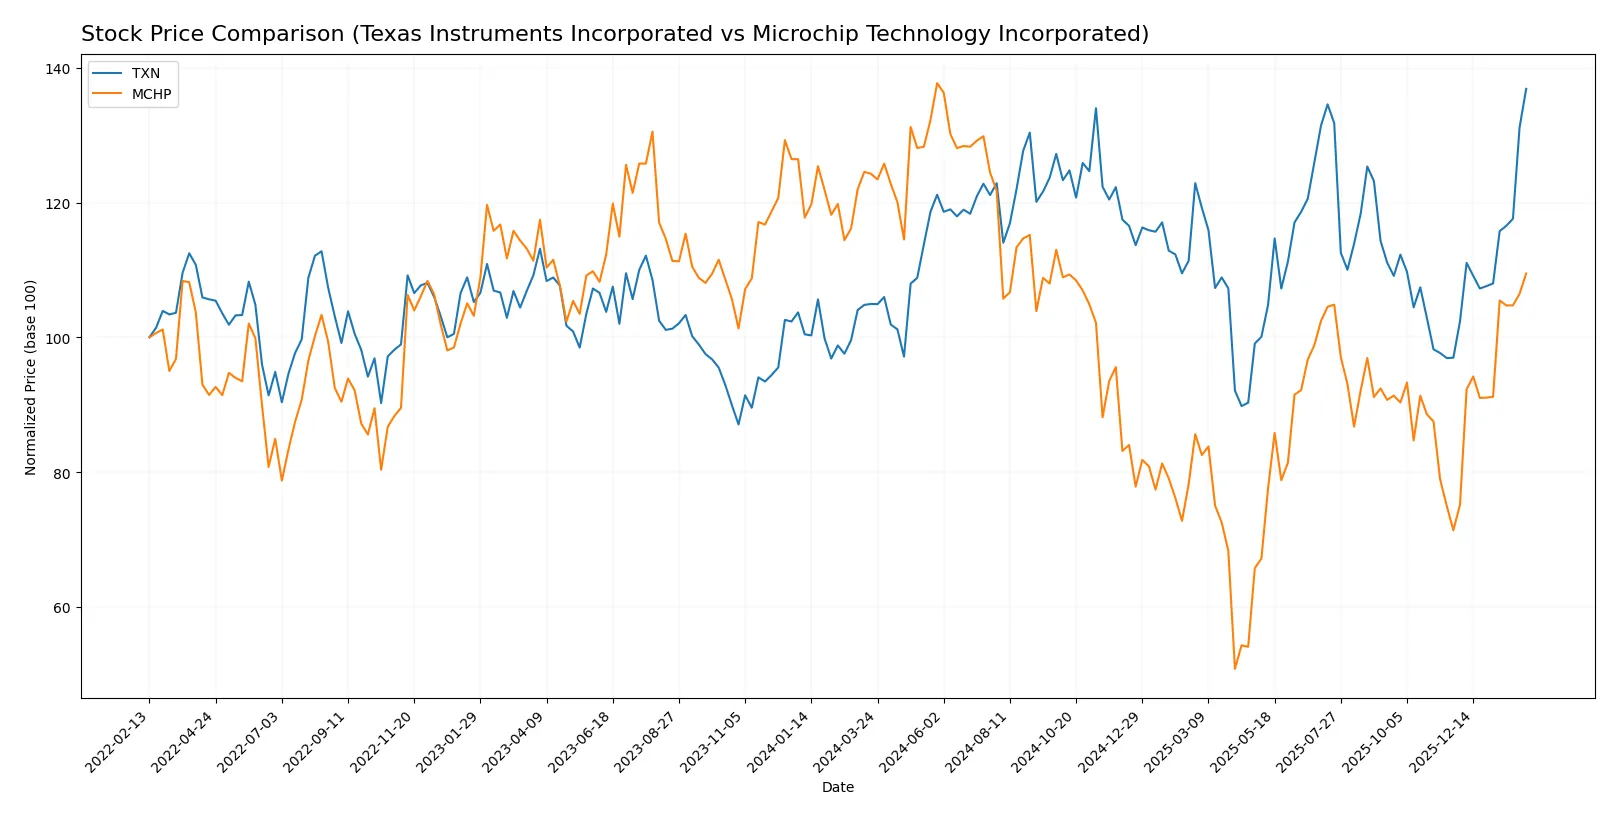
The past year shows contrasting price dynamics: Texas Instruments surged over 30%, while Microchip Technology declined nearly 12%, highlighting divergent market confidence and momentum.
Trend Comparison
Texas Instruments gained 30.43% over the past 12 months, signaling a bullish trend with accelerating momentum and a high near 225.01. Volatility is elevated at a 16.28% standard deviation.
Microchip Technology dropped 11.91% over the same period, reflecting a bearish trend despite acceleration. Its highest price was 98.23, and volatility remains moderate at 14.14%.
Comparing both, Texas Instruments delivered stronger market performance with a significant positive price change, contrasting Microchip’s sustained price decline.
Target Prices
Analysts present a balanced target consensus for Texas Instruments and Microchip Technology, reflecting moderate upside potential.
| Company | Target Low | Target High | Consensus |
|---|---|---|---|
| Texas Instruments Incorporated | 160 | 260 | 204.64 |
| Microchip Technology Incorporated | 60 | 100 | 82.46 |
Texas Instruments trades slightly above its $204.64 consensus target at $225.01, implying limited near-term upside. Microchip Technology’s $82.46 consensus sits just above the current $78.08 share price, signaling modest expected appreciation.

Don’t Let Luck Decide Your Entry Point
Optimize your entry points with our advanced ProRealTime indicators. You’ll get efficient buy signals with precise price targets for maximum performance. Start outperforming now!
How do institutions grade them?
Here is a summary of the recent institutional grades for Texas Instruments Incorporated and Microchip Technology Incorporated:
Texas Instruments Incorporated Grades
The following table lists recent ratings from major grading companies for Texas Instruments Incorporated.
| Grading Company | Action | New Grade | Date |
|---|---|---|---|
| Keybanc | Maintain | Overweight | 2026-01-28 |
| Deutsche Bank | Maintain | Hold | 2026-01-28 |
| Truist Securities | Maintain | Hold | 2026-01-28 |
| Cantor Fitzgerald | Maintain | Neutral | 2026-01-28 |
| Mizuho | Maintain | Underperform | 2026-01-28 |
| Stifel | Maintain | Hold | 2026-01-28 |
| UBS | Maintain | Buy | 2026-01-28 |
| Goldman Sachs | Maintain | Sell | 2026-01-28 |
| JP Morgan | Maintain | Overweight | 2026-01-28 |
| Jefferies | Maintain | Hold | 2026-01-28 |
Microchip Technology Incorporated Grades
Below are the recent institutional ratings for Microchip Technology Incorporated.
| Grading Company | Action | New Grade | Date |
|---|---|---|---|
| Cantor Fitzgerald | Maintain | Overweight | 2026-02-02 |
| UBS | Maintain | Buy | 2026-01-26 |
| Susquehanna | Maintain | Positive | 2026-01-22 |
| B of A Securities | Maintain | Neutral | 2026-01-21 |
| Citigroup | Maintain | Buy | 2026-01-15 |
| Piper Sandler | Maintain | Overweight | 2026-01-15 |
| B. Riley Securities | Maintain | Buy | 2026-01-12 |
| Mizuho | Maintain | Outperform | 2026-01-09 |
| Wells Fargo | Maintain | Equal Weight | 2026-01-07 |
| JP Morgan | Maintain | Overweight | 2026-01-06 |
Which company has the best grades?
Microchip Technology Incorporated consistently receives higher ratings, including multiple Buy and Outperform grades. Texas Instruments’ ratings are more mixed, spanning Buy to Sell. This divergence could influence investor sentiment and portfolio positioning.
Risks specific to each company
The following categories identify the critical pressure points and systemic threats facing both firms in the 2026 market environment:
1. Market & Competition
Texas Instruments Incorporated
- Dominates analog and embedded processing with strong market cap of $204B, benefiting from diversified industrial and automotive demand.
Microchip Technology Incorporated
- Faces intense competition with smaller $42B market cap, pressured by weaker profitability and niche embedded control solutions.
2. Capital Structure & Debt
Texas Instruments Incorporated
- Maintains moderate leverage (D/E 0.86) and strong interest coverage (11.5x), indicating solid financial flexibility.
Microchip Technology Incorporated
- Similar leverage (D/E 0.8) but weak interest coverage (1.15x) signals riskier debt servicing ability.
3. Stock Volatility
Texas Instruments Incorporated
- Exhibits market beta near 1.0, reflecting average volatility aligned with NASDAQ tech peers.
Microchip Technology Incorporated
- Higher beta at 1.44 denotes greater stock price swings and elevated risk exposure.
4. Regulatory & Legal
Texas Instruments Incorporated
- Operates globally with established compliance, but must navigate semiconductor export controls and IP protections.
Microchip Technology Incorporated
- Also global, but smaller scale may increase vulnerability to regulatory changes in key markets like automotive and aerospace.
5. Supply Chain & Operations
Texas Instruments Incorporated
- Robust manufacturing with integrated supply chain supports operational resilience amid industry cyclicality.
Microchip Technology Incorporated
- Relies more on subcontracting for wafer foundry and assembly, increasing supply chain complexity and potential disruptions.
6. ESG & Climate Transition
Texas Instruments Incorporated
- Likely invests in energy-efficient products and sustainable manufacturing, aligning with rising ESG investor demands.
Microchip Technology Incorporated
- ESG initiatives less transparent; smaller size may limit resources for climate transition investments.
7. Geopolitical Exposure
Texas Instruments Incorporated
- Global footprint with exposure to US-China tensions, but diversified markets mitigate concentrated geopolitical risk.
Microchip Technology Incorporated
- Similar global exposure; reliance on specialized tech markets could amplify geopolitical supply chain risks.
Which company shows a better risk-adjusted profile?
Texas Instruments faces its biggest risk in market competition, given its premium valuation and pressure to maintain innovation leadership. Microchip’s critical risk lies in capital structure, with weak interest coverage raising financial distress concerns. Overall, Texas Instruments offers a stronger risk-adjusted profile, supported by a robust Altman Z-score of 9.44 versus Microchip’s 4.05 and superior profitability metrics. Recent data shows Microchip’s negative net margin and low Piotroski score, underscoring its operational and financial fragility.
Final Verdict: Which stock to choose?
Texas Instruments Incorporated (TXN) stands out with its superpower of generating robust, consistent returns on invested capital well above its cost of capital. This cash machine benefits from a durable competitive edge, though investors should watch its gradually declining profitability trends. TXN suits portfolios seeking steady, slightly favorable growth with strong financial health.
Microchip Technology Incorporated (MCHP) offers strategic appeal through its niche specialization and a resilient recurring revenue base. Its safety profile, however, is weaker than TXN’s, marked by value destruction and financial distress signals. MCHP might fit investors willing to accept volatility for a possible turnaround and growth-at-a-reasonable-price (GARP) approach.
If you prioritize durable value creation and financial resilience, TXN is the compelling choice due to its robust moat and strong balance sheet. However, if you seek a higher-risk, potential recovery play with a focus on niche market opportunities, MCHP offers a scenario for speculative growth despite its weaker fundamentals.
Disclaimer: Investment carries a risk of loss of initial capital. The past performance is not a reliable indicator of future results. Be sure to understand risks before making an investment decision.
Go Further
I encourage you to read the complete analyses of Texas Instruments Incorporated and Microchip Technology Incorporated to enhance your investment decisions: