Home > Comparison > Technology > TXN vs LSCC
The strategic rivalry between Texas Instruments Incorporated and Lattice Semiconductor Corporation shapes the semiconductor sector’s evolution. Texas Instruments operates as a diversified analog and embedded processing powerhouse, while Lattice Semiconductor focuses on programmable gate arrays and IP licensing. This head-to-head highlights a contrast between a market-leading industrial giant and a specialized innovator. This analysis will determine which corporate trajectory delivers superior risk-adjusted returns for a diversified portfolio in 2026.
Table of contents
Companies Overview
Texas Instruments and Lattice Semiconductor stand as influential players in the semiconductor industry, shaping diverse technology markets.
Texas Instruments Incorporated: Analog and Embedded Processing Powerhouse
Texas Instruments dominates as a semiconductor designer and manufacturer with a focus on analog and embedded processing segments. Its revenue primarily flows from power management, signal chain products, and microcontrollers used across industrial, automotive, and personal electronics markets. In 2026, TI emphasizes expanding its product breadth in power solutions and embedded processors to sustain its market leadership.
Lattice Semiconductor Corporation: FPGA and Connectivity Specialist
Lattice Semiconductor specializes in field programmable gate arrays (FPGAs) and video connectivity products, catering to communications, computing, and automotive sectors. Its revenue engine includes direct sales and licensing of its technology portfolio worldwide. In 2026, Lattice prioritizes technological innovation in programmable logic devices to capture growth in high-demand, niche semiconductor applications.
Strategic Collision: Similarities & Divergences
Both companies operate within semiconductors but diverge sharply: TI pursues a broad analog and embedded processing ecosystem, while Lattice targets programmable logic with an open architecture. The primary battleground lies in industrial and automotive markets where power management meets programmable flexibility. Their investment profiles contrast TI’s stable, diversified revenue against Lattice’s growth-oriented, innovation-driven approach.
Income Statement Comparison
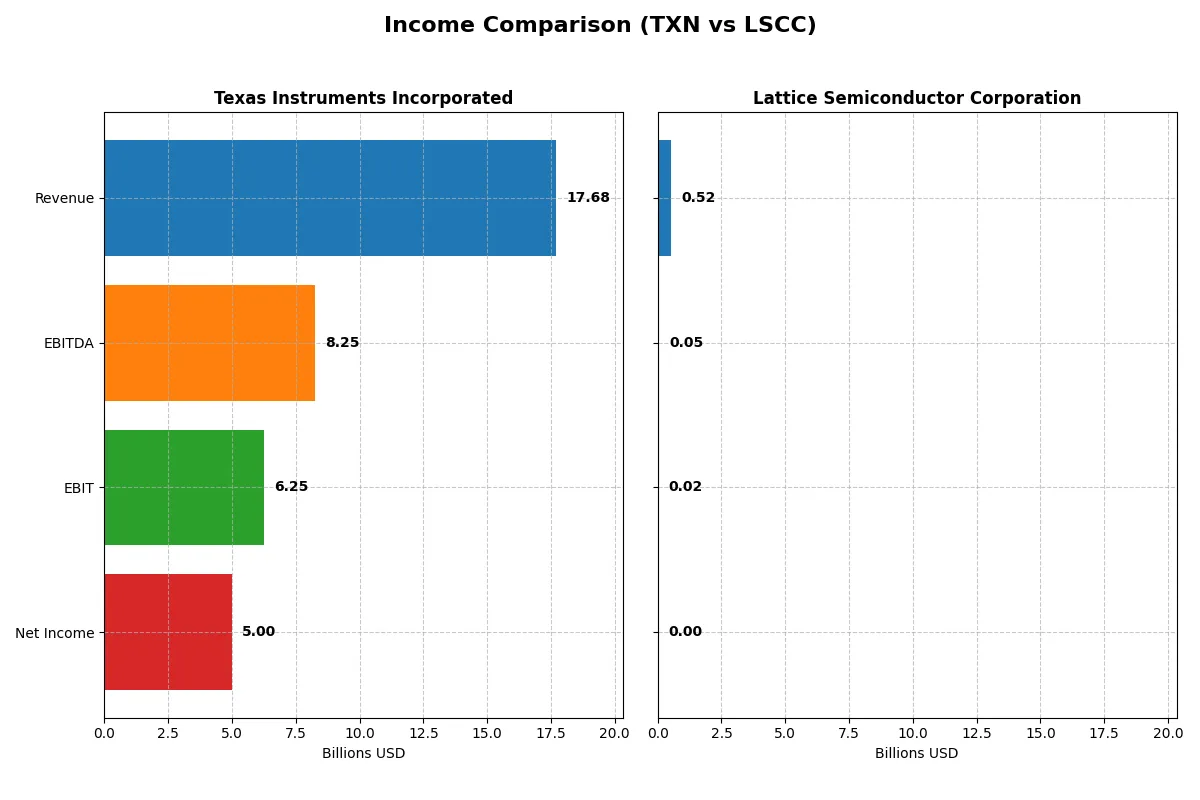
This table dissects the core profitability and scalability of both corporate engines to reveal who dominates the bottom line:
| Metric | Texas Instruments Incorporated (TXN) | Lattice Semiconductor Corporation (LSCC) |
|---|---|---|
| Revenue | 17.7B | 523M |
| Cost of Revenue | 7.6B | 166M |
| Operating Expenses | 4.1B | 342M |
| Gross Profit | 10.1B | 357M |
| EBITDA | 8.3B | 51M |
| EBIT | 6.3B | 15M |
| Interest Expense | 543M | 3M |
| Net Income | 5.0B | 3M |
| EPS | 5.45 | 0.0225 |
| Fiscal Year | 2025 | 2025 |
Income Statement Analysis: The Bottom-Line Duel
This income statement comparison exposes each company’s operational efficiency and profit generation over recent years.
Texas Instruments Incorporated Analysis
Texas Instruments (TXN) shows a generally stable revenue around $17.7B in 2025 with a recent 13% rise, though net income fell 23% from 2023’s peak $6.5B to $5B in 2025. Gross margin holds firm at 57%, supporting a healthy net margin near 28%. Despite a slight net margin decline, TXN sustains strong operating efficiency and solid earnings per share growth.
Lattice Semiconductor Corporation Analysis
Lattice Semiconductor (LSCC) posts modest revenue near $523M in 2025, up marginally from prior years. Gross margin impresses at 68%, but net margin collapses to less than 1%, reflecting weak profitability. Recent years show a sharp net income decline from $259M in 2023 to just $3M in 2025. EBIT and EPS also deteriorate sharply, signaling operational challenges despite revenue stability.
Margin Strength vs. Profitability Struggles
TXN outperforms LSCC clearly with superior scale, consistent gross and net margins, and healthier earnings trends. TXN’s disciplined cost structure and robust margins reflect a resilient business model. LSCC’s high gross margin fails to translate into profits, with net margins near zero and steep income declines. Investors prioritizing stable profitability would find TXN’s profile more compelling.
Financial Ratios Comparison
These vital ratios act as a diagnostic tool to expose the underlying fiscal health, valuation premiums, and capital efficiency of the companies compared below:
| Ratios | Texas Instruments (TXN) | Lattice Semiconductor (LSCC) |
|---|---|---|
| ROE | 30.7% | 0.43% |
| ROIC | 16.5% | 0.47% |
| P/E | 31.5 | 3496 |
| P/B | 9.69 | 15.1 |
| Current Ratio | 4.35 | 3.09 |
| Quick Ratio | 2.83 | 2.33 |
| D/E (Debt-to-Equity) | 0.95 | 0.10 |
| Debt-to-Assets | 44.5% | 8.4% |
| Interest Coverage | 11.1 | 5.27 |
| Asset Turnover | 0.51 | 0.61 |
| Fixed Asset Turnover | 1.44 | 4.49 |
| Payout Ratio | 100.0% | 0% |
| Dividend Yield | 3.17% | 0% |
| Fiscal Year | 2025 | 2025 |
Efficiency & Valuation Duel: The Vital Signs
Financial ratios serve as a company’s DNA, exposing hidden risks and revealing operational strengths and weaknesses for investors.
Texas Instruments Incorporated
Texas Instruments boasts a strong ROE of 30.7% and a healthy net margin at 28.3%, signaling robust profitability. Its valuation is stretched, with a P/E of 31.5 and P/B near 9.7, above typical benchmarks. The company supports shareholders with a 3.17% dividend yield, indicating steady returns alongside reinvestment in R&D for growth.
Lattice Semiconductor Corporation
Lattice Semiconductor struggles with profitability, showing a weak ROE of 0.43% and a net margin of 0.59%. Its valuation is highly stretched, with an extreme P/E of 3,496 and P/B of 15.1, reflecting market skepticism. The firm pays no dividend, focusing instead on heavy R&D spending, which signals a long-term growth strategy but adds risk.
Premium Valuation vs. Operational Safety
Texas Instruments offers a superior balance of profitability and shareholder returns despite a high valuation. Lattice’s stretched multiples and weak profitability highlight riskier growth bets. Investors favoring stability and income may prefer Texas Instruments, while those seeking speculative growth might consider Lattice’s profile.
Which one offers the Superior Shareholder Reward?
I see Texas Instruments (TXN) delivers a 3.17% dividend yield with an almost 100% payout ratio, fully supported by steady free cash flow of 2.86B in 2025. TXN balances dividends with buybacks, sustaining long-term shareholder value. Conversely, Lattice Semiconductor (LSCC) pays no dividends but reinvests aggressively, showing modest net margins of 0.6% and a free cash flow of 0.97B, with buybacks less evident. TXN’s mature, balanced distribution model beats LSCC’s growth-focused reinvestment for total return reliability in 2026.
Comparative Score Analysis: The Strategic Profile
The radar chart reveals the fundamental DNA and trade-offs of Texas Instruments and Lattice Semiconductor, highlighting their financial strengths and weaknesses:
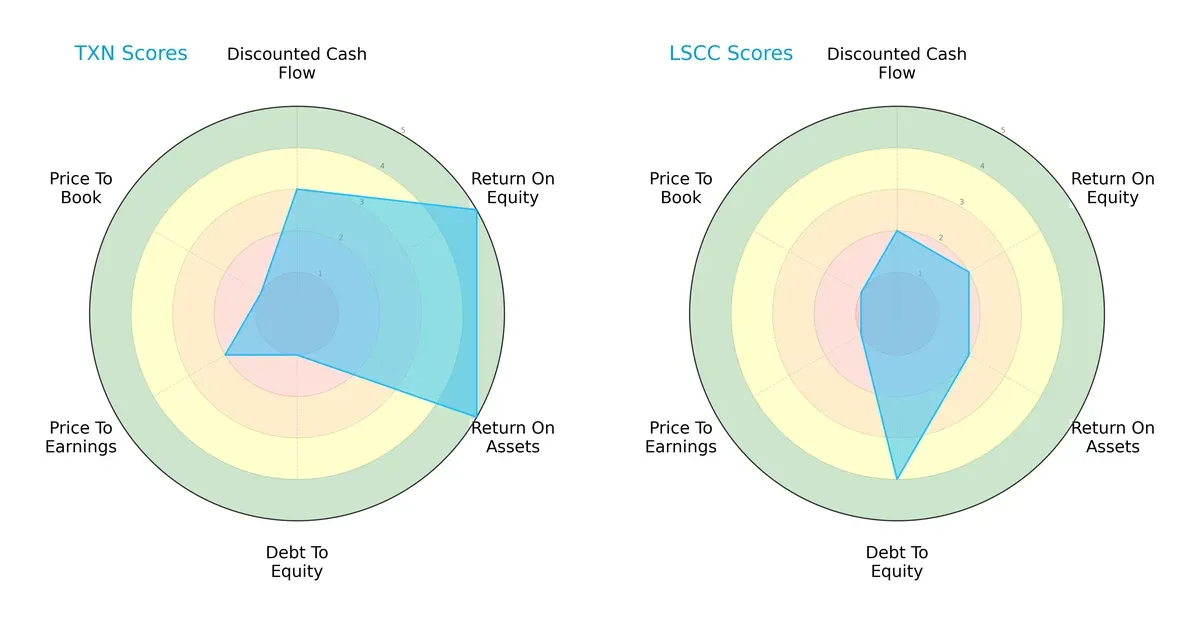
Texas Instruments leads with very favorable ROE and ROA scores at 5 each, reflecting efficient profit and asset utilization. However, it carries a very unfavorable debt-to-equity score of 1, signaling heavy leverage risk. Lattice Semiconductor shows a stronger balance sheet with a favorable debt-to-equity score of 4 but lags in profitability metrics (ROE and ROA scores of 2) and valuation scores (P/E and P/B both at 1). Overall, Texas Instruments demonstrates a more profit-driven profile, while Lattice relies on financial prudence and lower leverage.
Bankruptcy Risk: Solvency Showdown
The Altman Z-Score gap highlights both firms’ sturdy solvency positions in this cycle:
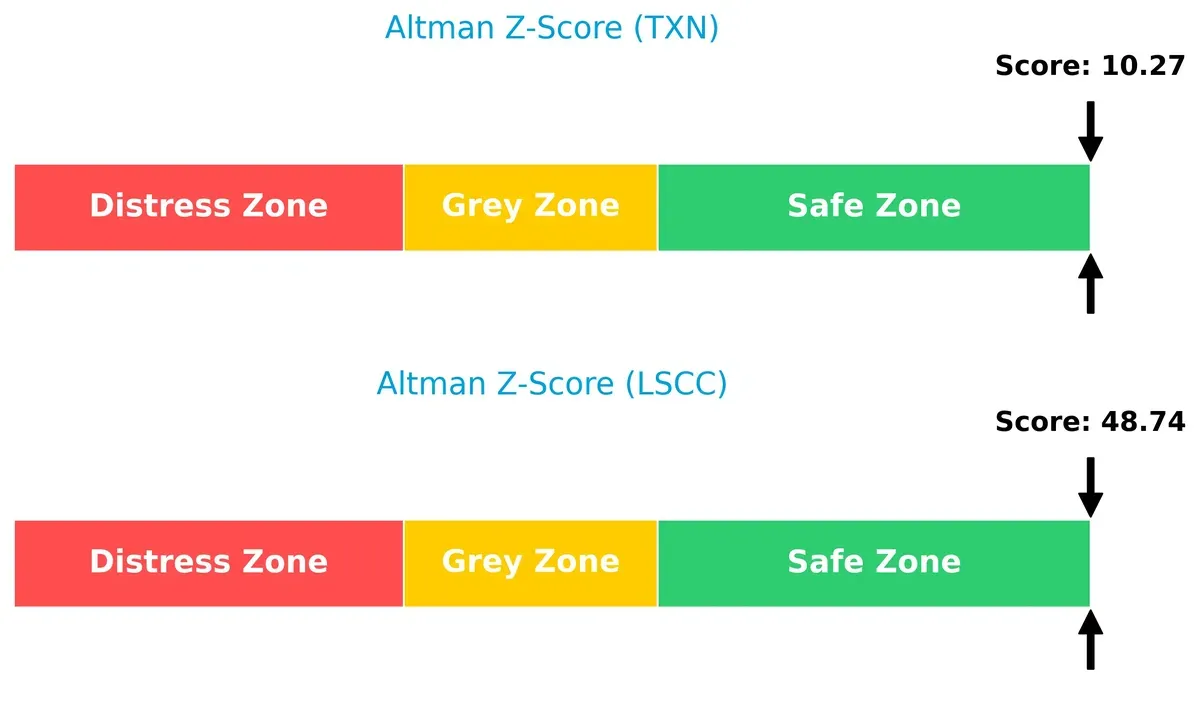
Lattice Semiconductor’s Altman Z-Score of 48.7 far exceeds Texas Instruments’ 10.3, placing both comfortably in the safe zone. This stark difference underscores Lattice’s superior bankruptcy resilience, driven by conservative leverage and robust liquidity, compared to Texas Instruments’ riskier capital structure.
Financial Health: Quality of Operations
Both companies share equally strong Piotroski F-Scores, indicating robust operational quality and financial strength:
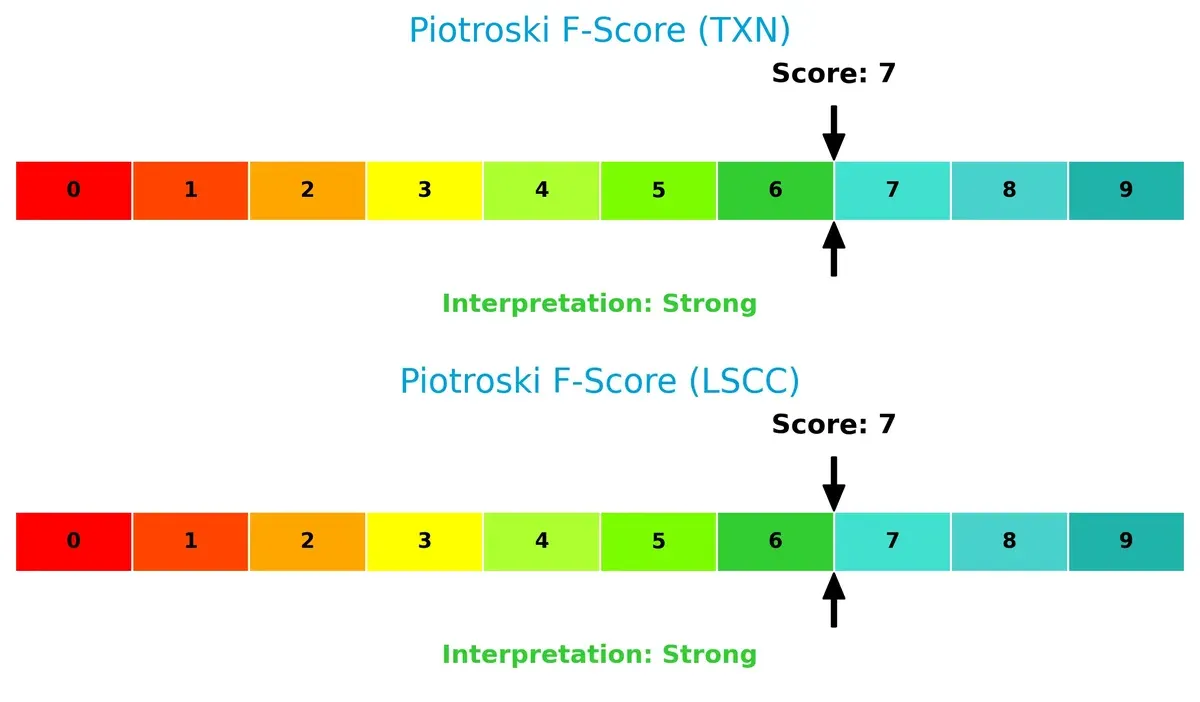
Texas Instruments and Lattice Semiconductor each score 7 out of 9, reflecting strong profitability, efficiency, and low financial distress signs. Neither displays red flags internally, but given Texas Instruments’ leverage concerns, Lattice’s balanced financial health could offer a safer investment profile in turbulent cycles.
How are the two companies positioned?
This section dissects TXN and LSCC’s operational DNA by comparing revenue distribution and internal strengths and weaknesses. The goal is to confront their economic moats and identify the most resilient competitive advantage today.
Revenue Segmentation: The Strategic Mix
This comparison dissects how Texas Instruments and Lattice Semiconductor diversify their revenue streams and where their primary sector bets lie:
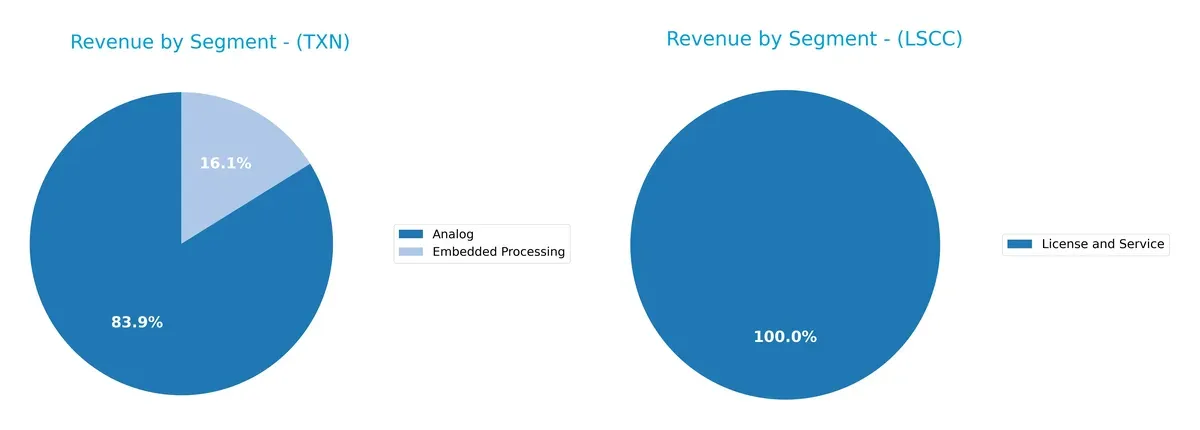
Texas Instruments anchors its revenue in Analog at $14B (2025), with Embedded Processing trailing at $2.7B. This concentration reflects a strong moat in analog semiconductors, crucial for infrastructure dominance. Lattice Semiconductor shows a more fragmented mix: $332M from Product Revenue via distributors and $51M direct product sales, plus $17M in License and Service. Texas Instruments’ focused leadership contrasts with Lattice’s diversified but smaller-scale approach, implying higher concentration risk for Texas Instruments but broader exposure for Lattice.
Strengths and Weaknesses Comparison
This table compares the strengths and weaknesses of Texas Instruments and Lattice Semiconductor:
Texas Instruments Strengths
- High net margin of 28.28%
- Strong ROE at 30.73%
- ROIC well above WACC at 16.46%
- Diverse analog and embedded processing revenue streams
- Broad global presence with strong U.S. and Asia sales
- Favorable quick ratio and interest coverage
Lattice Semiconductor Strengths
- Favorable quick ratio and low debt to equity at 0.1
- Strong fixed asset turnover at 4.49
- Interest coverage at 5.27
- Global sales spread across Americas, Asia, Europe
- Consistent service and license revenue segment
Texas Instruments Weaknesses
- Elevated P/E of 31.53 signals possible overvaluation
- High P/B ratio at 9.69
- Unfavorable current ratio of 4.35 suggests liquidity risk
- Moderate leverage with debt to assets at 44.5%
- Asset turnover at 0.51 is neutral, indicating room for efficiency improvements
Lattice Semiconductor Weaknesses
- Very low profitability with net margin at 0.59% and ROE at 0.43%
- ROIC below WACC at 0.47% versus 11.47% WACC
- Extremely high P/E of 3496.18 and P/B at 15.1
- No dividend yield
- Current ratio of 3.09 is unfavorable despite low debt
Texas Instruments exhibits robust profitability and global diversification but faces valuation and liquidity concerns. Lattice Semiconductor shows financial conservatism with low debt and asset efficiency but struggles with profitability and valuation, highlighting contrasting strategic challenges.
The Moat Duel: Analyzing Competitive Defensibility
A structural moat is the only thing protecting long-term profits from relentless competition erosion. Let’s dissect how Texas Instruments and Lattice Semiconductor defend their turf:
Texas Instruments Incorporated: Cost Advantage Moat
I see Texas Instruments’ moat in its efficient manufacturing scale and broad analog portfolio. Its 35% EBIT margin and 8.5% ROIC premium over WACC confirm strong value creation. However, a declining ROIC trend signals emerging margin pressure in 2026.
Lattice Semiconductor Corporation: Niche Innovation Moat
Lattice’s moat hinges on specialized programmable logic devices, contrasting TXN’s broad analog dominance. Yet, with a negative ROIC spread of -11% and steep profitability declines, its competitive edge weakens sharply in 2026 despite focused innovation.
Defensive Moat Battle: Scale Efficiency vs. Niche Innovation
Texas Instruments commands a wider, deeper moat through scalable cost advantages and steady profitability. Lattice’s shrinking returns expose vulnerability. TXN stands better positioned to defend and grow market share amid intensifying semiconductor competition.
Which stock offers better returns?
Over the past year, Texas Instruments and Lattice Semiconductor both posted strong gains, with Texas Instruments showing higher price appreciation and accelerating momentum.
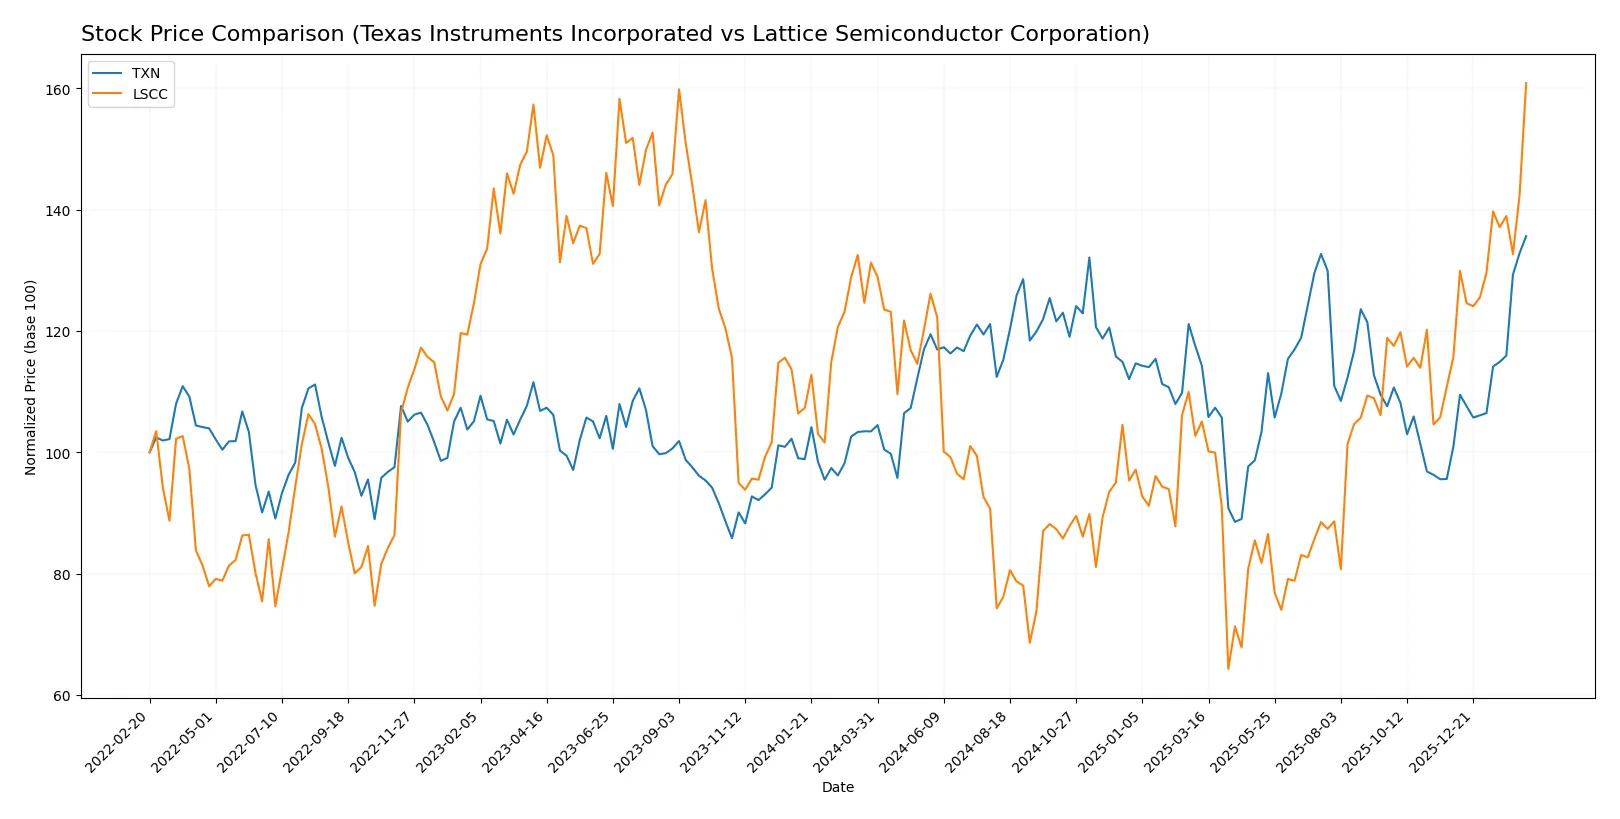
Trend Comparison
Texas Instruments’ stock rose 31.12% over the past year, signaling a bullish trend with accelerating gains and a notable high of 226.16. Volatility remains elevated with a standard deviation of 16.56.
Lattice Semiconductor’s stock increased 22.53% in the same period, also bullish with acceleration. It recorded a high of 97.63 and lower volatility at a standard deviation of 11.77.
Texas Instruments outperformed Lattice Semiconductor, delivering the highest total price gain and stronger recent acceleration in market performance.
Target Prices
Analysts set clear target price ranges for Texas Instruments and Lattice Semiconductor, revealing moderate upside potential.
| Company | Target Low | Target High | Consensus |
|---|---|---|---|
| Texas Instruments Incorporated | 160 | 260 | 204.64 |
| Lattice Semiconductor Corporation | 80 | 125 | 104.7 |
Texas Instruments trades above its consensus target, suggesting recent strength may have outpaced analyst expectations. Lattice Semiconductor’s target consensus indicates a roughly 7% upside from the current price, implying cautious optimism among analysts.

Don’t Let Luck Decide Your Entry Point
Optimize your entry points with our advanced ProRealTime indicators. You’ll get efficient buy signals with precise price targets for maximum performance. Start outperforming now!
How do institutions grade them?
This section compares the recent grades assigned to Texas Instruments Incorporated and Lattice Semiconductor Corporation by leading grading companies:
Texas Instruments Incorporated Grades
Below is a summary of recent grades given to Texas Instruments Incorporated by reputable firms.
| Grading Company | Action | New Grade | Date |
|---|---|---|---|
| Rosenblatt | Maintain | Buy | 2026-02-05 |
| Mizuho | Maintain | Underperform | 2026-01-28 |
| Keybanc | Maintain | Overweight | 2026-01-28 |
| Goldman Sachs | Maintain | Sell | 2026-01-28 |
| B of A Securities | Upgrade | Neutral | 2026-01-28 |
| Cantor Fitzgerald | Maintain | Neutral | 2026-01-28 |
| Rosenblatt | Maintain | Buy | 2026-01-28 |
| JP Morgan | Maintain | Overweight | 2026-01-28 |
| Benchmark | Maintain | Buy | 2026-01-28 |
| Truist Securities | Maintain | Hold | 2026-01-28 |
Lattice Semiconductor Corporation Grades
Below is a summary of recent grades given to Lattice Semiconductor Corporation by reputable firms.
| Grading Company | Action | New Grade | Date |
|---|---|---|---|
| Susquehanna | Maintain | Positive | 2026-02-11 |
| Jefferies | Maintain | Buy | 2026-02-11 |
| Keybanc | Maintain | Overweight | 2026-02-11 |
| Stifel | Maintain | Buy | 2026-02-11 |
| Needham | Maintain | Buy | 2026-02-11 |
| Benchmark | Maintain | Buy | 2026-02-11 |
| RBC Capital | Maintain | Outperform | 2026-02-11 |
| Rosenblatt | Maintain | Buy | 2026-02-11 |
| Susquehanna | Maintain | Positive | 2026-01-22 |
| Keybanc | Maintain | Overweight | 2026-01-13 |
Which company has the best grades?
Lattice Semiconductor holds a stronger consensus with mostly Buy, Outperform, and Positive ratings. Texas Instruments shows mixed views, ranging from Buy to Sell. Investors may perceive Lattice as favored by analysts, potentially impacting market sentiment.
Risks specific to each company
The following categories identify critical pressure points and systemic threats facing Texas Instruments Incorporated and Lattice Semiconductor Corporation in the 2026 market environment:
1. Market & Competition
Texas Instruments Incorporated
- Dominates analog and embedded processing markets with strong product diversification.
Lattice Semiconductor Corporation
- Faces intense competition in FPGA and niche semiconductor markets, limiting pricing power.
2. Capital Structure & Debt
Texas Instruments Incorporated
- Moderate leverage with debt-to-equity around 0.95, manageable but requires monitoring.
Lattice Semiconductor Corporation
- Low leverage with a debt-to-equity ratio of 0.1, indicating a strong balance sheet and low financial risk.
3. Stock Volatility
Texas Instruments Incorporated
- Beta near 1.0 suggests market-correlated volatility, relatively stable for tech sector.
Lattice Semiconductor Corporation
- Higher beta of 1.67 implies greater stock price swings and increased investor risk.
4. Regulatory & Legal
Texas Instruments Incorporated
- Subject to global semiconductor regulations but benefits from long-standing compliance frameworks.
Lattice Semiconductor Corporation
- Smaller scale exposes it to more significant impact from regulatory changes and patent litigations.
5. Supply Chain & Operations
Texas Instruments Incorporated
- Extensive global supply chain with robust risk management due to scale and experience.
Lattice Semiconductor Corporation
- More vulnerable to supply disruptions given smaller operational scale and less diversified suppliers.
6. ESG & Climate Transition
Texas Instruments Incorporated
- Advanced ESG initiatives embedded in corporate strategy, aligning with investor expectations.
Lattice Semiconductor Corporation
- Emerging ESG programs but lagging behind industry leaders, posing reputational risks.
7. Geopolitical Exposure
Texas Instruments Incorporated
- Global footprint exposes it to US-China tensions but diversified end markets mitigate risk.
Lattice Semiconductor Corporation
- Higher sensitivity to geopolitical risks due to smaller size and concentration in specific regions.
Which company shows a better risk-adjusted profile?
Texas Instruments faces its most significant risk in capital structure with moderate leverage that requires vigilance amid market shifts. Lattice Semiconductor’s biggest concern is stock volatility, which signals heightened market risk. Overall, Texas Instruments offers a more balanced risk-adjusted profile, supported by its diversified markets and stable financial metrics. The recent data highlight Lattice’s extreme valuation multiples and high beta, justifying caution despite its strong balance sheet.
Final Verdict: Which stock to choose?
Texas Instruments Incorporated stands out for its robust capital efficiency and strong value creation, driven by a consistent ROIC well above its cost of capital. Its main point of vigilance lies in a high current ratio that could signal excess idle assets. This stock fits well within an income-focused or conservative growth portfolio seeking stability and dividend yield.
Lattice Semiconductor Corporation’s strategic moat lies in its specialized R&D intensity and relatively low leverage, offering a nimble approach in a competitive niche. Compared to Texas Instruments, it presents a riskier profile with weaker profitability metrics but may appeal to investors favoring early-stage growth potential and technology innovation in a GARP framework.
If you prioritize proven capital allocation and steady value creation, Texas Instruments is the compelling choice due to its established moat and dividend stability. However, if you seek speculative growth with exposure to cutting-edge semiconductor development, Lattice Semiconductor offers superior upside potential despite its financial fragility. Each profile demands careful alignment with risk tolerance and investment horizon.
Disclaimer: Investment carries a risk of loss of initial capital. The past performance is not a reliable indicator of future results. Be sure to understand risks before making an investment decision.
Go Further
I encourage you to read the complete analyses of Texas Instruments Incorporated and Lattice Semiconductor Corporation to enhance your investment decisions: