Home > Comparison > Technology > TXN vs INDI
The strategic rivalry between Texas Instruments Incorporated and indie Semiconductor, Inc. shapes the semiconductor sector’s competitive landscape. Texas Instruments, a capital-intensive giant, excels in analog and embedded processing, while indie Semiconductor, a nimble innovator, targets automotive chips and software. This analysis pits established scale against specialized growth. I will determine which company’s trajectory offers superior risk-adjusted returns for investors seeking resilient exposure in technology’s evolving frontier.
Table of contents
Companies Overview
Texas Instruments and indie Semiconductor play pivotal roles in the semiconductor industry with distinct market footprints.
Texas Instruments Incorporated: Analog and Embedded Powerhouse
Texas Instruments dominates as a leading semiconductor manufacturer specializing in analog and embedded processing. Its core revenue derives from power management products and microcontrollers used widely in industrial and automotive sectors. In 2026, the company strategically focuses on expanding its analog portfolio to meet growing power efficiency demands worldwide.
indie Semiconductor, Inc.: Innovative Automotive Chipmaker
indie Semiconductor positions itself as a specialist in automotive semiconductors and software solutions for advanced driver-assistance and connected car features. The company generates revenue from devices supporting infotainment, wireless charging, and telematics. Its strategy in 2026 centers on scaling photonic components and enhancing user experience technologies in electric vehicles.
Strategic Collision: Similarities & Divergences
Both companies focus on semiconductor innovation but diverge in philosophy: Texas Instruments relies on a broad analog and embedded product ecosystem, while indie Semiconductor pursues niche automotive applications. They compete primarily in automotive electronics, where power efficiency meets user connectivity. Their investment profiles contrast sharply—Texas Instruments offers stability with scale, indie Semiconductor presents high growth potential but with elevated volatility.
Income Statement Comparison
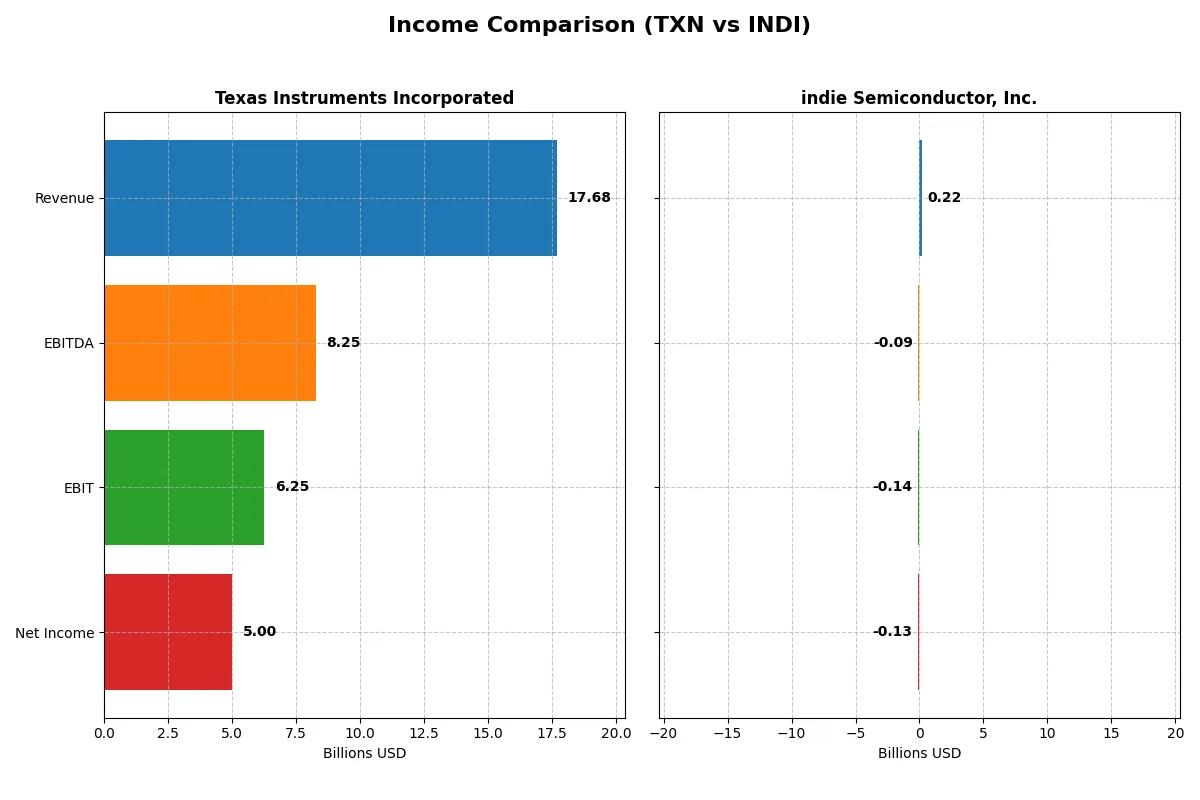
The following data dissects the core profitability and scalability of both corporate engines to reveal who dominates the bottom line:
| Metric | Texas Instruments Incorporated (TXN) | indie Semiconductor, Inc. (INDI) |
|---|---|---|
| Revenue | 17.7B | 217M |
| Cost of Revenue | 7.6B | 126M |
| Operating Expenses | 4.1B | 260M |
| Gross Profit | 10.1B | 90M |
| EBITDA | 8.3B | -94M |
| EBIT | 6.3B | -137M |
| Interest Expense | 543M | 9.3M |
| Net Income | 5.0B | -133M |
| EPS | 5.45 | -0.76 |
| Fiscal Year | 2025 | 2024 |
Income Statement Analysis: The Bottom-Line Duel
The following income statement comparison reveals which company operates with superior efficiency and profitability in their respective markets.
Texas Instruments Incorporated Analysis
Texas Instruments (TXN) shows a solid revenue trend with $17.7B in 2025, up 13% from 2024, although overall revenue fell 3.6% from 2021. Net income declined sharply over five years but remains strong at $5B in 2025. Gross margin holds favorably at 57%, and net margin is robust at 28%. Despite a modest EBIT growth of 4.9% last year, the company demonstrates disciplined operating expense control and maintains solid earnings per share momentum.
indie Semiconductor, Inc. Analysis
Indie Semiconductor (INDI) grew revenue dramatically over five years, reaching $217M in 2024, but dipped nearly 3% from 2023. Gross margin sits at a favorable 42%, yet the company posts a deeply negative EBIT margin of -63%, reflecting ongoing operating losses. Net income remains negative at -$133M in 2024, though EPS improved 6% last year. The firm shows growth potential but operates with significant inefficiencies and persistent losses.
Margin Strength vs. Growth Challenges
Texas Instruments commands the income statement through high margins and positive net income, despite recent margin compression and slower revenue growth. Indie Semiconductor exhibits strong top-line expansion but suffers heavy losses and weak profitability metrics. For investors prioritizing consistent earnings and margin stability, Texas Instruments offers a more attractive profile. Indie’s high growth comes with elevated risk and operational inefficiency.
Financial Ratios Comparison
These vital ratios act as a diagnostic tool to expose the underlying fiscal health, valuation premiums, and capital efficiency of the companies compared below:
| Ratios | Texas Instruments (TXN) | indie Semiconductor (INDI) |
|---|---|---|
| ROE | 30.7% | -31.7% |
| ROIC | 16.5% | -19.3% |
| P/E | 31.5 | -5.3 |
| P/B | 9.7 | 1.7 |
| Current Ratio | 4.35 | 4.82 |
| Quick Ratio | 2.83 | 4.23 |
| D/E (Debt-to-Equity Ratio) | 0.86 | 0.95 |
| Debt-to-Assets | 40.6% | 42.3% |
| Interest Coverage | 11.1 | -18.4 |
| Asset Turnover | 0.51 | 0.23 |
| Fixed Asset Turnover | 1.44 | 4.30 |
| Payout Ratio | 100% | 0% |
| Dividend Yield | 3.17% | 0% |
| Fiscal Year | 2025 | 2024 |
Efficiency & Valuation Duel: The Vital Signs
Financial ratios serve as a company’s DNA, exposing hidden risks and operational strengths that drive investor decisions.
Texas Instruments Incorporated
Texas Instruments delivers robust profitability with a 30.7% ROE and a strong 28.3% net margin, signaling efficient capital use. However, its valuation appears stretched, with a P/E of 31.5 and a P/B of 9.7, both unfavorable compared to sector norms. The firm rewards shareholders with a 3.2% dividend yield, reflecting steady cash returns amid reinvestment in R&D.
indie Semiconductor, Inc.
indie Semiconductor struggles with negative profitability metrics: a -31.7% ROE and a -61.2% net margin, indicating operational losses. Its P/E is negative, reflecting losses, but the P/B of 1.7 is neutral and valuation less extended. The company pays no dividend, focusing heavily on R&D (80.8% of revenue) to fuel growth, a typical profile for an emerging tech firm.
Premium Valuation vs. Growth Challenges
Texas Instruments offers a compelling blend of profitability and shareholder returns but trades at a premium, presenting valuation risk. indie Semiconductor shows high operational risk with persistent losses but invests aggressively in innovation. Investors seeking stable income may prefer Texas Instruments, while those seeking growth exposure might consider indie’s developmental profile.
Which one offers the Superior Shareholder Reward?
I observe Texas Instruments (TXN) delivers a superior shareholder reward compared to indie Semiconductor (INDI). TXN pays a consistent dividend yield near 3.17% with a payout ratio close to 100%, fully supported by free cash flow of 2.86/share. Its buyback program remains active, enhancing total returns. Conversely, INDI pays no dividend, suffers persistent losses, and negative cash flows, relying heavily on reinvestment for growth. TXN’s distribution model is sustainable and aligned with its strong profitability and cash generation. INDI’s model carries high risk, given negative margins and debt leverage. For 2026, TXN clearly offers the more attractive total return profile.
Comparative Score Analysis: The Strategic Profile
The radar chart reveals the fundamental DNA and trade-offs of Texas Instruments and indie Semiconductor, highlighting divergent strengths and weaknesses:
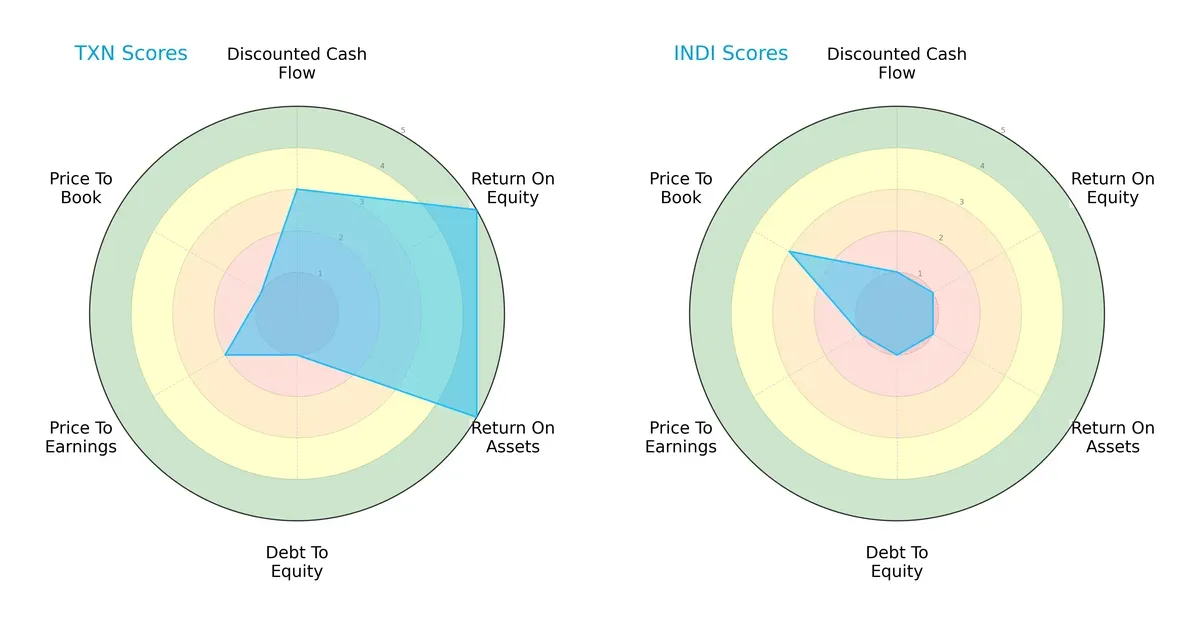
Texas Instruments dominates in profitability with top ROE and ROA scores (5 each), signaling efficient capital and asset use. Indie Semiconductor lags significantly, scoring 1 across these metrics, indicating operational challenges. Both share a poor debt-to-equity score of 1, exposing financial leverage risks. Texas Instruments shows moderate valuation scores (PE 2, PB 1), suggesting cautious market pricing, while Indie Semiconductor’s higher PB score (3) hints at market skepticism. Overall, Texas Instruments presents a more balanced profile with clear operational strengths, whereas Indie Semiconductor relies on limited valuation appeal but struggles fundamentally.
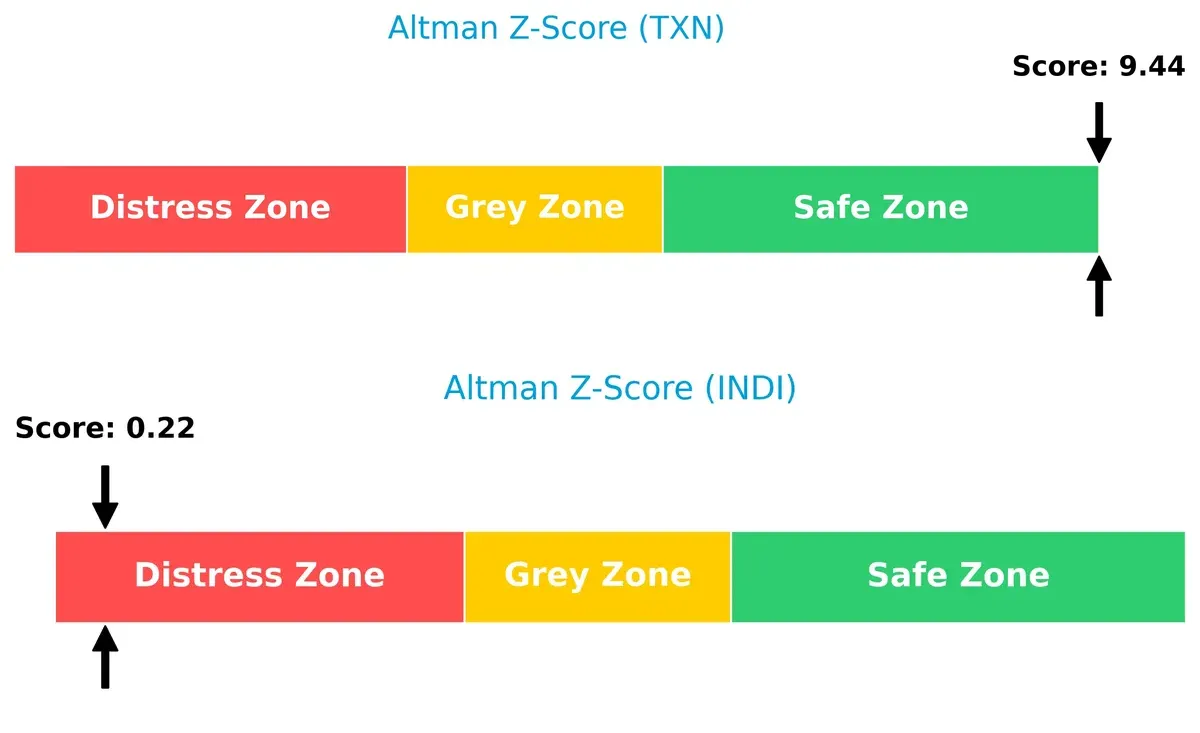
Bankruptcy Risk: Solvency Showdown
Texas Instruments’ Altman Z-Score of 9.44 places it firmly in the safe zone, reflecting robust financial stability and low bankruptcy risk. Indie Semiconductor’s score of 0.22 signals distress, implying a high likelihood of financial distress or failure in this cycle:
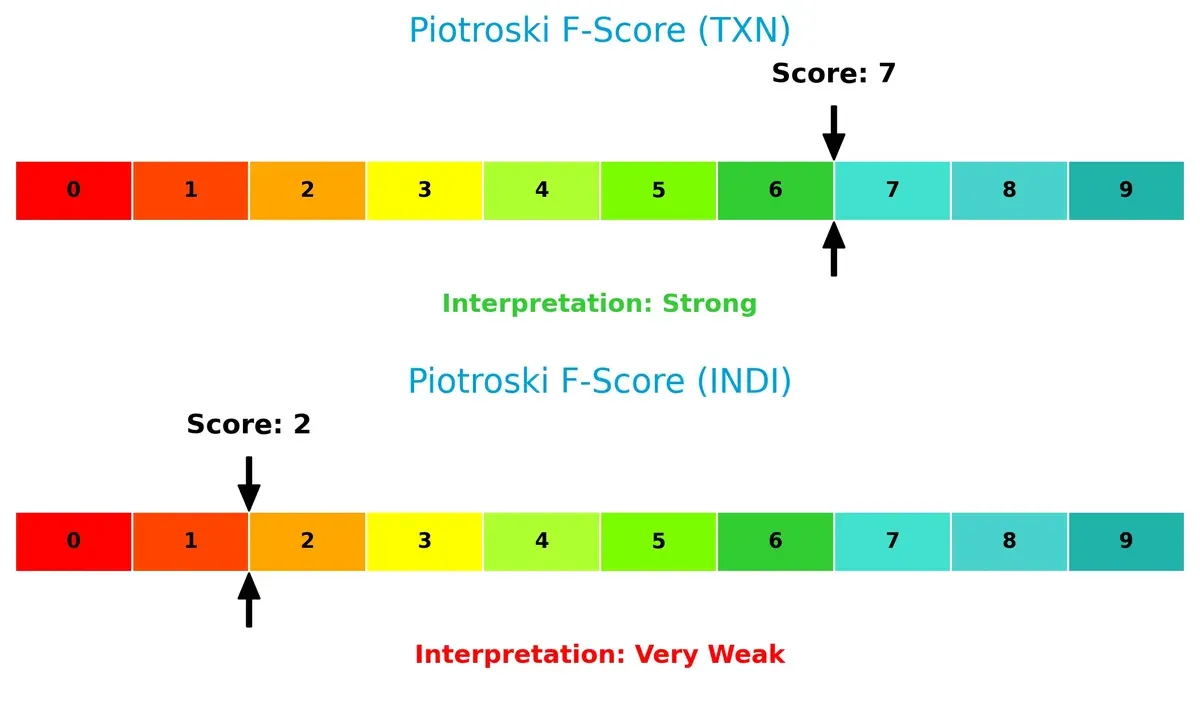
Financial Health: Quality of Operations
Texas Instruments scores a strong 7 on the Piotroski F-Score, indicating solid financial health with strong profitability, liquidity, and operational efficiency. Indie Semiconductor’s weak score of 2 flags significant red flags in internal metrics and financial quality:
How are the two companies positioned?
This section dissects the operational DNA of Texas Instruments and indie Semiconductor by comparing revenue distribution and internal dynamics. The goal is to confront their economic moats to reveal which model offers the most resilient competitive advantage today.
Revenue Segmentation: The Strategic Mix
This comparison dissects how Texas Instruments and indie Semiconductor diversify income streams, highlighting their primary sector bets and strategic focus in 2024:
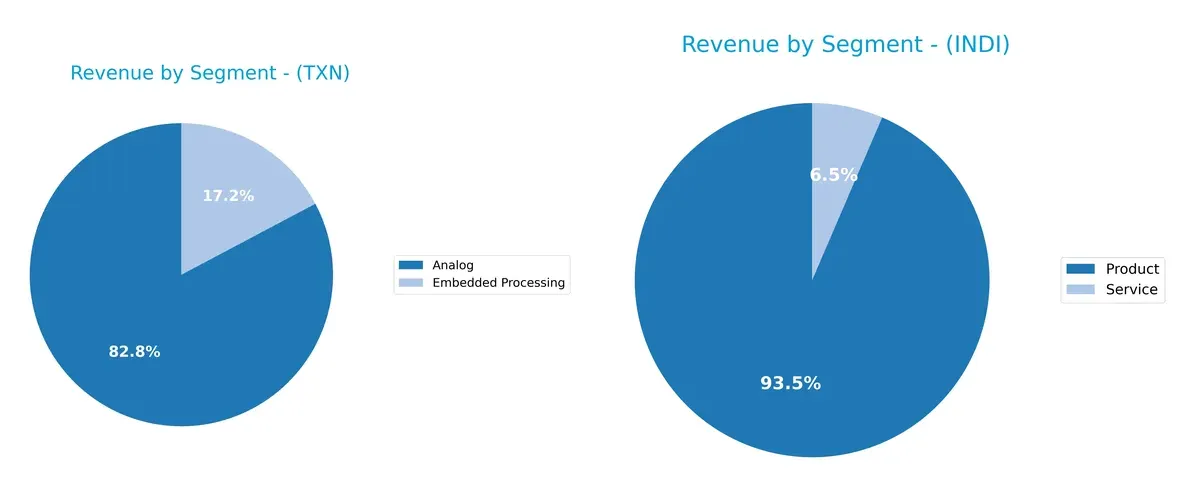
Texas Instruments anchors revenue heavily in Analog, generating $12.2B in 2024, with Embedded Processing adding $2.5B, showing moderate diversification. indie Semiconductor pivots on Product sales, $203M, overshadowing its $14M Service segment. TXN’s Analog dominance signals infrastructure strength and ecosystem lock-in but exposes it to semiconductor cycle swings. INDI’s concentrated Product reliance implies higher risk but potential for rapid scaling if market demand surges.
Strengths and Weaknesses Comparison
This table compares the Strengths and Weaknesses of Texas Instruments and indie Semiconductor:
Texas Instruments Strengths
- Strong profitability with 28.28% net margin and 30.73% ROE
- Favorable ROIC at 16.52%, exceeding WACC
- Diversified revenue streams across Analog and Embedded Processing
- Global presence with significant sales in US, China, and EMEA
- Solid quick ratio of 2.83 indicates liquidity
- Consistent dividend yield at 3.17%
indie Semiconductor Strengths
- Favorable PE ratio of -5.35 reflects growth potential
- High quick ratio of 4.23 shows good short-term liquidity
- Neutral PB ratio at 1.7 suggests reasonable valuation
- Strong fixed asset turnover at 4.3 indicates efficient asset use
- Expanding product sales with growing US and China market exposure
- Presence in multiple regions including US, China, and Europe
Texas Instruments Weaknesses
- Unfavorable PE (31.53) and PB (9.69) ratios imply high valuation
- Current ratio of 4.35 flagged as unfavorable, potential working capital inefficiency
- Moderate debt-to-equity ratio at 0.86 is neutral but warrants monitoring
- Asset turnover at 0.51 suggests room for operational improvement
- Market concentration risk with Analog segment dominating revenue
- Dividend yield might limit reinvestment in innovation
indie Semiconductor Weaknesses
- Negative profitability with -61.2% net margin and -31.73% ROE
- Unfavorable ROIC (-19.25%) below WACC signals value destruction
- Negative interest coverage ratio (-14.8) indicates financial stress
- Low asset turnover at 0.23 reflects inefficiency
- No dividend yield, limiting income appeal
- Heavy dependence on US and China markets may increase risk
Texas Instruments demonstrates strong profitability and global diversification but faces valuation and efficiency concerns. Indie Semiconductor shows liquidity and asset use strengths but struggles with profitability and financial health, impacting its growth outlook.
The Moat Duel: Analyzing Competitive Defensibility
A structural moat is the sole shield guarding long-term profits from relentless competitive erosion. Let’s dissect these firms’ moats:
Texas Instruments Incorporated: Durable Cost Advantage
Texas Instruments leverages a cost advantage rooted in scale and manufacturing efficiency. Its strong ROIC above WACC reflects sustained value creation despite a recent decline. New analog and embedded processing markets could deepen its moat in 2026.
indie Semiconductor, Inc.: Emerging Innovation Moat
indie Semiconductor’s moat hinges on cutting-edge automotive semiconductor innovation, a stark contrast to Texas Instruments’ scale-driven moat. However, a negative ROIC signals value destruction. Expansion in advanced driver-assistance systems could disrupt markets if profitability improves.
Scale Efficiency vs. Innovation Risk: Texas Instruments Holds the Edge
Texas Instruments boasts a wider, more durable moat with consistent value creation and strong margin stability. indie Semiconductor’s innovation potential is promising but currently overshadowed by unprofitable operations. Texas Instruments remains better equipped to defend market share in 2026.
Which stock offers better returns?
Over the past year, Texas Instruments surged 25%, showing accelerating gains and strong buyer dominance, while indie Semiconductor declined sharply with a bearish trajectory despite a modest recent rebound.
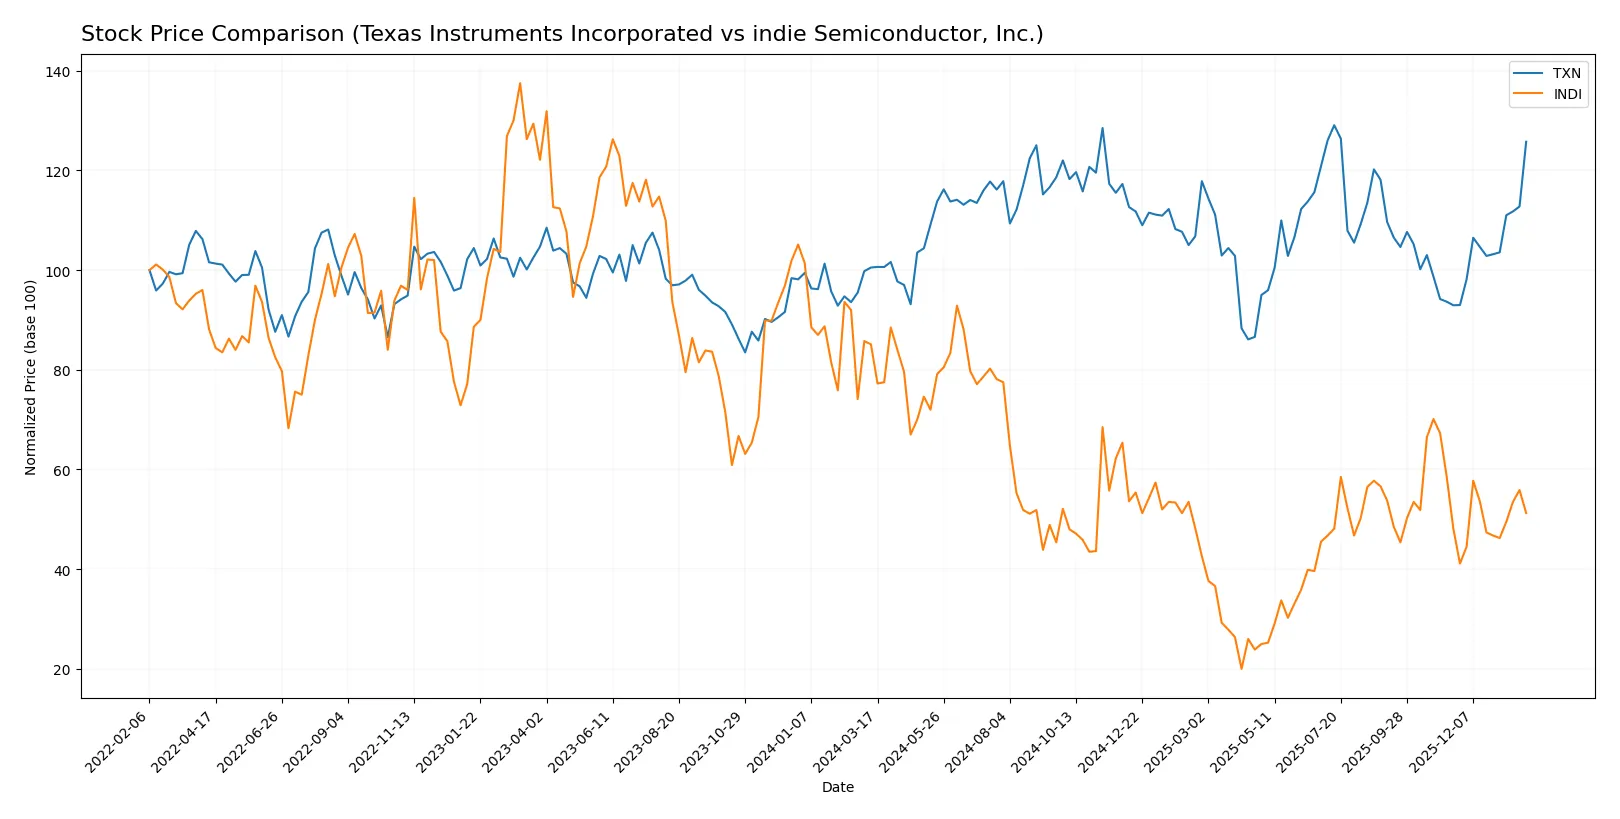
Trend Comparison
Texas Instruments recorded a 25.1% price increase over 12 months, marking a bullish trend with accelerating momentum and a high volatility level (std dev 15.92). The stock peaked at 221.25 and bottomed at 147.6.
indie Semiconductor fell 39.79% during the same period, reflecting a bearish trend with acceleration but low volatility (std dev 1.32). It reached a high of 7.43 and a low of 1.6.
Texas Instruments outperformed indie Semiconductor by a wide margin, delivering strong positive returns versus a significant decline for indie Semiconductor over the past year.
Target Prices
Analysts present a clear consensus on target prices for Texas Instruments and indie Semiconductor.
| Company | Target Low | Target High | Consensus |
|---|---|---|---|
| Texas Instruments Incorporated | 160 | 260 | 204.64 |
| indie Semiconductor, Inc. | 8 | 8 | 8 |
The consensus target for Texas Instruments sits slightly below its current 215.55 stock price, suggesting moderate upside potential. indie Semiconductor’s target is set at 8, nearly double its 4.1 market price, reflecting high growth expectations but also elevated risk.

Don’t Let Luck Decide Your Entry Point
Optimize your entry points with our advanced ProRealTime indicators. You’ll get efficient buy signals with precise price targets for maximum performance. Start outperforming now!
How do institutions grade them?
The following tables summarize recent institutional grades for Texas Instruments Incorporated and indie Semiconductor, Inc.:
Texas Instruments Incorporated Grades
This table presents the latest grades assigned by major financial institutions for Texas Instruments Incorporated.
| Grading Company | Action | New Grade | Date |
|---|---|---|---|
| Mizuho | Maintain | Underperform | 2026-01-28 |
| Goldman Sachs | Maintain | Sell | 2026-01-28 |
| B of A Securities | Upgrade | Neutral | 2026-01-28 |
| Wells Fargo | Maintain | Equal Weight | 2026-01-28 |
| Benchmark | Maintain | Buy | 2026-01-28 |
| Rosenblatt | Maintain | Buy | 2026-01-28 |
| JP Morgan | Maintain | Overweight | 2026-01-28 |
| Deutsche Bank | Maintain | Hold | 2026-01-28 |
| Cantor Fitzgerald | Maintain | Neutral | 2026-01-28 |
| Truist Securities | Maintain | Hold | 2026-01-28 |
indie Semiconductor, Inc. Grades
This table presents recent grades issued by reputable institutions for indie Semiconductor, Inc.
| Grading Company | Action | New Grade | Date |
|---|---|---|---|
| UBS | Maintain | Neutral | 2025-11-10 |
| Benchmark | Maintain | Buy | 2025-06-25 |
| Benchmark | Maintain | Buy | 2025-06-11 |
| Benchmark | Maintain | Buy | 2025-05-21 |
| Benchmark | Maintain | Buy | 2025-05-13 |
| Craig-Hallum | Maintain | Buy | 2025-05-13 |
| Keybanc | Maintain | Overweight | 2025-05-13 |
| Benchmark | Maintain | Buy | 2025-04-09 |
| Benchmark | Maintain | Buy | 2025-02-21 |
| Keybanc | Maintain | Overweight | 2025-02-21 |
Which company has the best grades?
indie Semiconductor consistently receives Buy and Overweight ratings from multiple firms, indicating stronger institutional optimism. Texas Instruments shows a mixed profile with several Underperform and Sell grades, suggesting cautious sentiment. Investors should note these contrasts when assessing risk and potential rewards.
Risks specific to each company
The following categories identify the critical pressure points and systemic threats facing both firms in the 2026 market environment:
1. Market & Competition
Texas Instruments Incorporated
- Established market leader with a broad product portfolio and strong analog segment dominance.
indie Semiconductor, Inc.
- Smaller player focused on automotive semiconductors, facing intense competition and niche market risks.
2. Capital Structure & Debt
Texas Instruments Incorporated
- Moderate leverage with debt-to-assets at 40.62%, interest coverage strong at 11.52x.
indie Semiconductor, Inc.
- Similar leverage ratio at 42.34%, but negative interest coverage (-14.8x) signals financial distress.
3. Stock Volatility
Texas Instruments Incorporated
- Beta near 1 (0.988), indicating market-level volatility and relative stability.
indie Semiconductor, Inc.
- High beta (2.54) reflects significant price swings and speculative risk.
4. Regulatory & Legal
Texas Instruments Incorporated
- Operating globally in semiconductors subject to export controls and IP regulations.
indie Semiconductor, Inc.
- Automotive focus exposes it to stringent safety and emissions regulations, increasing compliance risk.
5. Supply Chain & Operations
Texas Instruments Incorporated
- Strong operational track record with diversified suppliers; supply chain resilience evident.
indie Semiconductor, Inc.
- Smaller scale and emerging status heighten vulnerability to supply disruptions and capacity constraints.
6. ESG & Climate Transition
Texas Instruments Incorporated
- Established ESG programs, but significant energy use in manufacturing could pressure transition costs.
indie Semiconductor, Inc.
- Automotive sector focus demands rapid adaptation to electric vehicle trends and sustainability standards.
7. Geopolitical Exposure
Texas Instruments Incorporated
- Exposure to US-China tensions affecting semiconductor trade and sourcing.
indie Semiconductor, Inc.
- Similar exposure compounded by reliance on automotive supply chains sensitive to geopolitical shifts.
Which company shows a better risk-adjusted profile?
Texas Instruments faces its biggest threat in market competition but demonstrates robust financial health and operational strength. indie Semiconductor struggles most with capital structure and financial distress signals. TXN’s stable beta and strong interest coverage contrast sharply with INDI’s high volatility and negative coverage ratio. This gap places TXN clearly ahead on a risk-adjusted basis, underscored by its Altman Z-score in the safe zone (9.44) versus INDI’s distress zone (0.22). The data confirm TXN’s resilience despite a premium valuation, while INDI’s financial fragility and high beta raise caution flags for investors.
Final Verdict: Which stock to choose?
Texas Instruments demonstrates a superpower in delivering consistent value creation through its efficient capital allocation and robust profitability. Its declining ROIC trend is a point of vigilance, signaling the need to watch for potential margin pressures. It fits well in portfolios seeking steady income with moderate growth—classic Dividend Growth.
indie Semiconductor’s strategic moat lies in its heavy investment in R&D, aiming to carve a niche in semiconductor innovation. However, its financial instability and negative returns present considerable risks compared to Texas Instruments. This makes it a speculative choice suited for high-risk, high-reward growth investors.
If you prioritize reliable cash flow and proven economic moats, Texas Instruments outshines as the compelling choice due to its strong profitability and financial resilience. However, if you seek asymmetric growth potential and can tolerate volatility, indie Semiconductor offers a speculative avenue with innovation upside but carries significant financial risk.
Disclaimer: Investment carries a risk of loss of initial capital. The past performance is not a reliable indicator of future results. Be sure to understand risks before making an investment decision.
Go Further
I encourage you to read the complete analyses of Texas Instruments Incorporated and indie Semiconductor, Inc. to enhance your investment decisions: