Home > Comparison > Technology > TXN vs GFS
The strategic rivalry between Texas Instruments Incorporated and GLOBALFOUNDRIES Inc. shapes the semiconductor industry’s future. Texas Instruments excels as a diversified semiconductor designer with strong analog and embedded processing segments. GLOBALFOUNDRIES operates as a capital-intensive foundry focusing on wafer fabrication and integrated circuit manufacturing. This analysis compares their operational models and growth trajectories to identify which offers superior risk-adjusted returns for a diversified portfolio in 2026.
Table of contents
Companies Overview
Texas Instruments and GLOBALFOUNDRIES represent key pillars in the semiconductor industry with distinct business models and market roles.
Texas Instruments Incorporated: Analog and Embedded Processing Powerhouse
Texas Instruments leads as a semiconductor designer and manufacturer specializing in analog and embedded processing products. It generates revenue primarily by selling power management and signal chain components alongside microcontrollers and digital signal processors. In 2026, TI emphasizes innovation in power-efficient solutions tailored for industrial, automotive, and communication markets, reinforcing its competitive advantage in diversified semiconductor applications.
GLOBALFOUNDRIES Inc.: Premier Semiconductor Foundry
GLOBALFOUNDRIES operates as a dedicated semiconductor foundry, focusing on manufacturing integrated circuits for various electronic devices. Its revenue stems from wafer fabrication services producing microprocessors, RF modems, and power management units. In 2026, the company prioritizes expanding its advanced manufacturing capabilities to meet growing demand across mobile, networking, and automotive sectors, solidifying its position as a critical contract manufacturer.
Strategic Collision: Similarities & Divergences
Texas Instruments pursues a closed ecosystem driven by proprietary semiconductor design, contrasting GLOBALFOUNDRIES’ open foundry model serving external chip designers. Their primary battleground is the semiconductor value chain—TI controls design and production, while GLOBALFOUNDRIES focuses solely on manufacturing. This divergence creates distinct investment profiles: TI offers integrated innovation with stable market reach, while GLOBALFOUNDRIES presents growth potential tied to foundry capacity expansion and client diversification.
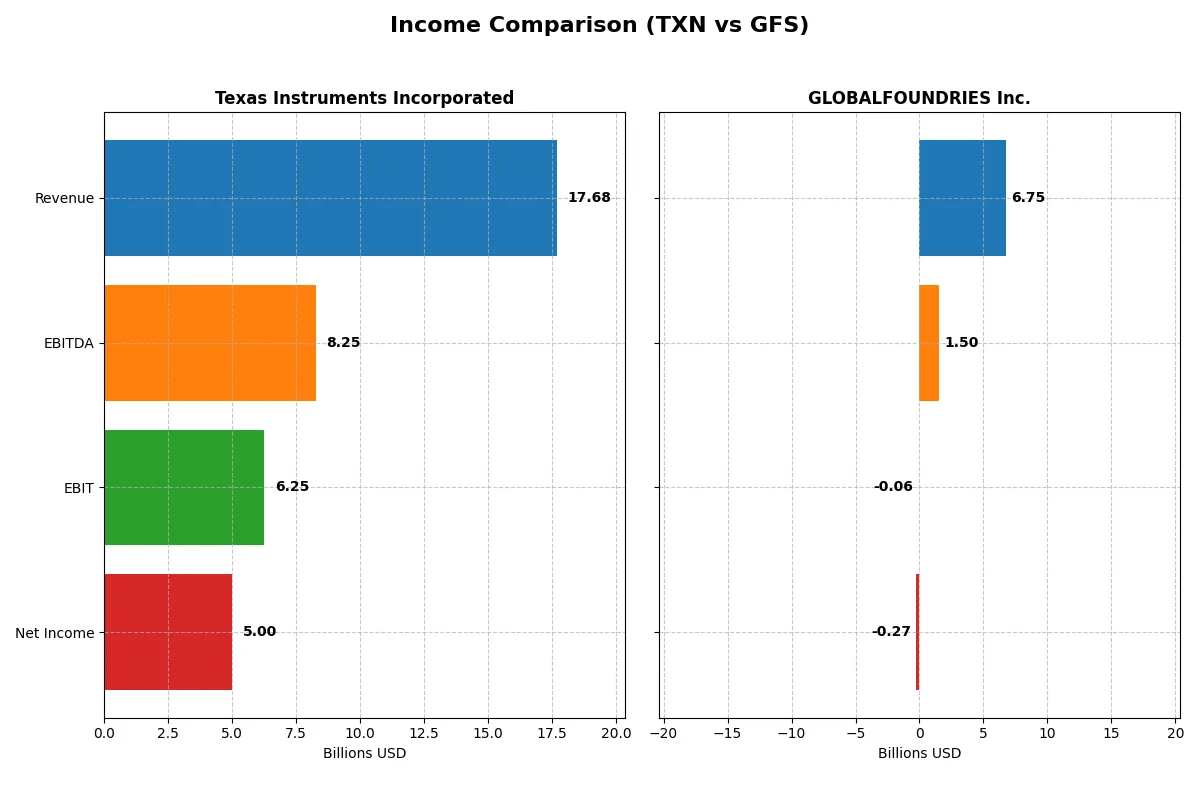
Income Statement Comparison
This comparison dissects the core profitability and scalability of both corporate engines to reveal who dominates the bottom line:
| Metric | Texas Instruments (TXN) | GLOBALFOUNDRIES (GFS) |
|---|---|---|
| Revenue | 17.7B | 6.75B |
| Cost of Revenue | 7.6B | 5.1B |
| Operating Expenses | 4.1B | 1.9B |
| Gross Profit | 10.1B | 1.7B |
| EBITDA | 8.3B | 1.5B |
| EBIT | 6.3B | -64M |
| Interest Expense | 543M | 145M |
| Net Income | 5.0B | -265M |
| EPS | 5.45 | -0.48 |
| Fiscal Year | 2025 | 2024 |
Income Statement Analysis: The Bottom-Line Duel
This income statement comparison reveals which company runs a more efficient and profitable corporate engine through recent performance metrics.
Texas Instruments Incorporated Analysis
Texas Instruments’ revenue showed fluctuations, peaking at 20B in 2022 before settling at 17.7B in 2025. Net income declined from 8.7B in 2022 to 5B in 2025, signaling margin pressures. However, the firm sustains a strong gross margin of 57% and a net margin near 28%, reflecting disciplined cost control and operational efficiency in 2025.
GLOBALFOUNDRIES Inc. Analysis
GLOBALFOUNDRIES’ revenue rose steadily from 4.9B in 2020 to 7.4B in 2023 but dropped to 6.75B in 2024. Its net income swung from a significant loss of 1.35B in 2020 to a 1B profit in 2023, then fell back to a 265M loss in 2024. The gross margin remains thin at 24%, and negative EBIT and net margins highlight ongoing profitability challenges.
Margin Strength vs. Profitability Struggles
Texas Instruments dominates with high and stable margins despite recent net income declines. GLOBALFOUNDRIES’ revenue growth is overshadowed by poor profitability and margin erosion. From a fundamental standpoint, Texas Instruments presents a more robust income statement profile. Investors seeking profit stability will find Texas Instruments’ efficiency more attractive than GLOBALFOUNDRIES’ volatile earnings.
Financial Ratios Comparison
These vital ratios act as a diagnostic tool to expose the underlying fiscal health, valuation premiums, and capital efficiency of the companies compared below:
| Ratios | Texas Instruments Incorporated (TXN) | GLOBALFOUNDRIES Inc. (GFS) |
|---|---|---|
| ROE | 30.7% | -2.5% |
| ROIC | 16.5% | -1.5% |
| P/E | 31.5 | -89.5 |
| P/B | 9.7 | 2.2 |
| Current Ratio | 4.35 | 2.11 |
| Quick Ratio | 2.83 | 1.57 |
| D/E (Debt-to-Equity) | 0.86 | 0.22 |
| Debt-to-Assets | 40.6% | 13.8% |
| Interest Coverage | 11.1 | -1.48 |
| Asset Turnover | 0.51 | 0.40 |
| Fixed Asset Turnover | 1.44 | 0.82 |
| Payout ratio | 100% | 0% |
| Dividend yield | 3.17% | 0% |
| Fiscal Year | 2025 | 2024 |
Efficiency & Valuation Duel: The Vital Signs
Financial ratios act as a company’s DNA, uncovering hidden risks and revealing operational excellence beyond surface-level metrics.
Texas Instruments Incorporated
Texas Instruments delivers strong profitability with a 30.7% ROE and a robust 28.3% net margin, reflecting operational efficiency. The stock trades at a stretched P/E of 31.5 and a high P/B of 9.7, indicating premium valuation. It rewards shareholders with a solid 3.17% dividend yield, balancing growth investments and steady returns.
GLOBALFOUNDRIES Inc.
GLOBALFOUNDRIES struggles with negative profitability metrics, posting a -2.46% ROE and -3.93% net margin, signaling operational challenges. Its P/E is negative but considered favorable due to loss-making status; the P/B sits at a moderate 2.2. The company offers no dividends, focusing instead on reinvestment amid financial strain and weak coverage ratios.
Premium Valuation vs. Operational Safety
Texas Instruments shows a superior balance of profitability and shareholder returns despite a stretched valuation. GLOBALFOUNDRIES faces significant operational headwinds and lacks income generation. Investors seeking stability and income may prefer Texas Instruments, while those targeting turnaround potential might consider GLOBALFOUNDRIES’ riskier profile.
Which one offers the Superior Shareholder Reward?
I see Texas Instruments (TXN) offers a clear dividend yield near 3.2% with a payout ratio around 100%, fully backed by consistent free cash flow above 2.8B. TXN also deploys capital through steady buybacks, enhancing shareholder value sustainably. GLOBALFOUNDRIES (GFS) pays no dividend, reinvesting FCF (~2B) into growth amid volatile margins and negative net profits recently. Its buyback activity is minimal, reflecting financial caution. Historically, TXN’s balanced distribution combining dividends and buybacks outperforms GFS’s reinvestment-only model. For 2026, TXN delivers a superior total return profile with a more reliable and sustainable shareholder reward.
Comparative Score Analysis: The Strategic Profile
The radar chart reveals the fundamental DNA and strategic trade-offs of Texas Instruments and GLOBALFOUNDRIES Inc.:
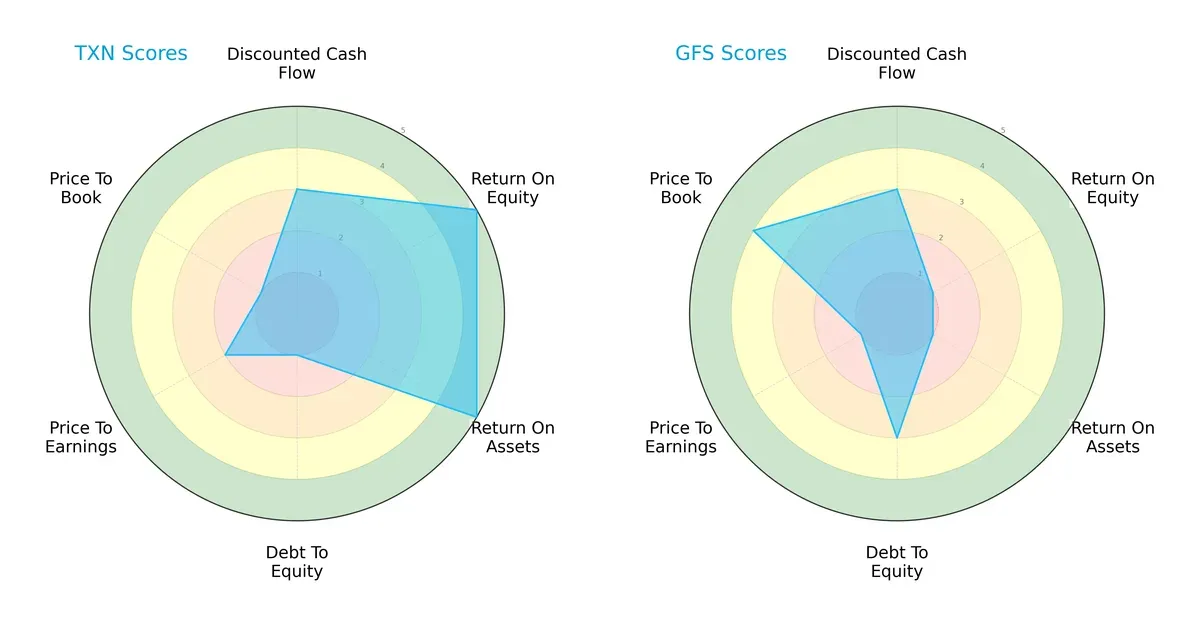
Texas Instruments demonstrates strong operational efficiency with very favorable ROE and ROA scores (5 each), but its balance sheet is stretched, reflected by a very unfavorable debt-to-equity score (1). GLOBALFOUNDRIES shows moderate debt management (3) and a favorable price-to-book valuation (4) but struggles with profitability metrics, scoring very low on ROE (1) and ROA (1). TI offers a more balanced profile driven by operational strength, while GLOBALFOUNDRIES relies on valuation appeal despite weaker returns.
Bankruptcy Risk: Solvency Showdown
Texas Instruments scores 9.44, substantially higher than GLOBALFOUNDRIES’ 3.01, signaling a significantly stronger solvency position in this cycle:
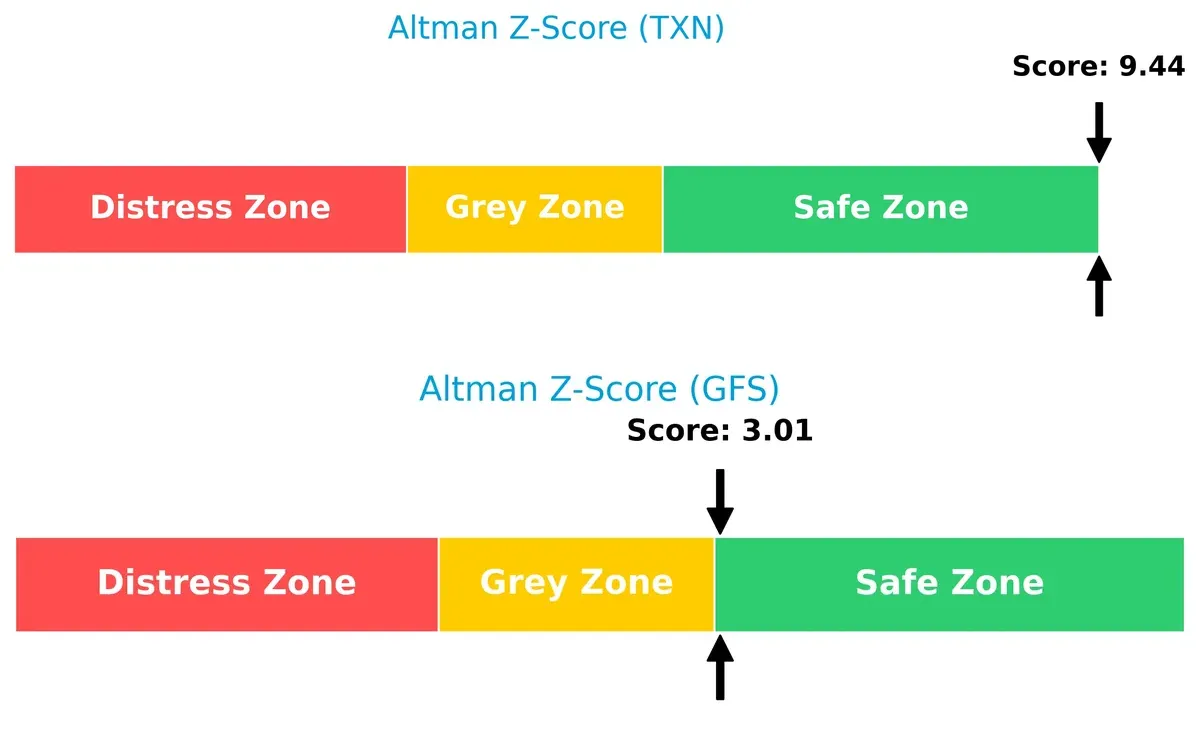
TI’s robust Altman Z-Score places it well within the safe zone, indicating low bankruptcy risk. GLOBALFOUNDRIES is just above the safe zone threshold, implying higher vulnerability if economic conditions deteriorate.
Financial Health: Quality of Operations
Texas Instruments’ Piotroski F-Score of 7 outperforms GLOBALFOUNDRIES’ 6, reflecting stronger internal financial health and operational quality:
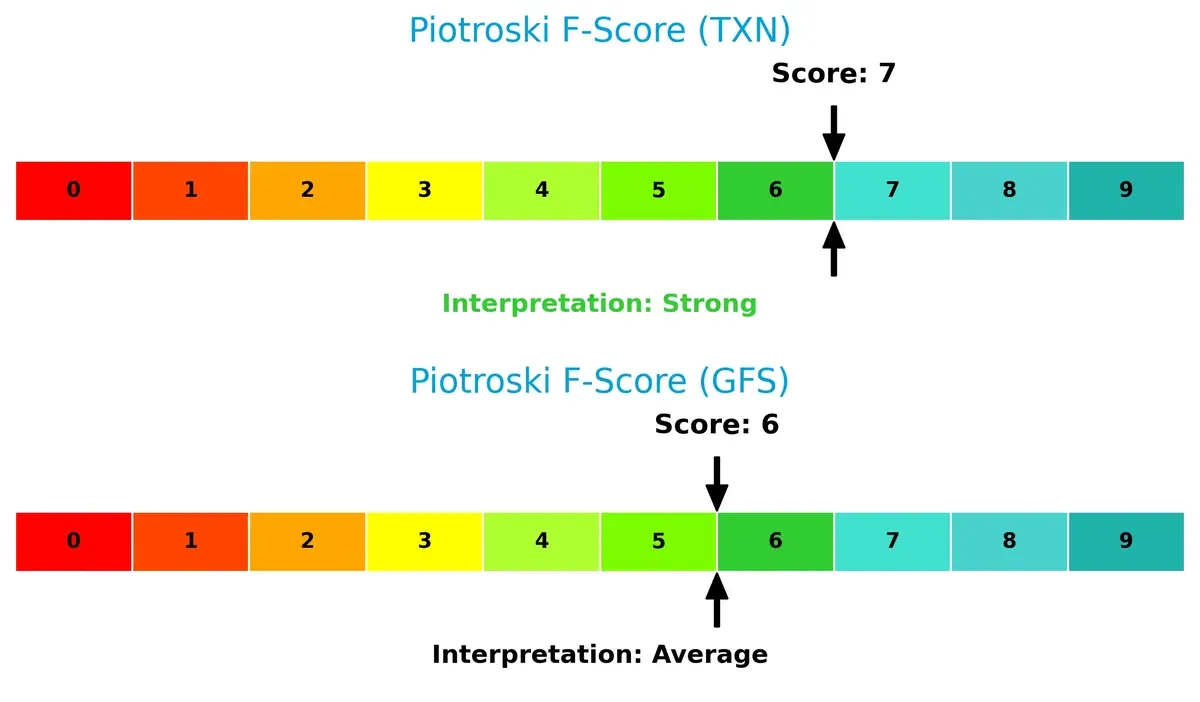
TI’s higher score suggests more consistent profitability, liquidity, and efficiency metrics. GLOBALFOUNDRIES’ slightly lower score may signal emerging red flags in internal controls or asset management. Investors should monitor GFS for potential financial weaknesses.
How are the two companies positioned?
This section dissects TXN and GFS’s operational DNA by comparing their revenue distribution and internal strengths and weaknesses. The goal is to confront their economic moats and identify which model delivers the most resilient, sustainable competitive advantage today.
Revenue Segmentation: The Strategic Mix
The following visual comparison dissects how Texas Instruments and GLOBALFOUNDRIES diversify their income streams and where their primary sector bets lie:
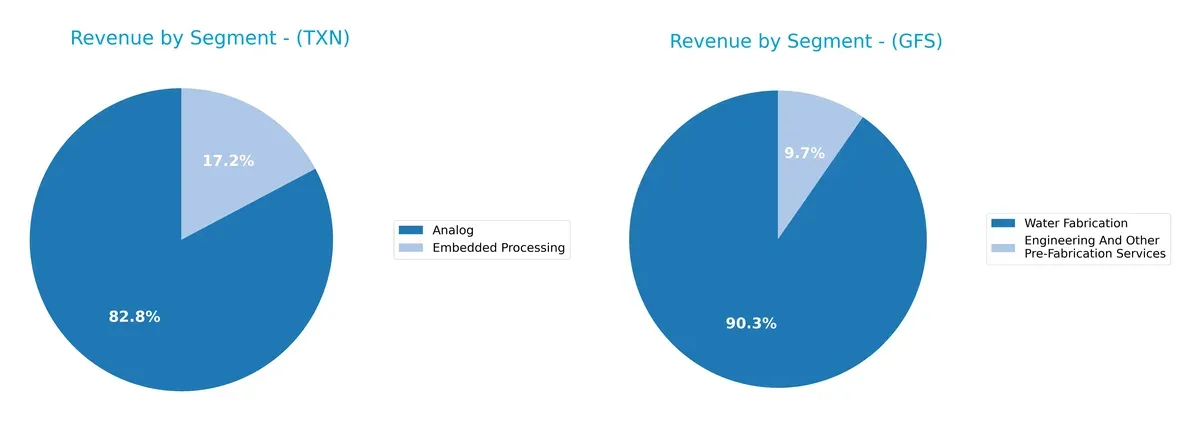
Texas Instruments anchors its revenue heavily in Analog, generating $12.2B in 2024, with Embedded Processing contributing $2.5B. This mix shows moderate diversification but a clear dependence on Analog. GLOBALFOUNDRIES pivots almost entirely on Water Fabrication, which dwarfs its $652M Engineering segment with $6.1B revenue. TI’s strategy reflects ecosystem lock-in in semiconductors, while GFS carries more concentration risk tied to fabrication demand.
Strengths and Weaknesses Comparison
This table compares the strengths and weaknesses of Texas Instruments (TXN) and GLOBALFOUNDRIES (GFS):
TXN Strengths
- Diverse revenue from Analog and Embedded Processing segments
- Strong profitability with 28.3% net margin and 30.7% ROE
- High quick ratio at 2.83 indicating liquidity
- Solid interest coverage at 11.52
- Global presence across US, China, EMEA, and Asia
- Dividend yield of 3.17% supports shareholder returns
GFS Strengths
- Favorable low debt-to-equity at 0.22 and debt-to-assets at 13.8%
- Positive current and quick ratios above 1.5 show liquidity
- Diverse revenue streams in Water Fabrication and Engineering Services
- US market dominates revenue with 3.7B in 2024
- Lower P/E ratio indicates potential undervaluation
TXN Weaknesses
- Elevated current ratio of 4.35 may signal inefficient asset use
- Unfavorable high P/E (31.5) and P/B (9.69) ratios
- Moderate debt levels with 40.6% debt-to-assets
- Asset turnover at 0.51 is only neutral, limiting operational efficiency
GFS Weaknesses
- Negative profitability metrics: net margin -3.9%, ROE -2.5%, ROIC -1.5%
- Unfavorable WACC at 10.4% exceeds returns
- Negative interest coverage (-0.44) risks solvency
- Lower asset turnover ratios reduce capital efficiency
- No dividend yield, limiting income appeal
Both companies show contrasting financial health and market positions. TXN’s strong profitability and global diversification drive resilience but its valuation appears stretched. GFS benefits from lower leverage and liquidity yet suffers from persistent losses and weak returns, challenging its operational effectiveness and growth strategy.
The Moat Duel: Analyzing Competitive Defensibility
A structural moat alone protects long-term profits from relentless competitive erosion. Let’s dissect how Texas Instruments and GLOBALFOUNDRIES defend their turf:
Texas Instruments Incorporated: Master of Intangible Assets
Texas Instruments leverages deep intangible assets, including proprietary analog and embedded processing technologies. This moat drives a strong 28% net margin and a ROIC well above WACC, although profitability is slowly declining. Their expansion into automotive and industrial markets in 2026 could reinforce this advantage.
GLOBALFOUNDRIES Inc.: Emerging Cost Advantage Challenger
GLOBALFOUNDRIES relies on cost advantage via advanced wafer fabrication scale, contrasting TI’s tech moat. Despite negative net margins and ROIC below WACC, its improving ROIC trend signals operational progress. New capacity and tech upgrades in 2026 may disrupt market share dynamics.
Intangible Assets vs. Cost Advantage: Depth of Moats in Semiconductor Giants
Texas Instruments holds a wider, more established moat with consistent value creation despite margin pressure. GLOBALFOUNDRIES’ improving ROIC hints at a developing moat but still trails TI. TI remains better positioned to defend long-term market share against growing competition.
Which stock offers better returns?
Texas Instruments and GLOBALFOUNDRIES displayed contrasting price trends over the past year, with TXN showing strong gains and GFS experiencing notable declines amid shifting trading dynamics.
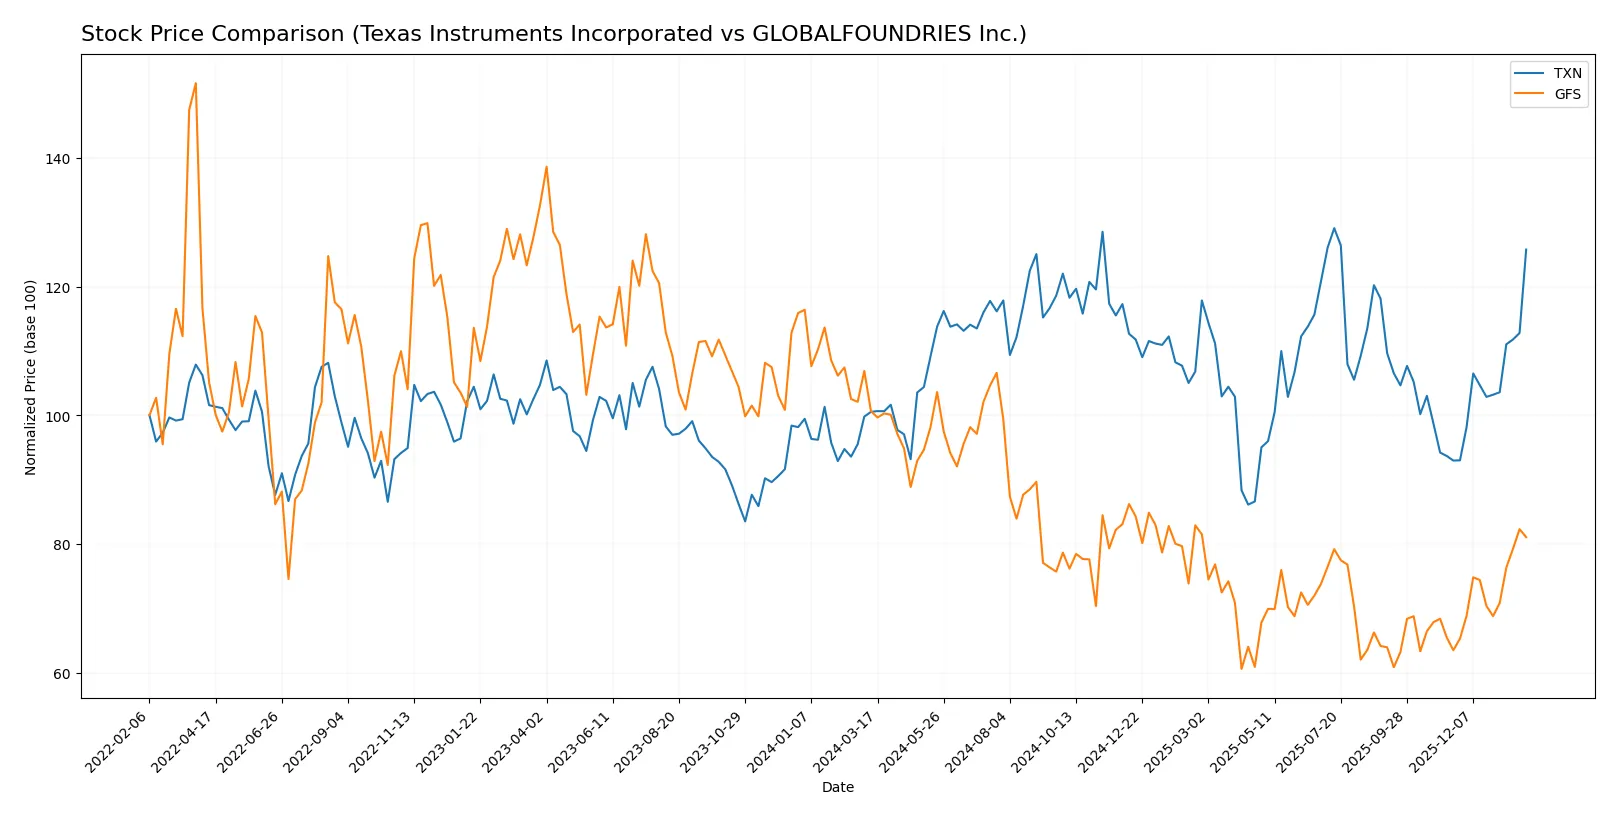
Trend Comparison
Texas Instruments posted a bullish 25.1% rise over the past 12 months, accelerating with high volatility (15.92 std dev) and a peak at 221.25. The recent trend strengthened further with a 35.29% gain.
GLOBALFOUNDRIES endured a bearish 19.48% drop over the same period despite accelerating trend dynamics and lower volatility (6.18 std dev), hitting a low of 31.54. The recent 27.69% rebound shows early recovery signs.
TXN outperformed GFS substantially in market performance, delivering sustained gains while GFS struggled but showed some recent price recovery.
Target Prices
The current analyst consensus shows a mixed outlook for these semiconductor companies.
| Company | Target Low | Target High | Consensus |
|---|---|---|---|
| Texas Instruments Incorporated | 160 | 260 | 204.64 |
| GLOBALFOUNDRIES Inc. | 37 | 40 | 38.5 |
Texas Instruments’ consensus target of 204.64 is below its current price of 215.55, suggesting modest downside risk. GLOBALFOUNDRIES’ consensus target of 38.5 is also below its current price of 42.2, indicating cautious market expectations.

Don’t Let Luck Decide Your Entry Point
Optimize your entry points with our advanced ProRealTime indicators. You’ll get efficient buy signals with precise price targets for maximum performance. Start outperforming now!
How do institutions grade them?
The latest institutional grades for Texas Instruments Incorporated and GLOBALFOUNDRIES Inc. are as follows:
Texas Instruments Incorporated Grades
The table below summarizes recent analyst grades from reputable institutions for Texas Instruments Incorporated.
| Grading Company | Action | New Grade | Date |
|---|---|---|---|
| Mizuho | Maintain | Underperform | 2026-01-28 |
| Goldman Sachs | Maintain | Sell | 2026-01-28 |
| B of A Securities | Upgrade | Neutral | 2026-01-28 |
| Wells Fargo | Maintain | Equal Weight | 2026-01-28 |
| Benchmark | Maintain | Buy | 2026-01-28 |
| Rosenblatt | Maintain | Buy | 2026-01-28 |
| JP Morgan | Maintain | Overweight | 2026-01-28 |
| Deutsche Bank | Maintain | Hold | 2026-01-28 |
| Cantor Fitzgerald | Maintain | Neutral | 2026-01-28 |
| Truist Securities | Maintain | Hold | 2026-01-28 |
GLOBALFOUNDRIES Inc. Grades
The following table presents recent analyst grades for GLOBALFOUNDRIES Inc. from leading firms.
| Grading Company | Action | New Grade | Date |
|---|---|---|---|
| Citigroup | Maintain | Neutral | 2026-01-15 |
| Wedbush | Downgrade | Neutral | 2025-12-31 |
| B of A Securities | Maintain | Underperform | 2025-12-04 |
| Citigroup | Maintain | Neutral | 2025-11-13 |
| Evercore ISI Group | Maintain | Outperform | 2025-11-13 |
| JP Morgan | Maintain | Neutral | 2025-11-13 |
| Wedbush | Maintain | Outperform | 2025-11-13 |
| B of A Securities | Downgrade | Underperform | 2025-10-13 |
| Wedbush | Maintain | Outperform | 2025-08-06 |
| Morgan Stanley | Maintain | Equal Weight | 2025-08-06 |
Which company has the best grades?
Texas Instruments displays a wider range of grades, including multiple “Buy” and “Overweight” ratings, while GLOBALFOUNDRIES mostly receives “Neutral” and “Underperform” grades. Investors may interpret Texas Instruments’ stronger endorsements as signals of comparatively better market sentiment.
Risks specific to each company
The following categories identify the critical pressure points and systemic threats facing both firms in the 2026 market environment:
1. Market & Competition
Texas Instruments Incorporated
- Strong market position in analog and embedded semiconductors with broad diversification.
GLOBALFOUNDRIES Inc.
- Focused on foundry services, facing intense competition from larger foundries like TSMC and Samsung.
2. Capital Structure & Debt
Texas Instruments Incorporated
- Moderate leverage with debt-to-assets at 40.62%, interest coverage strong at 11.52x.
GLOBALFOUNDRIES Inc.
- Low leverage at 13.81% debt-to-assets, but negative interest coverage signals financial strain.
3. Stock Volatility
Texas Instruments Incorporated
- Beta near 1.0 (0.988), indicating average market volatility.
GLOBALFOUNDRIES Inc.
- Higher beta of 1.485, implying greater stock price fluctuations and risk.
4. Regulatory & Legal
Texas Instruments Incorporated
- US-based with standard sector regulatory risks; stable compliance history.
GLOBALFOUNDRIES Inc.
- US-based foundry with exposure to export controls and IP regulations impacting semiconductor manufacturing.
5. Supply Chain & Operations
Texas Instruments Incorporated
- Diversified supply chain with strong operational efficiency and asset turnover.
GLOBALFOUNDRIES Inc.
- Foundry operations dependent on advanced wafer fabrication equipment with potential supply bottlenecks.
6. ESG & Climate Transition
Texas Instruments Incorporated
- Increasing ESG initiatives; benefits from stable energy sourcing and waste management.
GLOBALFOUNDRIES Inc.
- High energy consumption in fabrication could pose challenges amid tightening climate regulations.
7. Geopolitical Exposure
Texas Instruments Incorporated
- Limited direct geopolitical risks; some exposure to global semiconductor demand cycles.
GLOBALFOUNDRIES Inc.
- Vulnerable to US-China tech tensions affecting supply chains and customer base.
Which company shows a better risk-adjusted profile?
Texas Instruments faces its biggest risk in market competition with high valuation metrics posing a premium risk. GLOBALFOUNDRIES struggles most with capital structure, reflected in poor profitability and negative interest coverage. Despite higher volatility, Texas Instruments’ strong financial health and safer Altman Z-score make it the better risk-adjusted choice in 2026. The sharp contrast in profitability and debt servicing signals caution for GLOBALFOUNDRIES investors.
Final Verdict: Which stock to choose?
Texas Instruments Incorporated (TXN) stands out for its unmatched capital efficiency and robust economic moat, consistently generating returns well above its cost of capital. Its main point of vigilance lies in a somewhat stretched valuation and a high current ratio, which could signal inventory or working capital management challenges. TXN fits well into an Aggressive Growth portfolio seeking reliable cash flow generation and steady profitability.
GLOBALFOUNDRIES Inc. (GFS) offers a strategic moat rooted in its lean balance sheet and capacity for free cash flow yield, providing a cushion in volatile markets. Despite struggling with profitability and value creation, its lower leverage and improving ROIC trend give it a defensive profile relative to TXN. GFS suits a GARP (Growth at a Reasonable Price) portfolio, appealing to investors willing to tolerate near-term earnings challenges for potential operational turnaround.
If you prioritize proven value creation and consistent profitability, TXN is the compelling choice due to its strong moat and cash generation. However, if you seek potential upside through improving fundamentals and capital discipline in a risk-managed way, GFS offers better stability and a more reasonable entry point. Both companies present distinct analytical scenarios aligned with different investor risk appetites and strategic focuses.
Disclaimer: Investment carries a risk of loss of initial capital. The past performance is not a reliable indicator of future results. Be sure to understand risks before making an investment decision.
Go Further
I encourage you to read the complete analyses of Texas Instruments Incorporated and GLOBALFOUNDRIES Inc. to enhance your investment decisions: