Home > Comparison > Technology > TXN vs CEVA
The strategic rivalry between Texas Instruments Incorporated and CEVA, Inc. shapes the semiconductor industry’s future. Texas Instruments operates as a capital-intensive semiconductor manufacturer with broad analog and embedded processing products. CEVA, in contrast, focuses on licensing wireless connectivity and smart sensing IP, emphasizing innovation over manufacturing. This analysis will weigh their divergent business models to identify which offers the superior risk-adjusted return and resilience for a diversified portfolio in a competitive technology landscape.
Table of contents
Companies Overview
Texas Instruments and CEVA stand as prominent players in the semiconductor industry with distinct market roles.
Texas Instruments Incorporated: Semiconductor Powerhouse
Texas Instruments dominates the semiconductor sector with a focus on analog and embedded processing segments. It generates revenue by designing and selling semiconductors for power management, signal processing, and embedded applications across industrial and automotive markets. In 2026, its strategic emphasis remains on expanding product offerings in power solutions and microcontrollers, reinforcing its leadership in diverse electronics components.
CEVA, Inc.: Wireless Connectivity Innovator
CEVA specializes in licensing digital signal processors and AI technology to semiconductor and OEM companies globally. It earns primarily through licensing fees for its wireless platforms, AI processors, and sensor fusion software used in mobile, IoT, and automotive devices. The company’s 2026 strategy targets scaling its footprint in 5G baseband processing and smart sensing to capture growth in connectivity and AI-driven applications.
Strategic Collision: Similarities & Divergences
While both operate in semiconductors, Texas Instruments favors a product-centric model focusing on manufacturing and sales, contrasting CEVA’s licensing-based, IP-driven approach. They compete indirectly in sensor and processing markets but target different value chain stages. TXN offers stability with broad industrial exposure, whereas CEVA presents a high-beta profile relying on innovation licensing, appealing to investors seeking growth in wireless and AI domains.
Income Statement Comparison
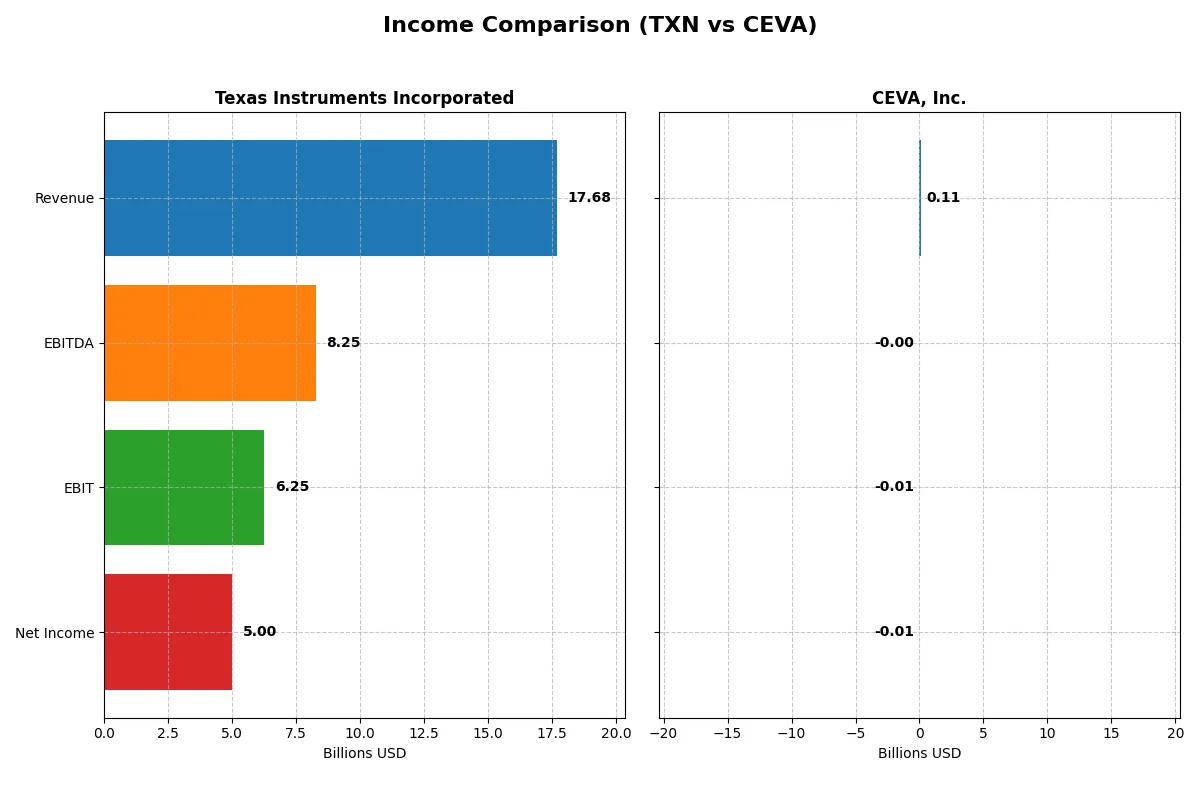
The following data dissects the core profitability and scalability of both corporate engines to reveal who dominates the bottom line:
| Metric | Texas Instruments Incorporated (TXN) | CEVA, Inc. (CEVA) |
|---|---|---|
| Revenue | 17.7B | 107M |
| Cost of Revenue | 7.6B | 13M |
| Operating Expenses | 4.1B | 102M |
| Gross Profit | 10.1B | 94M |
| EBITDA | 8.3B | -3.4M |
| EBIT | 6.3B | -7.5M |
| Interest Expense | 543M | 0 |
| Net Income | 5.0B | -8.8M |
| EPS | 5.45 | -0.37 |
| Fiscal Year | 2025 | 2024 |
Income Statement Analysis: The Bottom-Line Duel
This income statement comparison exposes the true operational efficiency and profitability of two semiconductor-focused companies over recent years.
Texas Instruments Incorporated Analysis
Texas Instruments (TXN) shows a robust revenue trajectory, growing from $18.3B in 2021 to $17.7B in 2025, with a brief dip. Net income declined sharply from $7.7B in 2021 to $5B in 2025, reflecting margin compression. Its gross margin remains solid at 57%, while net margin at 28% confirms sustained profitability. The 2025 figures reveal efficient cost control despite a slight net margin drop.
CEVA, Inc. Analysis
CEVA’s revenue increased from $100M in 2020 to $107M in 2024, indicating modest growth. However, net income remains negative, narrowing losses from -$23M in 2022 to -$9M in 2024. Its gross margin is exceptionally high at 88%, but negative EBIT and net margins highlight ongoing operational challenges. The 2024 results hint at momentum improving through reducing losses and positive EBIT growth.
Margin Strength vs. Profit Scale
Texas Instruments leads with large-scale revenue and strong positive margins, delivering consistent profits, despite recent income softness. CEVA shows impressive gross margin but struggles to turn losses into profits, reflecting early-stage operational hurdles. For investors, TXN’s profile offers stability and scale, while CEVA’s remains high-risk with potential upside if profitability improves.
Financial Ratios Comparison
These vital ratios act as a diagnostic tool to expose the underlying fiscal health, valuation premiums, and capital efficiency of the companies compared below:
| Ratios | Texas Instruments Incorporated (TXN) | CEVA, Inc. (CEVA) |
|---|---|---|
| ROE | 30.7% | -3.3% |
| ROIC | 16.5% | -2.7% |
| P/E | 31.5 | -84.8 |
| P/B | 9.69 | 2.79 |
| Current Ratio | 4.35 | 7.09 |
| Quick Ratio | 2.83 | 7.09 |
| D/E | 0.86 | 0.02 |
| Debt-to-Assets | 40.6% | 1.8% |
| Interest Coverage | 11.1 | 0 |
| Asset Turnover | 0.51 | 0.35 |
| Fixed Asset Turnover | 1.44 | 8.43 |
| Payout ratio | 100% | 0 |
| Dividend yield | 3.17% | 0 |
| Fiscal Year | 2025 | 2024 |
Efficiency & Valuation Duel: The Vital Signs
Financial ratios serve as a company’s DNA, exposing operational strengths and hidden risks beneath surface-level results.
Texas Instruments Incorporated
Texas Instruments posts a robust ROE of 30.7% and a healthy net margin of 28.3%, signaling strong profitability. However, its P/E of 31.5 and P/B of 9.7 suggest a stretched valuation. The firm rewards shareholders with a 3.17% dividend yield, balancing returns between income and reinvestment in R&D.
CEVA, Inc.
CEVA struggles with negative profitability, showing a -3.3% ROE and an -8.2% net margin, flagging operational inefficiencies. Despite a low P/B of 2.8, its P/E is negative, reflecting losses. The company offers no dividend, instead funneling capital heavily into R&D at nearly 67% of revenue to pursue growth.
Premium Valuation vs. Operational Struggles
Texas Instruments delivers superior profitability but trades at a premium, reflecting market confidence and stable shareholder returns. CEVA’s low valuation masks ongoing losses and high investment risks. Investors prioritizing steady income and proven efficiency may favor Texas Instruments, while growth seekers might accept CEVA’s riskier profile.
Which one offers the Superior Shareholder Reward?
Texas Instruments Incorporated (TXN) pays a solid 3.17% dividend yield with a near 100% payout ratio, fully supported by steady free cash flow of 2.86B in 2025. Its share buybacks are consistent, reflecting a shareholder-friendly capital allocation strategy. CEVA, Inc. (CEVA) pays no dividends and posts negative profit margins, relying heavily on reinvestment in R&D and growth, but its free cash flow is minimal at 22M with negligible buybacks. I see TXN’s disciplined dividend and buyback model as more sustainable and rewarding for long-term investors in 2026, outperforming CEVA’s speculative growth approach.
Comparative Score Analysis: The Strategic Profile
The radar chart reveals the fundamental DNA and trade-offs of Texas Instruments and CEVA, Inc., highlighting their distinct financial strengths and weaknesses:
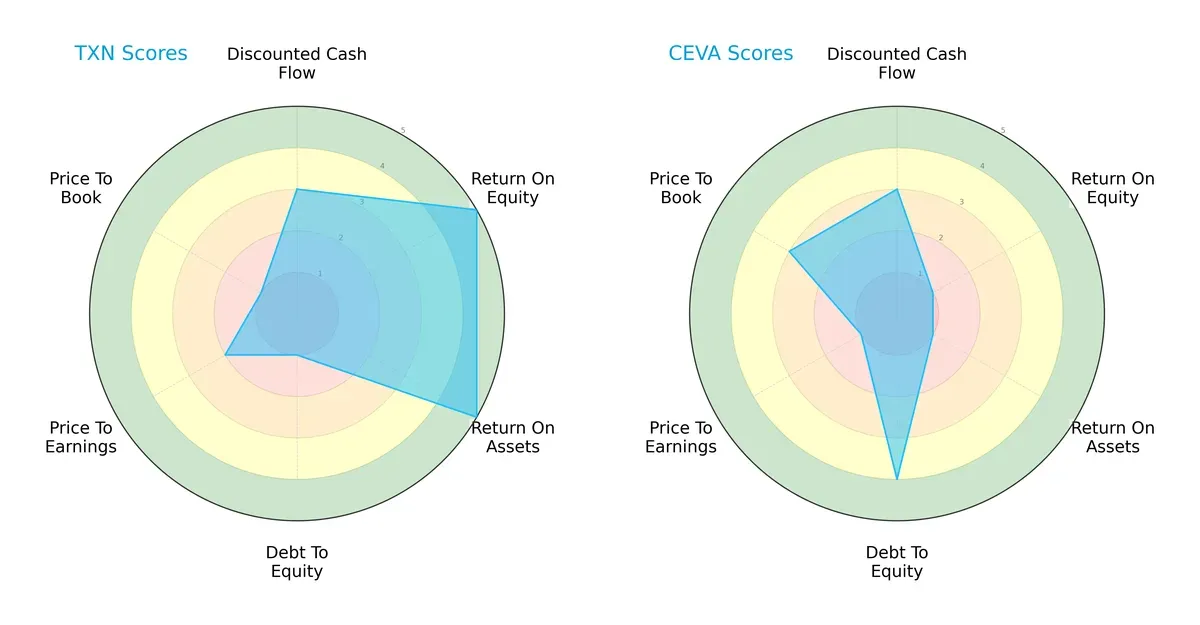
Texas Instruments shows a balanced profile with very favorable ROE and ROA, but it carries high financial risk due to a very unfavorable debt-to-equity score. CEVA, Inc. leans on a strong balance sheet with favorable debt management but suffers from weak profitability metrics and undervaluation risks. TI’s operational efficiency contrasts with CEVA’s conservative leverage, illustrating two distinct strategic approaches.
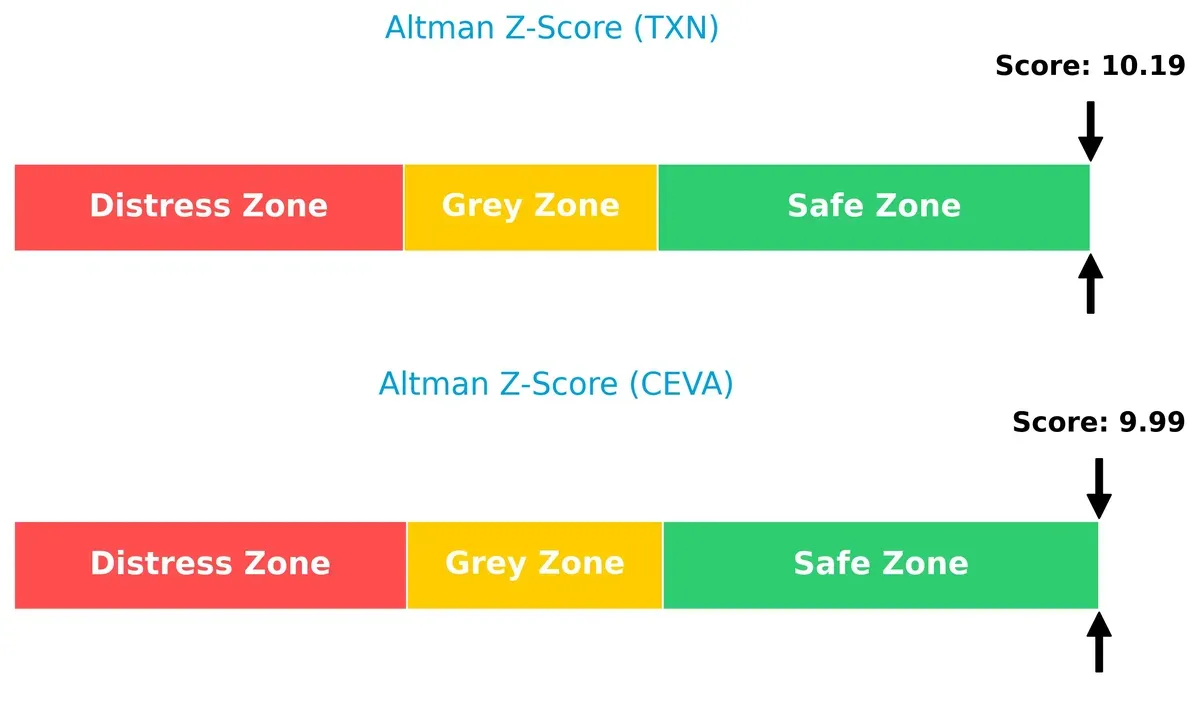
Bankruptcy Risk: Solvency Showdown
Texas Instruments and CEVA both sit comfortably in the safe zone, with Altman Z-Scores above 9, indicating strong financial stability for long-term survival in this cycle:
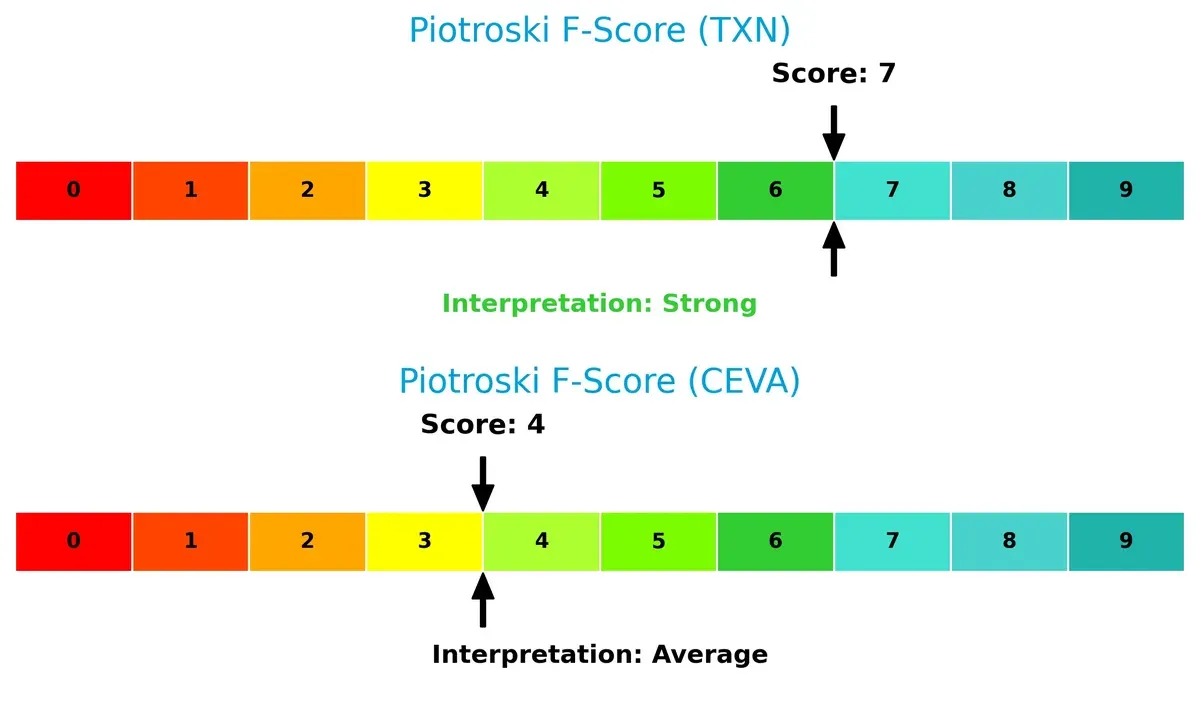
Financial Health: Quality of Operations
Texas Instruments scores a strong 7 on the Piotroski F-Score, signaling robust financial health, while CEVA’s average 4 hints at potential red flags in internal operations and efficiency:
How are the two companies positioned?
This section dissects the operational DNA of Texas Instruments and CEVA by comparing their revenue distribution and internal dynamics. The goal is to confront their economic moats to identify the most resilient, sustainable competitive advantage today.
Revenue Segmentation: The Strategic Mix
This visual comparison dissects how Texas Instruments and CEVA diversify their income streams and where their primary sector bets lie:
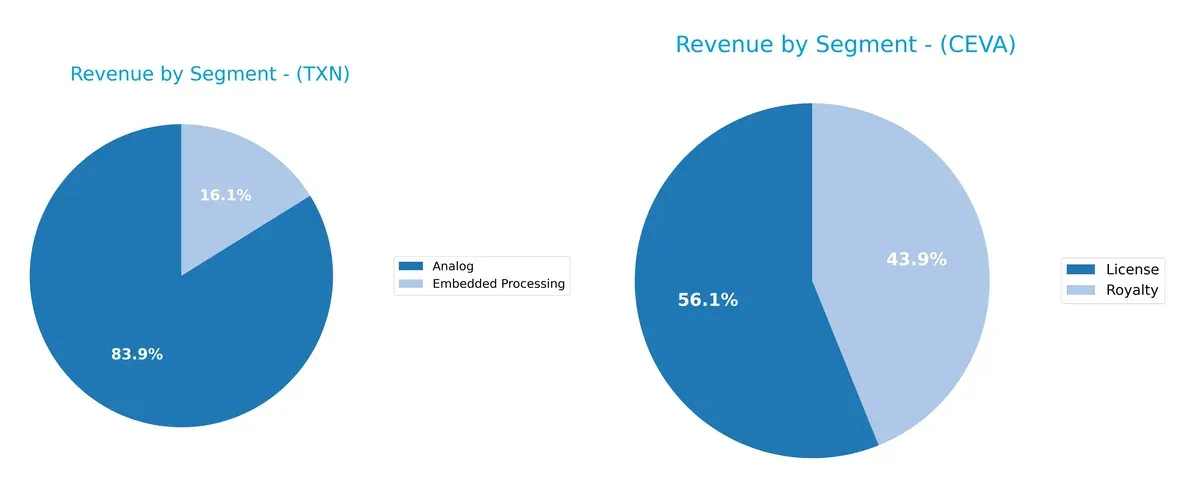
Texas Instruments anchors its revenue in Analog, generating $14B in 2025, dwarfing its $2.7B Embedded Processing segment. CEVA’s revenue splits between License ($60M) and Royalty ($47M) streams in 2024, showing a more balanced mix. TI’s heavy reliance on Analog signals concentration risk but also infrastructure dominance. CEVA’s diversified licensing and royalty model pivots on intellectual property, reducing exposure to a single market segment.
Strengths and Weaknesses Comparison
This table compares the strengths and weaknesses of Texas Instruments and CEVA based on diversification, profitability, financials, innovation, global presence, and market share:
Texas Instruments Strengths
- Strong profitability with 28.3% net margin and 30.7% ROE
- Favorable quick ratio at 2.83 indicates liquidity
- High interest coverage of 11.52 supports debt service
- Diverse revenue streams across Analog and Embedded Processing
- Broad global presence with significant sales in US, China, and EMEA
CEVA Strengths
- Favorable debt metrics with D/E at 0.02 and 1.8% debt-to-assets
- Strong fixed asset turnover at 8.43 suggests efficient asset use
- Favorable quick ratio of 7.09 shows excellent short-term liquidity
- Diverse licensing and royalty revenues
- Global footprint includes Asia Pacific, US, and Europe
Texas Instruments Weaknesses
- Elevated P/E at 31.53 suggests overvaluation risk
- High PB ratio of 9.69 may indicate expensive stock
- Unfavorable current ratio of 4.35 raises working capital concerns
- Moderate debt level with 40.6% debt-to-assets
- Asset turnover at 0.51 is only neutral
- Dividend yield, while favorable, at 3.17% could pressure cash flow
CEVA Weaknesses
- Negative profitability with -8.2% net margin and -3.3% ROE
- Unfavorable WACC at 10.7% increases capital cost
- Zero interest coverage signals inability to cover interest expenses
- Negative ROIC of -2.7% indicates poor capital efficiency
- Unfavorable asset turnover at 0.35 limits revenue generation
- No dividend yield reduces shareholder income
Texas Instruments excels in profitability and global market reach but faces valuation and liquidity scrutiny. CEVA shows strength in capital structure and asset efficiency but struggles with profitability and cost of capital. These factors shape each company’s strategic focus on financial health and growth potential.
The Moat Duel: Analyzing Competitive Defensibility
A structural moat protects long-term profits from relentless competition erosion. Without it, firms face shrinking returns and margin pressure:
Texas Instruments Incorporated: Cost Advantage & Scale Moat
Texas Instruments leverages cost advantages and scale in analog semiconductors. Consistently high ROIC above WACC signals efficient capital use and margin stability. New industrial and automotive markets deepen this moat in 2026.
CEVA, Inc.: IP Licensing & Innovation Moat
CEVA’s moat rests on proprietary DSP and AI IP licensing. Unlike Texas Instruments’ scale moat, CEVA battles negative ROIC and value destruction. Growth hinges on expanding 5G and AI licenses to offset profitability pressures.
Scale & Cost Efficiency vs. IP Licensing Challenges
Texas Instruments holds a wider, more durable moat with positive ROIC and stable margins. CEVA’s very unfavorable moat signals risk and value erosion, making Texas Instruments better positioned to defend market share.
Which stock offers better returns?
The past year shows Texas Instruments’ stock surging with strong acceleration, while CEVA’s shares declined overall despite recent modest gains.
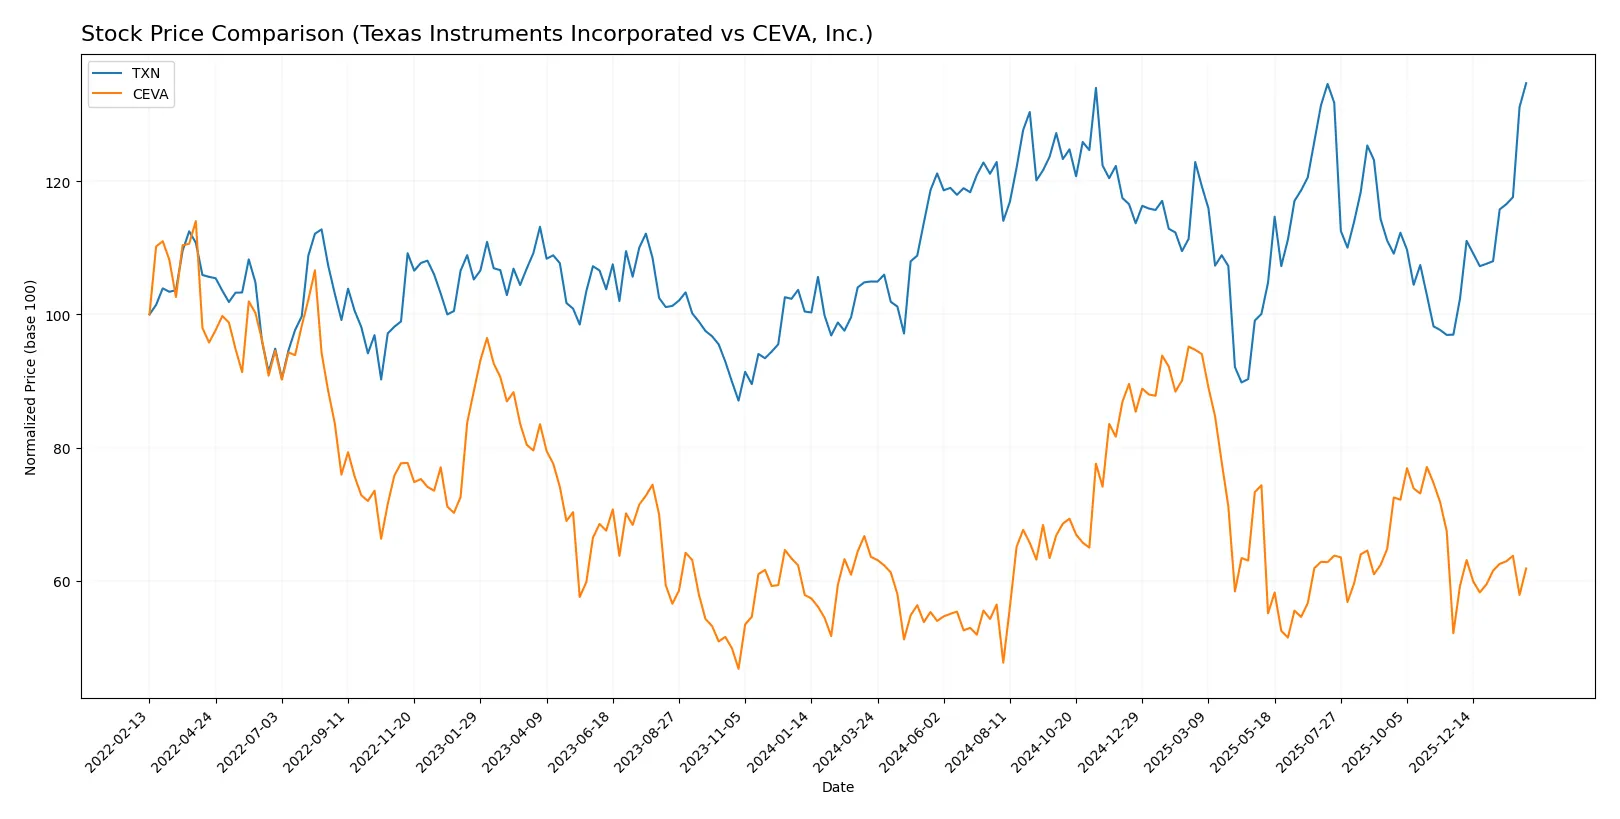
Trend Comparison
Texas Instruments delivered a bullish trend with a 28.36% price increase over 12 months and accelerating momentum. Its price ranged between 147.6 and 221.44, showing strong volatility (16.2 std dev).
CEVA posted a bearish trend, losing 2.72% over the same period despite recent acceleration. The stock fluctuated between 17.39 and 34.67 with lower volatility (4.41 std dev).
Texas Instruments outperformed CEVA, delivering the highest market return and stronger price momentum over the past year.
Target Prices
Analysts present a mixed but generally optimistic target consensus for Texas Instruments and CEVA.
| Company | Target Low | Target High | Consensus |
|---|---|---|---|
| Texas Instruments Incorporated | 160 | 260 | 204.64 |
| CEVA, Inc. | 28 | 28 | 28 |
Texas Instruments’ consensus target of 204.64 sits below its current price of 221.44, suggesting modest downside risk. CEVA’s target at 28 significantly exceeds its current 22.54 price, indicating strong analyst bullishness.

Don’t Let Luck Decide Your Entry Point
Optimize your entry points with our advanced ProRealTime indicators. You’ll get efficient buy signals with precise price targets for maximum performance. Start outperforming now!
How do institutions grade them?
Below are the recent institutional grades for Texas Instruments Incorporated and CEVA, Inc.:
Texas Instruments Incorporated Grades
The latest grades from major firms for Texas Instruments are summarized here.
| Grading Company | Action | New Grade | Date |
|---|---|---|---|
| Rosenblatt | Maintain | Buy | 2026-02-05 |
| JP Morgan | Maintain | Overweight | 2026-01-28 |
| Cantor Fitzgerald | Maintain | Neutral | 2026-01-28 |
| Wells Fargo | Maintain | Equal Weight | 2026-01-28 |
| Truist Securities | Maintain | Hold | 2026-01-28 |
| Stifel | Maintain | Hold | 2026-01-28 |
| UBS | Maintain | Buy | 2026-01-28 |
| Mizuho | Maintain | Underperform | 2026-01-28 |
| Jefferies | Maintain | Hold | 2026-01-28 |
| Benchmark | Maintain | Buy | 2026-01-28 |
CEVA, Inc. Grades
The table below shows recent grades from reputable firms for CEVA, Inc.
| Grading Company | Action | New Grade | Date |
|---|---|---|---|
| Barclays | Maintain | Overweight | 2025-11-12 |
| Rosenblatt | Maintain | Buy | 2025-11-11 |
| Rosenblatt | Maintain | Buy | 2025-08-14 |
| Oppenheimer | Maintain | Outperform | 2025-05-09 |
| Rosenblatt | Maintain | Buy | 2025-05-08 |
| Barclays | Maintain | Overweight | 2025-05-08 |
| Rosenblatt | Maintain | Buy | 2025-04-23 |
| Barclays | Maintain | Overweight | 2025-02-14 |
| Rosenblatt | Maintain | Buy | 2025-02-14 |
| Rosenblatt | Maintain | Buy | 2025-02-11 |
Which company has the best grades?
Texas Instruments shows a broader range of grades from buy to underperform, reflecting mixed analyst views. CEVA’s ratings consistently trend positive, with multiple buy and outperform grades. This suggests CEVA may currently enjoy stronger analyst confidence, potentially affecting investor sentiment.
Risks specific to each company
The following categories identify the critical pressure points and systemic threats facing both firms in the 2026 market environment:
1. Market & Competition
Texas Instruments Incorporated
- Dominates with large market cap and broad analog and embedded processing portfolio in semiconductors.
CEVA, Inc.
- Faces intense competition in specialized DSP IP licensing with smaller market cap and narrower niche.
2. Capital Structure & Debt
Texas Instruments Incorporated
- Moderate leverage (D/E 0.86), interest coverage strong at 11.52, signaling balanced capital structure.
CEVA, Inc.
- Minimal debt (D/E 0.02), but zero interest coverage indicates no earnings to cover interest expense.
3. Stock Volatility
Texas Instruments Incorporated
- Beta near 1 (0.995) suggests stock moves in line with market, implying moderate volatility.
CEVA, Inc.
- Higher beta (1.497) exposes stock to amplified market swings, increasing risk.
4. Regulatory & Legal
Texas Instruments Incorporated
- Large global footprint requires compliance with broad semiconductor regulations, but stable track record.
CEVA, Inc.
- Licensing business model faces IP protection and regulatory risks in global wireless standards.
5. Supply Chain & Operations
Texas Instruments Incorporated
- Vertically integrated with manufacturing capabilities, reducing supply chain disruptions risk.
CEVA, Inc.
- Relies on partners for chip manufacturing, increasing vulnerability to supply chain interruptions.
6. ESG & Climate Transition
Texas Instruments Incorporated
- Solid ESG initiatives expected given large scale, though energy-intensive manufacturing poses challenges.
CEVA, Inc.
- Smaller firm with less public ESG data; technology licensing may have lower direct emissions but less influence.
7. Geopolitical Exposure
Texas Instruments Incorporated
- Global sales and manufacturing expose TXN to US-China trade tensions and export controls.
CEVA, Inc.
- Licensing model less exposed to physical trade barriers but sensitive to IP law changes in different jurisdictions.
Which company shows a better risk-adjusted profile?
Texas Instruments faces significant market and geopolitical risks due to its scale but benefits from strong financial metrics and operational control. CEVA’s high volatility and weak profitability amplify risks despite minimal debt. TXN’s robust Altman Z-Score (10.19) and Piotroski score (7) position it firmly in the safe and strong zones, while CEVA lags with a lower Piotroski score (4) and similar Z-Score (9.99).
CEVA’s most impactful risk is its weak profitability and operational dependence on partners, while TXN’s primary risk lies in geopolitical exposure and valuation multiples. Overall, Texas Instruments shows a better risk-adjusted profile due to its financial strength and diversified business model, despite facing market headwinds. The widening valuation gap and CEVA’s negative net margin highlight the urgency of cautious allocation.
Final Verdict: Which stock to choose?
Texas Instruments Incorporated’s superpower lies in its exceptional capital efficiency and robust profitability, consistently generating returns well above its cost of capital. Its main point of vigilance is the declining ROIC trend, signaling potential pressure on long-term value creation. TXN suits portfolios focused on stable income and moderate growth.
CEVA, Inc. commands a strategic moat through its niche in advanced semiconductor IP, supported by a strong liquidity buffer and low debt levels. Compared to TXN, CEVA presents a higher risk profile with negative profitability but offers early-stage growth potential. It fits portfolios that tolerate volatility for asymmetric upside, such as speculative growth or turnaround plays.
If you prioritize durable value creation and steady income, Texas Instruments outshines with its proven moat and financial strength. However, if you seek speculative growth with a higher risk tolerance, CEVA offers a niche opportunity despite its current challenges. Each scenario demands rigorous risk management aligned with your investment horizon and objectives.
Disclaimer: Investment carries a risk of loss of initial capital. The past performance is not a reliable indicator of future results. Be sure to understand risks before making an investment decision.
Go Further
I encourage you to read the complete analyses of Texas Instruments Incorporated and CEVA, Inc. to enhance your investment decisions: