Home > Comparison > Technology > TER vs TSEM
The strategic rivalry between Teradyne, Inc. and Tower Semiconductor Ltd. shapes the semiconductor industry’s evolution. Teradyne, a diversified technology leader, excels in automated test equipment and industrial robotics. Tower Semiconductor operates as a specialized foundry focused on analog and mixed-signal wafers. This analysis pits Teradyne’s integrated operational breadth against Tower’s niche manufacturing expertise to identify which offers superior risk-adjusted returns for a balanced portfolio.
Table of contents
Companies Overview
Two key players shape semiconductor testing and manufacturing markets with distinct approaches and scale.
Teradyne, Inc.: Global Leader in Semiconductor Test Equipment
Teradyne dominates the semiconductor test equipment market, generating revenue by designing and selling automated test systems. Its latest strategy emphasizes expanding industrial automation and wireless test segments alongside semiconductor testing. Teradyne’s broad portfolio covers automotive, communications, consumer electronics, and cloud computing applications, supporting fabless companies and foundries worldwide.
Tower Semiconductor Ltd.: Specialist Foundry in Analog and Mixed-Signal
Tower Semiconductor stands out as an independent semiconductor foundry, focusing on analog-intensive mixed-signal devices. It earns revenue through wafer fabrication and customizable process technologies like SiGe and RF CMOS. The company prioritizes enhancing its design enablement platform and manufacturing services to serve diverse markets including automotive, aerospace, and medical devices in multiple global regions.
Strategic Collision: Similarities & Divergences
Teradyne and Tower operate in complementary yet distinct segments: Teradyne leads in testing equipment with a broad product range, while Tower focuses tightly on wafer manufacturing technology. Their primary competition lies in serving integrated device manufacturers and fabless companies, but Teradyne’s test platforms contrast with Tower’s fabrication capabilities. Investors face two distinct profiles—Teradyne’s diversified tech automation versus Tower’s specialized foundry services.
Income Statement Comparison
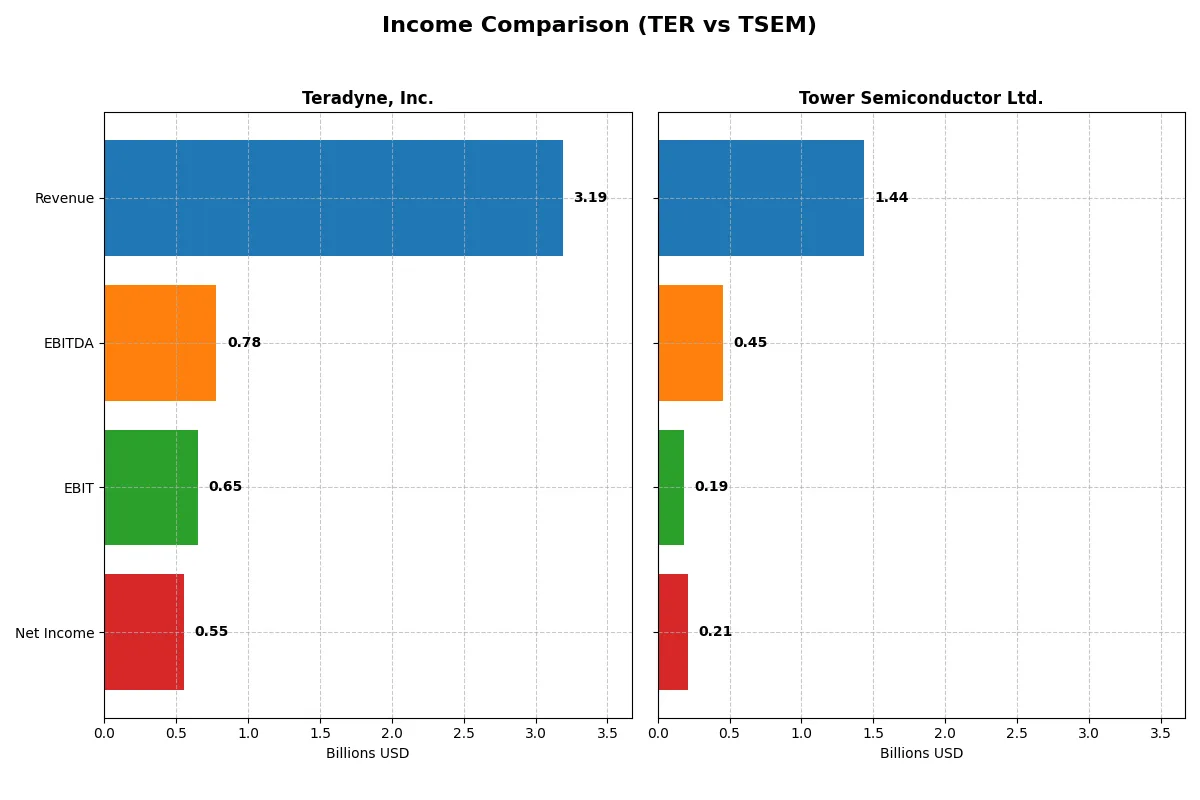
This data dissects the core profitability and scalability of both corporate engines to reveal who dominates the bottom line:
| Metric | Teradyne, Inc. (TER) | Tower Semiconductor Ltd. (TSEM) |
|---|---|---|
| Revenue | 3.19B | 1.44B |
| Cost of Revenue | 1.32B | 1.10B |
| Operating Expenses | 1.17B | 148M |
| Gross Profit | 1.87B | 339M |
| EBITDA | 780M | 451M |
| EBIT | 653M | 185M |
| Interest Expense | 8.0M | 5.9M |
| Net Income | 554M | 208M |
| EPS | 3.49 | 1.87 |
| Fiscal Year | 2025 | 2024 |
Income Statement Analysis: The Bottom-Line Duel
The income statement comparison reveals which company converts revenue into profit most efficiently, exposing the strength of each corporate engine.
Teradyne, Inc. Analysis
Teradyne’s revenue grew from $2.68B in 2023 to $3.19B in 2025, showing momentum despite a slight overall decline since 2021. Gross margin remains robust at 58.55%, and net margin holds firm at 17.37%, reflecting strong cost control. In 2025, Teradyne maintained favorable operational efficiency with an EBIT margin above 20%, signaling solid profitability.
Tower Semiconductor Ltd. Analysis
Tower Semiconductor’s revenue edged up modestly to $1.44B in 2024, with net income halving from $518M in 2023 to $208M in 2024, indicating margin pressure. Gross margin stands at a leaner 23.64%, while net margin declined to 14.47%. The sharp EBIT drop of 68.6% in 2024 highlights operational challenges and weakening profitability momentum.
Margin Strength vs. Revenue Momentum
Teradyne commands higher margins and sustained profitability, while Tower shows revenue growth but suffers steep margin erosion recently. Teradyne’s superior efficiency and stable margins make it the clearer fundamental winner. Investors seeking steady, margin-driven profit growth may prefer Teradyne’s profile over Tower’s volatile earnings.
Financial Ratios Comparison
These vital ratios act as a diagnostic tool to expose the underlying fiscal health, valuation premiums, and capital efficiency of the companies compared below:
| Ratios | Teradyne, Inc. (TER) | Tower Semiconductor Ltd. (TSEM) |
|---|---|---|
| ROE | 19.8% | 7.8% |
| ROIC | 18.4% | 6.4% |
| P/E | 54.6x | 27.5x |
| P/B | 10.8x | 2.16x |
| Current Ratio | 1.76 | 6.18 |
| Quick Ratio | 1.41 | 5.23 |
| D/E | 0.12 | 0.07 |
| Debt-to-Assets | 8.3% | 5.9% |
| Interest Coverage | 86.4x | 32.6x |
| Asset Turnover | 0.76 | 0.47 |
| Fixed Asset Turnover | 4.99 | 1.11 |
| Payout ratio | 13.8% | 0% |
| Dividend yield | 0.25% | 0% |
| Fiscal Year | 2025 | 2024 |
Efficiency & Valuation Duel: The Vital Signs
Financial ratios serve as a company’s DNA, exposing hidden risks and operational strengths essential for investor insight.
Teradyne, Inc.
Teradyne posts a robust 19.8% ROE and a solid 17.4% net margin, signaling strong profitability. However, its valuation appears stretched with a high 54.6 P/E and 10.8 P/B, reflecting premium pricing. The company returns value modestly through a 0.25% dividend yield, balancing payouts with substantial reinvestment in R&D for growth.
Tower Semiconductor Ltd.
Tower Semiconductor shows weaker profitability, with a 7.8% ROE and a 14.5% net margin. Its valuation is more moderate, at 27.5 P/E and 2.16 P/B, though still on the higher side. The firm pays no dividend, instead investing heavily in capital expenditure and R&D, signaling a growth-focused capital allocation strategy amid operational challenges.
Premium Valuation vs. Operational Safety
Teradyne offers superior profitability but at a premium valuation, increasing risk for valuation-sensitive investors. Tower Semiconductor trades cheaper but delivers weaker returns and no dividends. Teradyne suits investors prioritizing operational strength, while Tower may appeal to those seeking growth exposure with caution on profitability.
Which one offers the Superior Shareholder Reward?
Teradyne, Inc. (TER) delivers a modest dividend yield near 0.38%, backed by a conservative payout ratio around 14%. It sustains dividends with strong free cash flow, yielding 2.9/share in FCF. TER also actively repurchases shares, enhancing total returns. Tower Semiconductor Ltd. (TSEM) pays no dividends, focusing cash flow on growth and acquisitions, but free cash flow coverage is weak at just 0.11/share, signaling limited buyback capacity. TER’s balanced yield and buyback strategy offers a more sustainable, attractive total return profile for 2026 investors than TSEM’s reinvestment-heavy, no-yield approach.
Comparative Score Analysis: The Strategic Profile
The radar chart reveals the fundamental DNA and trade-offs of Teradyne, Inc. and Tower Semiconductor Ltd., highlighting their strategic financial strengths and weaknesses:
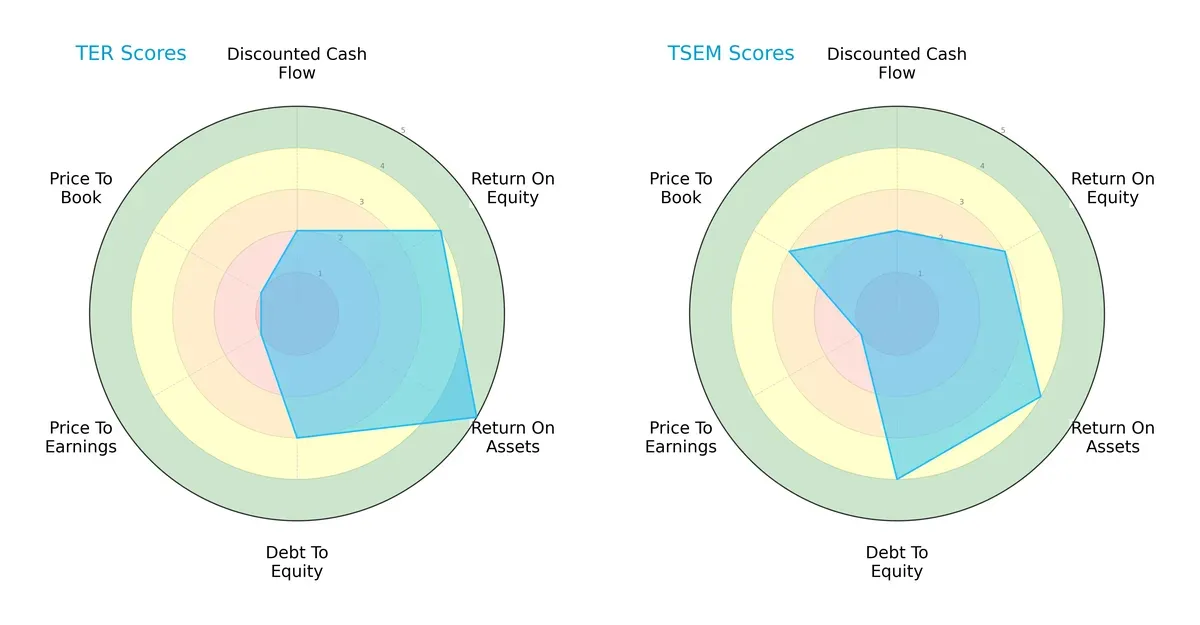
Teradyne excels in asset utilization (ROA 5) and return on equity (ROE 4), showing operational efficiency. Tower Semiconductor boasts a stronger balance sheet with a better debt-to-equity score (4 vs. 3) and a more attractive price-to-book valuation (3 vs. 1). Both share moderate DCF scores (2) and very unfavorable P/E scores (1). Teradyne’s profile is more weighted toward profitability, while Tower leans on financial stability and valuation.
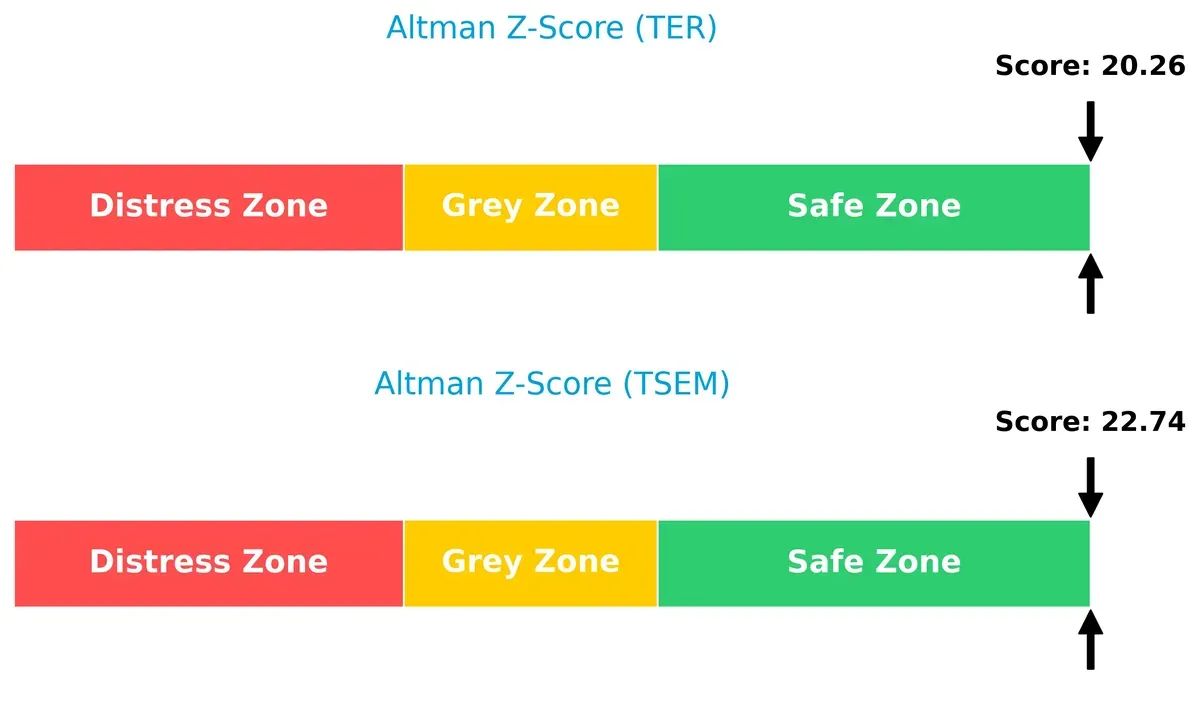
Bankruptcy Risk: Solvency Showdown
The Altman Z-Scores place both companies comfortably in the safe zone, with Tower Semiconductor slightly ahead (22.7 vs. 20.3). This margin suggests both firms possess robust financial health to withstand cyclical downturns and maintain long-term viability:
Financial Health: Quality of Operations
Tower Semiconductor’s Piotroski F-Score of 7 indicates strong operational quality. Teradyne’s score of 6 is solid but suggests a few weaker internal financial metrics relative to Tower:

How are the two companies positioned?
This section dissects the operational DNA of Teradyne and Tower Semiconductor by comparing their revenue distribution and internal dynamics. The final objective confronts their economic moats to reveal which model offers the most resilient, sustainable competitive advantage today.
Revenue Segmentation: The Strategic Mix
This visual comparison dissects how Teradyne, Inc. and Tower Semiconductor Ltd. diversify their income streams and where their primary sector bets lie:
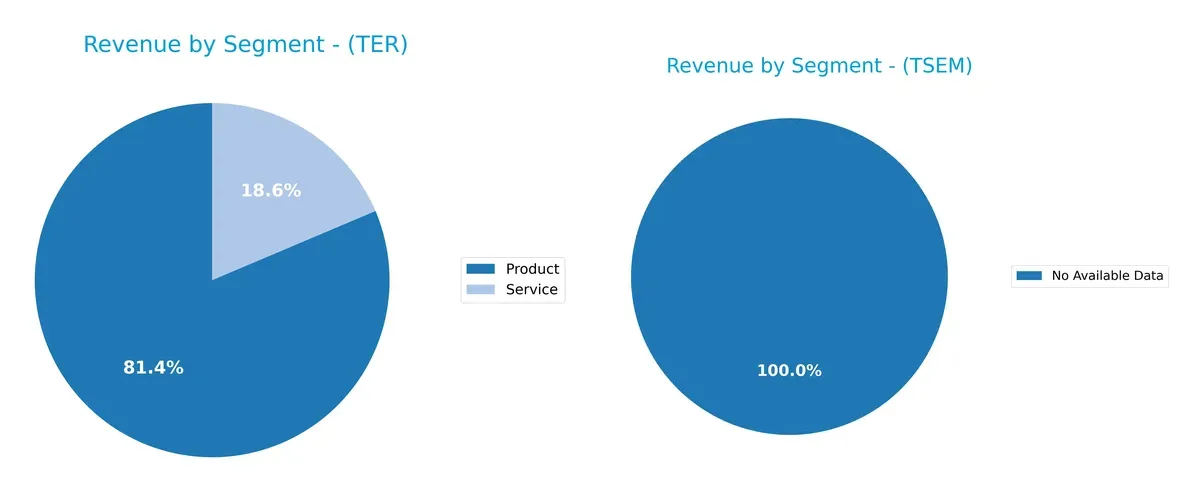
Teradyne anchors its revenue in the Product segment with $2.3B in 2024, complemented by $525M from Services, showing moderate diversification. Tower Semiconductor lacks available data, preventing direct comparison. Teradyne’s reliance on product sales signals strong exposure to semiconductor equipment cycles but balanced by service revenues that reduce concentration risk. This mix supports ecosystem lock-in through integrated product-service offerings, a strategic edge in capital-intensive tech sectors.
Strengths and Weaknesses Comparison
This table compares the Strengths and Weaknesses of Teradyne, Inc. and Tower Semiconductor Ltd.:
Teradyne Strengths
- High profitability with net margin 17.37% and ROE 19.82%
- Strong capital efficiency, ROIC 18.45% above WACC
- Low leverage with debt-to-assets 8.32% and strong interest coverage
- Solid liquidity ratios, current ratio 1.76 and quick ratio 1.41
- Diversified revenue from products and services totaling over 2.8B USD
- Global presence with balanced sales across Asia, US, and EMEA
Tower Semiconductor Strengths
- Favorable WACC at 7.98% supports cost-effective capital use
- Low debt-to-assets at 5.87% and good interest coverage
- Strong quick ratio 5.23 shows liquidity strength
- Competitive net margin 14.47% in semiconductor sector
- Reasonable price-to-book 2.16, reflecting moderate valuation pressure
Teradyne Weaknesses
- Elevated WACC at 12.35% signals higher capital costs
- High valuation multiples, PE 54.64 and PB 10.83, may limit upside
- Dividend yield very low at 0.25%
- Asset turnover moderate at 0.76, indicating efficiency improvement potential
Tower Semiconductor Weaknesses
- Low ROE at 7.83% and neutral ROIC 6.41% suggest weaker profitability
- Unfavorable current ratio 6.18 hints at working capital inefficiency
- Asset turnover 0.47 is low, limiting revenue generation from assets
- No dividend yield reduces income appeal
- PE 27.54 remains relatively high for earnings growth
Teradyne excels in profitability and global diversification but faces valuation and capital cost headwinds. Tower Semiconductor shows financial prudence and liquidity but struggles with profitability and asset efficiency. These contrasts highlight differing strategic focuses in capital allocation and growth execution.
The Moat Duel: Analyzing Competitive Defensibility
A structural moat is the only reliable shield protecting long-term profits from relentless competitive erosion:
Teradyne, Inc.: Intangible Assets and Technological Dominance
Teradyne’s moat stems from advanced automated test equipment and strong industry relationships. Its high ROIC over WACC reflects efficient capital use. New automation and wireless test expansions in 2026 could deepen this edge but margin pressure warns of looming threats.
Tower Semiconductor Ltd.: Process Technology Specialization
Tower’s moat relies on customizable analog and mixed-signal foundry services, contrasting Teradyne’s test equipment focus. Despite a negative ROIC spread, improving profitability signals operational gains. Expansion into emerging markets and advanced chip processes offers growth but competition remains fierce.
Verdict: Automated Testing Innovation vs. Foundry Specialization
Teradyne’s wider moat benefits from consistent value creation despite declining ROIC. Tower’s improving trend is encouraging but still trails in capital efficiency. Teradyne stands better poised to defend market share in the evolving semiconductor landscape.
Which stock offers better returns?
Over the past year, both Teradyne, Inc. and Tower Semiconductor Ltd. experienced strong price gains, with notable acceleration in their upward trends and increasing trading volumes reflecting robust investor interest.
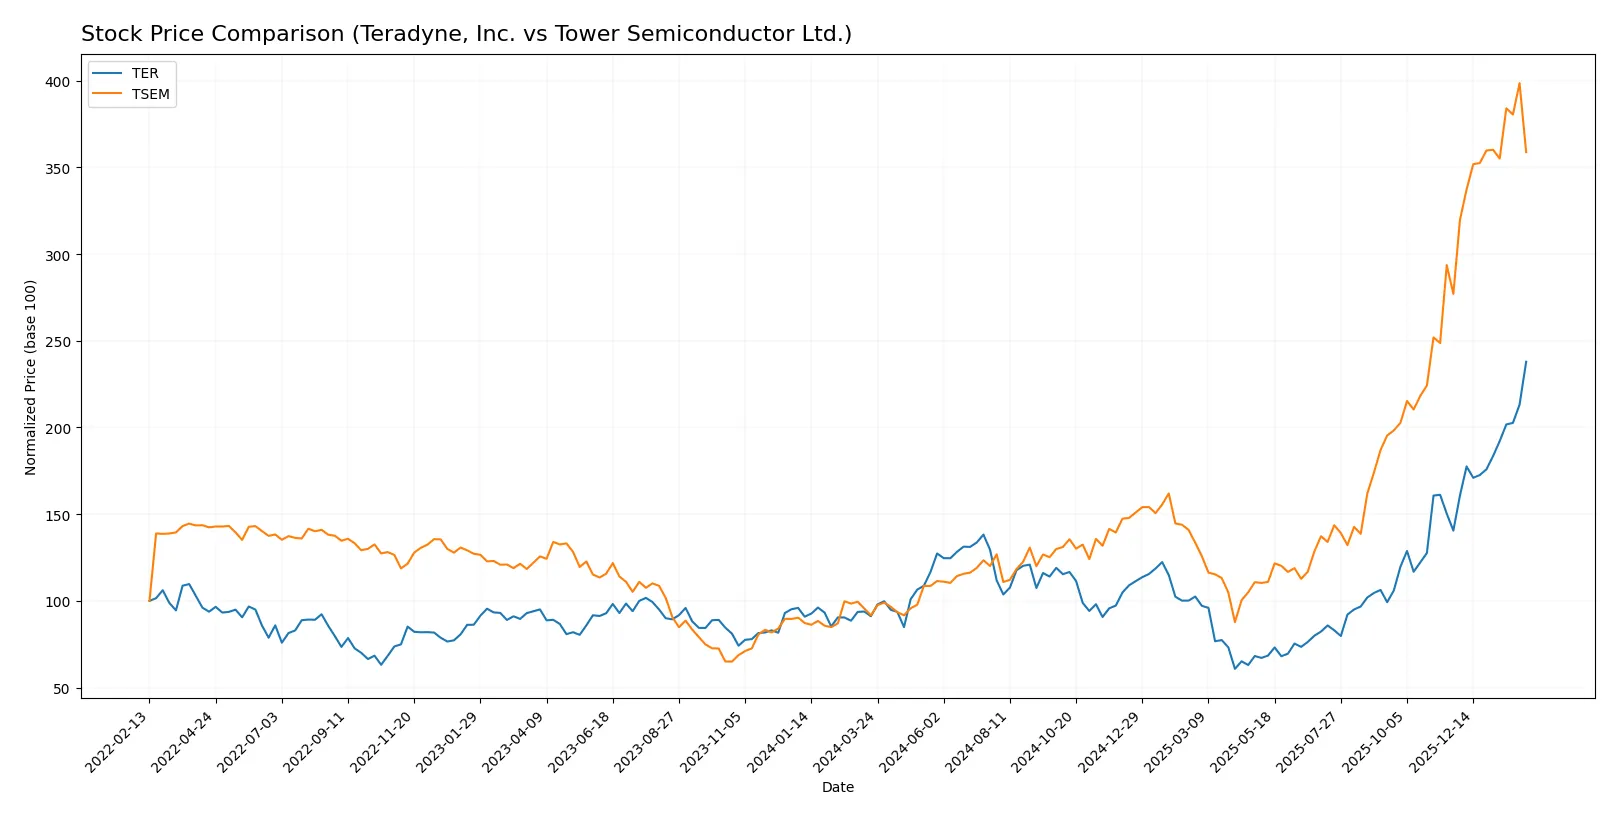
Trend Comparison
Teradyne’s stock price surged 161.08% over 12 months, showing a bullish trend with accelerating momentum and high volatility, peaking at $269.07 and bottoming at $68.72.
Tower Semiconductor’s stock rose 291.48% in the same period, also bullish with accelerating gains and moderate volatility, reaching a high of $134.73 and a low of $29.65.
Tower Semiconductor outperformed Teradyne with a significantly higher total return over the last year, despite Teradyne’s stronger recent buyer dominance.
Target Prices
Analysts project a positive outlook with solid upside potential for both Teradyne, Inc. and Tower Semiconductor Ltd.
| Company | Target Low | Target High | Consensus |
|---|---|---|---|
| Teradyne, Inc. | 175 | 335 | 276.08 |
| Tower Semiconductor Ltd. | 66 | 125 | 96 |
Teradyne’s consensus target price sits slightly above its current price of 269, suggesting moderate upside. Tower Semiconductor’s target consensus of 96 is below its current 121, indicating potential downside or market caution.

Don’t Let Luck Decide Your Entry Point
Optimize your entry points with our advanced ProRealTime indicators. You’ll get efficient buy signals with precise price targets for maximum performance. Start outperforming now!
How do institutions grade them?
Teradyne, Inc. Grades
The following table summarizes recent institutional grades for Teradyne, Inc.:
| Grading Company | Action | New Grade | Date |
|---|---|---|---|
| Cantor Fitzgerald | Maintain | Overweight | 2026-02-04 |
| Goldman Sachs | Maintain | Buy | 2026-02-04 |
| Stifel | Maintain | Buy | 2026-02-04 |
| Evercore ISI Group | Maintain | Outperform | 2026-02-04 |
| Citigroup | Maintain | Buy | 2026-02-04 |
| Evercore ISI Group | Maintain | Outperform | 2026-02-03 |
| Cantor Fitzgerald | Maintain | Overweight | 2026-02-02 |
| Stifel | Maintain | Buy | 2026-01-30 |
| UBS | Maintain | Buy | 2026-01-26 |
| B of A Securities | Maintain | Buy | 2026-01-22 |
Tower Semiconductor Ltd. Grades
The following table summarizes recent institutional grades for Tower Semiconductor Ltd.:
| Grading Company | Action | New Grade | Date |
|---|---|---|---|
| Benchmark | Maintain | Buy | 2026-01-09 |
| Wedbush | Downgrade | Neutral | 2025-12-31 |
| Benchmark | Maintain | Buy | 2025-11-11 |
| Susquehanna | Maintain | Positive | 2025-11-11 |
| Wedbush | Maintain | Outperform | 2025-11-11 |
| Barclays | Maintain | Equal Weight | 2025-11-11 |
| Benchmark | Maintain | Buy | 2025-09-08 |
| Susquehanna | Maintain | Positive | 2025-08-05 |
| Benchmark | Maintain | Buy | 2025-08-05 |
| Benchmark | Maintain | Buy | 2025-08-04 |
Which company has the best grades?
Teradyne, Inc. consistently receives strong Buy and Outperform ratings. Tower Semiconductor’s ratings are mixed, including a recent downgrade to Neutral. Teradyne’s more favorable grades suggest stronger institutional confidence, which may affect investor sentiment positively.
Risks specific to each company
The following categories identify the critical pressure points and systemic threats facing both firms in the 2026 market environment:
1. Market & Competition
Teradyne, Inc.
- Faces high competition in semiconductor test and automation with advanced product lines but a demanding tech cycle.
Tower Semiconductor Ltd.
- Operates in a competitive foundry market, challenged by larger peers and technology shifts in analog and mixed-signal devices.
2. Capital Structure & Debt
Teradyne, Inc.
- Maintains low debt (D/E 0.12) with strong interest coverage (81.4x), supporting financial flexibility.
Tower Semiconductor Ltd.
- Has very low debt (D/E 0.07) and solid interest coverage (31.6x), but an unusually high current ratio signals potential working capital inefficiency.
3. Stock Volatility
Teradyne, Inc.
- Exhibits high beta (1.82), implying greater stock volatility and market sensitivity.
Tower Semiconductor Ltd.
- Shows moderate beta (0.89), suggesting relatively lower stock volatility and steadier price movements.
4. Regulatory & Legal
Teradyne, Inc.
- Must navigate U.S. tech export controls and IP protection laws, with moderate geopolitical risk.
Tower Semiconductor Ltd.
- Faces complex regulatory environments across Israel, Asia, and Europe, increasing compliance challenges.
5. Supply Chain & Operations
Teradyne, Inc.
- Relies on global semiconductor demand and supply chain resilience for test equipment delivery.
Tower Semiconductor Ltd.
- Dependent on wafer fabrication supply chains vulnerable to geopolitical tensions and raw material access.
6. ESG & Climate Transition
Teradyne, Inc.
- Growing focus on sustainable manufacturing and robotic automation enhances its ESG profile.
Tower Semiconductor Ltd.
- ESG pressures rising, especially on energy use and emissions in semiconductor fabrication facilities.
7. Geopolitical Exposure
Teradyne, Inc.
- Primarily U.S.-based, exposed to U.S.-China trade tensions affecting semiconductor supply chains.
Tower Semiconductor Ltd.
- Israeli base with exposure to Middle East tensions and global supply chain risks in Asia.
Which company shows a better risk-adjusted profile?
Teradyne’s key risk lies in market volatility and high valuation multiples, which may pressure returns despite solid fundamentals. Tower Semiconductor faces operational and geopolitical risks due to its complex international footprint and supply chain vulnerabilities. Teradyne’s superior capital structure and financial ratios position it better for risk-adjusted returns. Its Altman Z-score of 20.3 confirms strong financial health. Meanwhile, Tower’s operational inefficiencies and moderate ROIC signal caution. Recent stock declines (-4.9% TER vs. -11.1% TSEM) reinforce concerns about Tower’s exposure and valuation risks. Overall, Teradyne offers a more balanced risk-return profile in 2026’s uncertain semiconductor landscape.
Final Verdict: Which stock to choose?
Teradyne, Inc. impresses with its superpower of delivering strong returns on invested capital well above its cost of capital. Its disciplined capital allocation and robust cash generation stand out. A point of vigilance is its declining profitability trend, which requires monitoring. Teradyne suits an Aggressive Growth portfolio seeking quality and scale.
Tower Semiconductor Ltd. builds its moat on a solid balance sheet and improving profitability trajectory. Its recurring operational cash flow and conservative leverage offer relative safety versus Teradyne. However, slower asset turnover and modest returns temper exuberance. Tower fits a GARP (Growth at a Reasonable Price) strategy focused on steady improvement.
If you prioritize efficient capital deployment and market leadership, Teradyne outshines thanks to its value creation despite some margin pressure. However, if you seek better financial stability combined with a rising profitability trend, Tower Semiconductor offers a compelling scenario. Both stocks merit consideration under distinct investor profiles but command different risk-reward postures.
Disclaimer: Investment carries a risk of loss of initial capital. The past performance is not a reliable indicator of future results. Be sure to understand risks before making an investment decision.
Go Further
I encourage you to read the complete analyses of Teradyne, Inc. and Tower Semiconductor Ltd. to enhance your investment decisions: