Home > Comparison > Technology > TXN vs TER
The strategic rivalry between Texas Instruments Incorporated and Teradyne, Inc. shapes the semiconductor industry’s evolution. Texas Instruments operates as a diversified semiconductor manufacturer, focusing on analog and embedded processing products. Teradyne, by contrast, excels as a specialized test equipment provider with strong industrial automation capabilities. This analysis pits a broad-based manufacturer against a niche equipment leader to identify which trajectory offers superior risk-adjusted returns for a resilient, diversified portfolio.
Table of contents
Companies Overview
Texas Instruments and Teradyne both play pivotal roles in the semiconductor industry, shaping technology’s cutting edge.
Texas Instruments Incorporated: Analog and Embedded Semiconductor Powerhouse
Texas Instruments dominates the semiconductor market through its Analog and Embedded Processing segments. It generates revenue by selling power management products, signal chain components, and microcontrollers to industrial, automotive, and consumer electronics markets. In 2026, its strategy emphasizes innovation in power efficiency and broadening its footprint in embedded processing to capture diverse end-market applications.
Teradyne, Inc.: Leader in Automated Test Equipment
Teradyne specializes in automatic test equipment, catering to semiconductor manufacturers and industrial automation. Its revenue stems from semiconductor test systems, industrial robotics, and wireless device testing platforms. In 2026, Teradyne focuses on expanding its industrial automation segment and enhancing wireless test solutions amid growing demand for complex semiconductor validation.
Strategic Collision: Similarities & Divergences
Texas Instruments and Teradyne differ fundamentally: Texas Instruments sells core semiconductor components, while Teradyne provides the testing infrastructure behind them. The battleground lies in semiconductor innovation versus quality assurance systems. Investors face contrasting profiles—Texas Instruments offers scale and diversified semiconductor products, whereas Teradyne delivers specialized, high-margin test technologies with growing automation exposure.
Income Statement Comparison
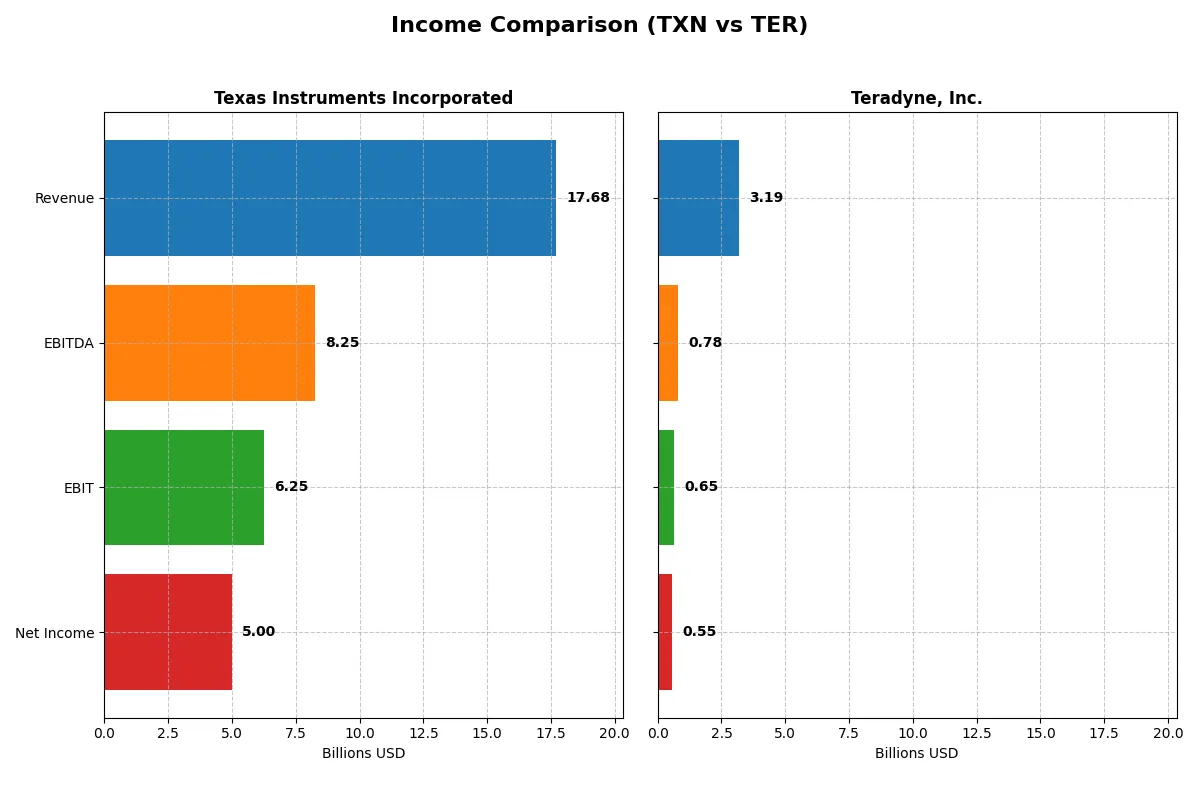
This data dissects the core profitability and scalability of both corporate engines, revealing who dominates the bottom line:
| Metric | Texas Instruments Incorporated (TXN) | Teradyne, Inc. (TER) |
|---|---|---|
| Revenue | 17.7B | 3.19B |
| Cost of Revenue | 7.6B | 1.32B |
| Operating Expenses | 4.06B | 1.17B |
| Gross Profit | 10.1B | 1.87B |
| EBITDA | 8.25B | 780M |
| EBIT | 6.25B | 653M |
| Interest Expense | 543M | 8M |
| Net Income | 5.0B | 554M |
| EPS | 5.45 | 3.49 |
| Fiscal Year | 2025 | 2025 |
Income Statement Analysis: The Bottom-Line Duel
This income statement comparison reveals which company delivers superior operational efficiency and profit generation in a challenging market.
Texas Instruments Incorporated Analysis
Texas Instruments shows a mixed revenue trajectory, falling 3.6% over five years but rebounding with a 13% increase in 2025 to $17.7B. Net income declined sharply by 35.6% over the period, finishing at $5B in 2025. The company maintains strong gross (57%) and net margins (28%), signaling solid cost control and profitability despite recent margin compression.
Teradyne, Inc. Analysis
Teradyne exhibits a sharper revenue decline of nearly 14% over five years, hitting $3.2B in 2025, but grew 13% year-over-year. Net income dropped 45.4% over the period to $554M, reflecting more volatility. Gross margin stands at 59%, slightly above Texas Instruments, yet net margin at 17% trails significantly, indicating higher operating costs relative to sales.
Margin Strength vs. Revenue Resilience
Texas Instruments leads with a wider net margin and larger revenue base, demonstrating better scale and profitability despite a recent dip in earnings. Teradyne’s higher gross margin suggests efficient production, but its lower net margin and smaller revenue highlight operational pressures. For investors, Texas Instruments’ profile offers more robust profit generation and steadier revenue momentum.
Financial Ratios Comparison
These vital ratios act as a diagnostic tool to expose the underlying fiscal health, valuation premiums, and capital efficiency of the companies compared below:
| Ratios | Texas Instruments (TXN) | Teradyne (TER) |
|---|---|---|
| ROE | 30.7% | 19.8% |
| ROIC | 16.5% | 18.4% |
| P/E | 31.5 | 54.6 |
| P/B | 9.7 | 10.8 |
| Current Ratio | 4.35 | 1.76 |
| Quick Ratio | 2.83 | 1.41 |
| D/E | 0.86 | 0.12 |
| Debt-to-Assets | 40.6% | 8.3% |
| Interest Coverage | 11.1 | 86.4 |
| Asset Turnover | 0.51 | 0.76 |
| Fixed Asset Turnover | 1.44 | 4.99 |
| Payout Ratio | 100.0% | 13.8% |
| Dividend Yield | 3.17% | 0.25% |
| Fiscal Year | 2025 | 2025 |
Efficiency & Valuation Duel: The Vital Signs
Ratios act as a company’s DNA, revealing hidden risks and operational excellence critical to investment decisions.
Texas Instruments Incorporated
Texas Instruments delivers a robust 30.7% ROE and a strong 28.3% net margin, indicating efficient profitability. The stock trades at a stretched P/E of 31.5 and a high P/B of 9.7, signaling expensive valuation. It rewards shareholders with a solid 3.17% dividend yield, balancing growth investments in R&D at 11.8% of sales.
Teradyne, Inc.
Teradyne posts a respectable 19.8% ROE and a 17.4% net margin, showing solid but lower profitability than peers. The valuation appears stretched with a P/E of 54.6 and P/B of 10.8. It maintains a low dividend yield of 0.25%, favoring reinvestment heavily into R&D at 15.8% of revenue to fuel growth.
Premium Valuation vs. Operational Safety
Texas Instruments offers higher profitability and a meaningful dividend, but at a premium valuation with some liquidity concerns. Teradyne boasts better leverage and cash flow ratios yet suffers from elevated multiples and minimal dividends. Investors seeking income and stable returns may prefer Texas Instruments, while growth-focused profiles might lean toward Teradyne’s reinvestment strategy.
Which one offers the Superior Shareholder Reward?
Texas Instruments (TXN) delivers a more compelling shareholder reward than Teradyne (TER). TXN pays a robust 3.17% dividend yield with nearly 100% payout coverage, signaling strong free cash flow discipline. It combines dividends with moderate buybacks, sustaining long-term returns. TER’s dividend yield is negligible at 0.25%, with a low 14% payout ratio, favoring reinvestment over distributions. TER’s buyback intensity lags TXN’s, limiting total shareholder return. TXN’s model balances cash return and reinvestment prudently, while TER’s growth strategy is riskier for income investors. I conclude TXN offers the superior total return profile in 2026.
Comparative Score Analysis: The Strategic Profile
The radar chart reveals the fundamental DNA and trade-offs of Texas Instruments and Teradyne, highlighting their strategic strengths and vulnerabilities:
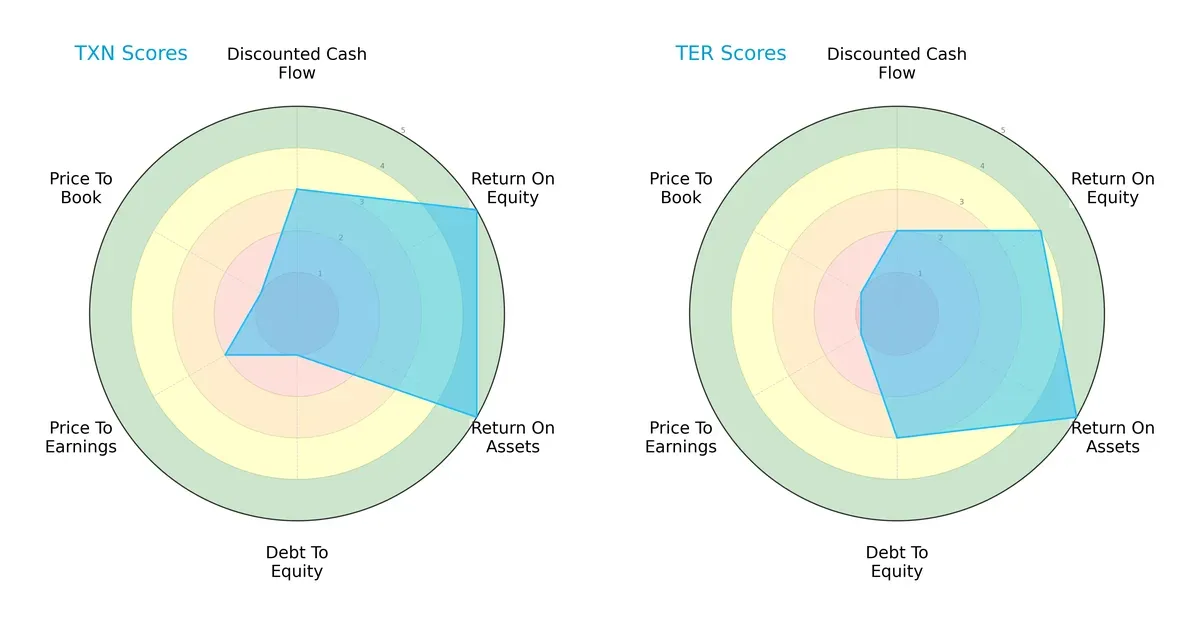
Texas Instruments excels in return on equity (5) and return on assets (5), signaling superior profitability and asset utilization. Teradyne matches in ROA (5) but lags slightly in ROE (4). Teradyne shows a more conservative debt profile (3 vs. 1), indicating better leverage management. Both firms face valuation challenges with low P/E and P/B scores, but Texas Instruments has a slight edge in discounted cash flow (3 vs. 2). Overall, Texas Instruments presents a more balanced profile driven by operational efficiency, while Teradyne leans on financial prudence.
Bankruptcy Risk: Solvency Showdown
The Altman Z-Score delta strongly favors Teradyne’s long-term survival prospects in this cycle:
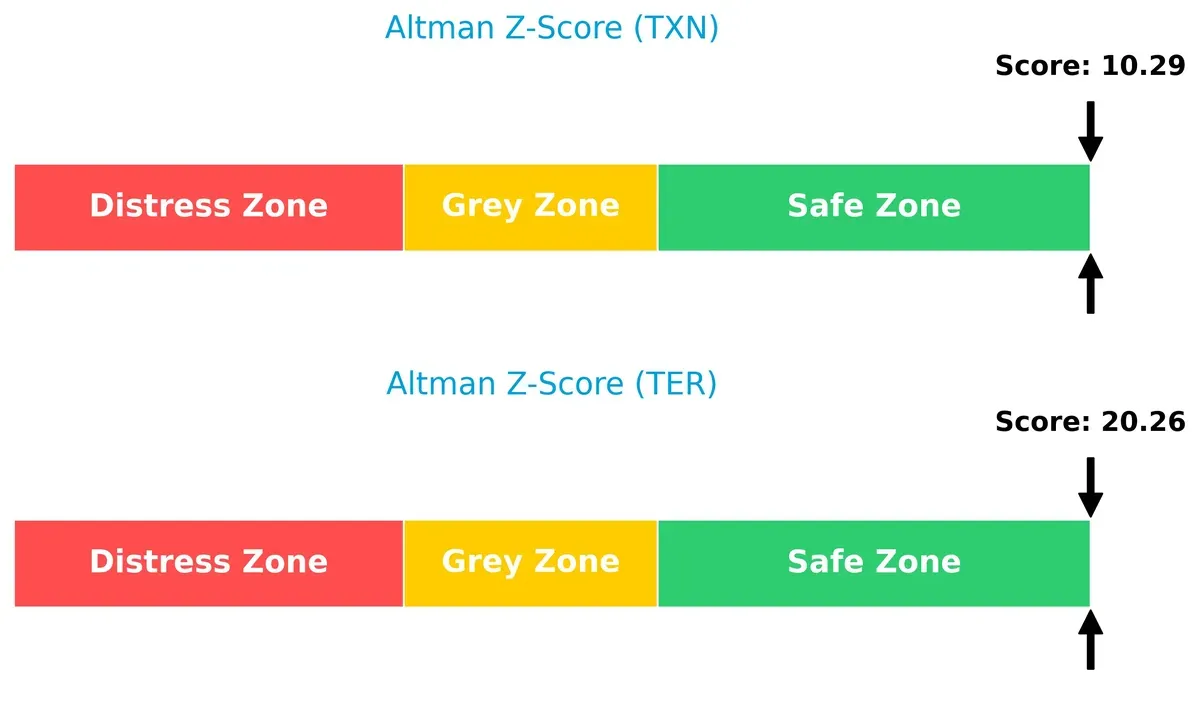
Teradyne’s Z-score of 20.3 far exceeds Texas Instruments’ 10.3, placing both safely above distress thresholds but underscoring Teradyne’s superior financial stability and resilience against bankruptcy risk.
Financial Health: Quality of Operations
Piotroski F-Scores reveal Texas Instruments’ healthier operational quality compared to Teradyne:
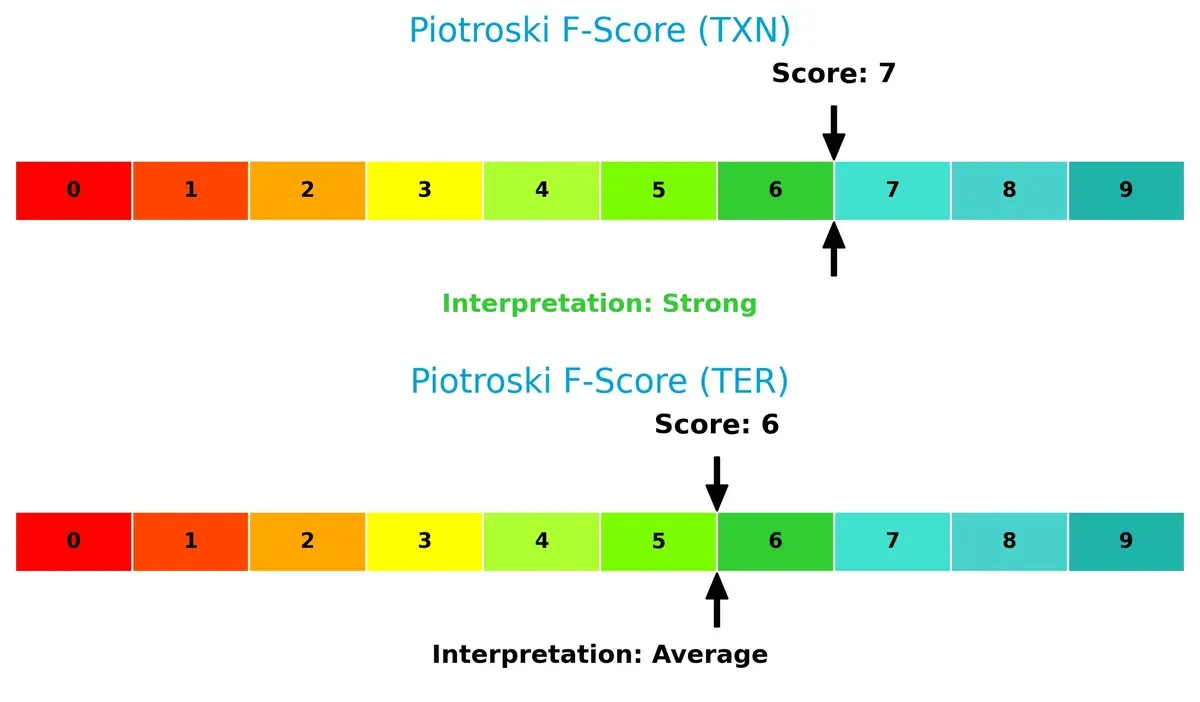
Texas Instruments scores a robust 7, signaling strong financial health. Teradyne’s score of 6 is average, suggesting potential red flags in internal metrics. This gap indicates Texas Instruments manages profitability, leverage, and efficiency more effectively.
How are the two companies positioned?
This section dissects the operational DNA of Texas Instruments and Teradyne by comparing their revenue distribution and internal strengths and weaknesses. The goal is to confront their economic moats and identify which business model offers the most resilient competitive advantage today.
Revenue Segmentation: The Strategic Mix
This visual comparison dissects how Texas Instruments and Teradyne diversify their income streams and where their primary sector bets lie:
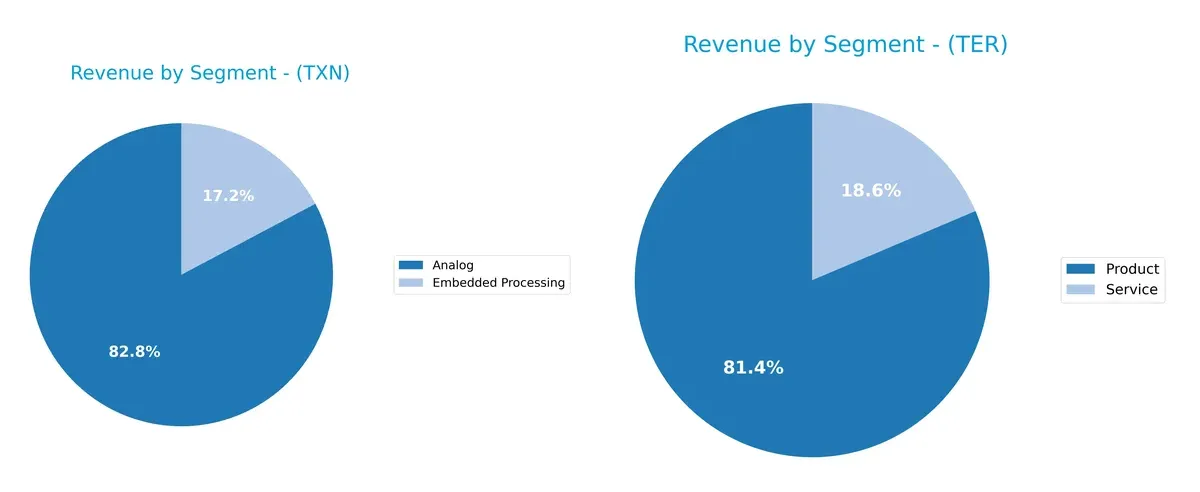
Texas Instruments anchors revenue heavily in Analog at $12.2B in 2024, with Embedded Processing at $2.5B, showing moderate diversification. Teradyne pivots on Product sales, $2.3B, complemented by $525M in Services, signaling a leaner but balanced mix. TI’s focus reflects ecosystem lock-in in semiconductors, while Teradyne’s split between product and service reduces concentration risk in industrial automation testing.
Strengths and Weaknesses Comparison
This table compares the Strengths and Weaknesses of Texas Instruments and Teradyne:
Texas Instruments Strengths
- High net margin (28.3%) and ROE (30.7%) demonstrate strong profitability
- Robust quick ratio (2.83) indicates good liquidity
- Significant dividend yield (3.17%) supports shareholder returns
- Diverse product portfolio with Analog and Embedded Processing segments
- Broad global presence with major revenue from US, China, and EMEA
Teradyne Strengths
- Favorable net margin (17.4%) and ROIC (18.5%) show effective capital use
- Very strong interest coverage (81.4) and low debt-to-assets (8.3%) reduce financial risk
- High fixed asset turnover (4.99) indicates efficient asset use
- Product and Service revenue streams support business diversification
- Global sales spread across Asia and the US enhance market reach
Texas Instruments Weaknesses
- Unfavorable high P/E (31.5) and P/B (9.7) ratios suggest possible overvaluation
- Excessively high current ratio (4.35) may indicate inefficient asset use
- Moderate debt level with debt-to-assets at 40.6% could constrain flexibility
- Asset turnover ratio is neutral, indicating room for improvement
- Limited product diversification mainly focused on Analog and Embedded Processing
Teradyne Weaknesses
- Unfavorable high WACC (12.4%) increases capital costs
- Very high P/E (54.6) and P/B (10.8) imply expensive valuation
- Low dividend yield (0.25%) may deter income-focused investors
- Geographic revenue less concentrated in large markets compared to TXN
- Asset turnover neutral, indicating average operational efficiency
Texas Instruments shows strong profitability and liquidity with a broad geographic footprint, but valuation and asset utilization raise caution. Teradyne excels in financial risk management and operational efficiency, yet faces valuation and capital cost challenges. Both companies display complementary strengths and specific areas needing strategic focus.
The Moat Duel: Analyzing Competitive Defensibility
A structural moat is the only reliable shield protecting long-term profits from relentless competitive erosion. Let’s dissect the moats of two semiconductor leaders:
Texas Instruments Incorporated: Intangible Assets and Cost Advantage
Texas Instruments leverages its deep analog and embedded processing expertise, creating high switching costs and cost advantages. This drives robust 35% EBIT margins and stable returns. New industrial and automotive markets in 2026 may deepen its moat, though rising global competition poses risks.
Teradyne, Inc.: Technology Leadership and Customer Lock-in
Teradyne’s automatic test equipment benefits from specialized technology and strong customer relationships, differentiating it from Texas Instruments’ broader semiconductor play. Its 20% EBIT margin reflects solid positioning. Expansion in industrial automation and 5G wireless testing offers growth avenues, but margin pressure persists amid tech shifts.
Moat Showdown: Cost Leadership vs. Specialized Technology Lock-in
Both companies create value with ROIC surpassing WACC by 8.3% (TXN) and 6.1% (TER), but both face declining profitability trends. Texas Instruments’ broader cost and intangible asset moat edges Teradyne’s niche technology moat. I see Texas Instruments better equipped to defend its market share long term.
Which stock offers better returns?
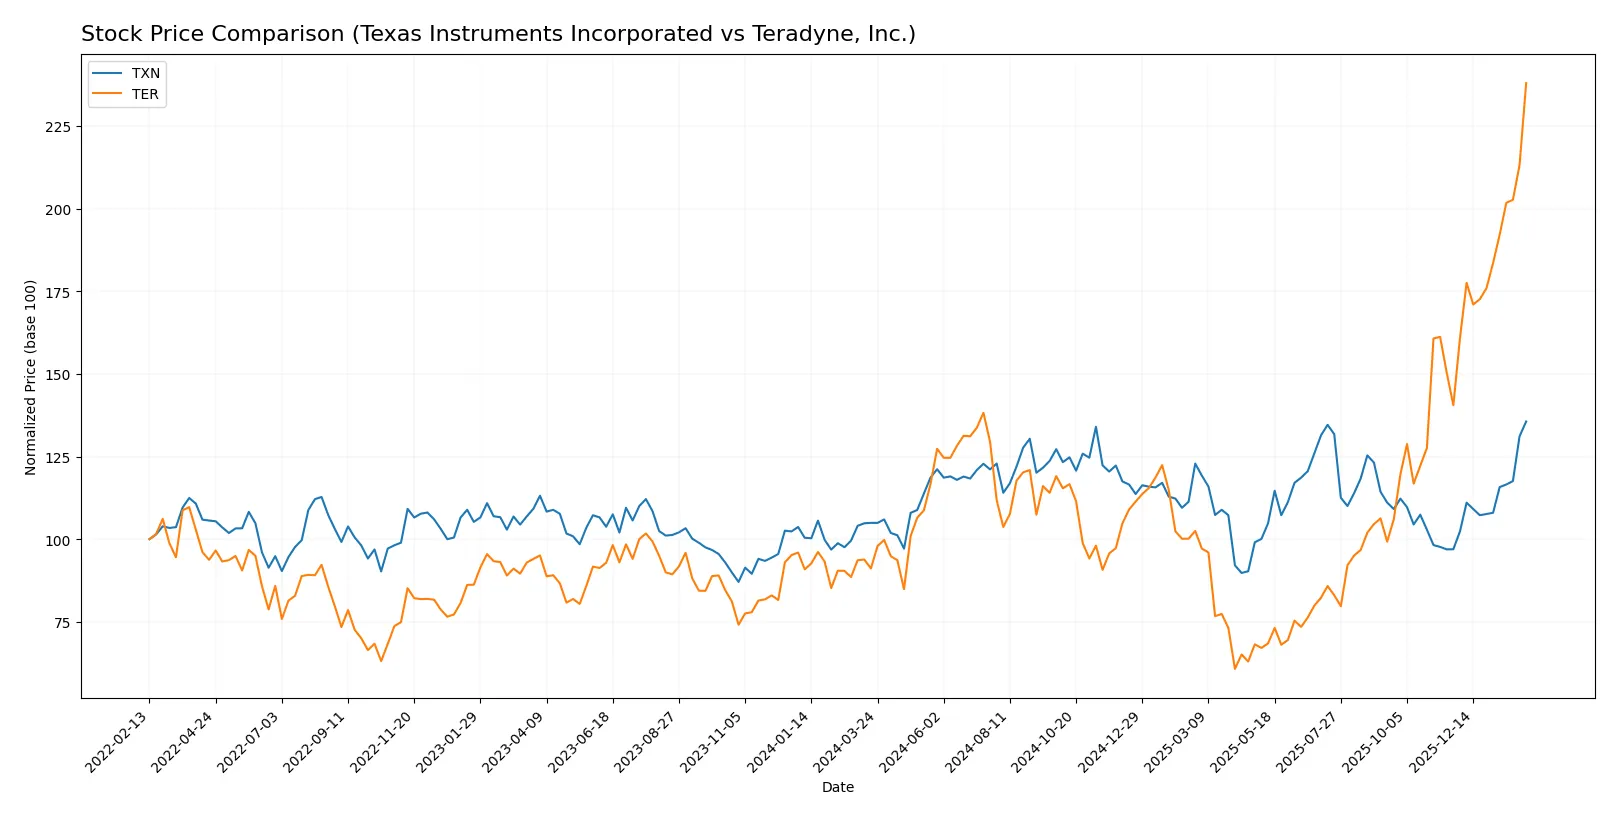
Over the past year, both Texas Instruments and Teradyne exhibited strong upward price momentum, with significant gains and accelerating trends highlighting robust trading dynamics.
Trend Comparison
Texas Instruments posted a 29.21% price increase over the past year, marking a bullish trend with accelerating momentum and a high near 223. Volatility stands moderate at a 16.23% standard deviation.
Teradyne surged 161.08% in the same period, also bullish with accelerating gains, hitting a peak of 269.07. Its volatility is higher, reflected by a 39.2% standard deviation.
Teradyne’s stock has outperformed Texas Instruments significantly, delivering the highest market returns and stronger price acceleration over the past year.
Target Prices
Analysts show a moderately bullish consensus for Texas Instruments and Teradyne, reflecting confidence in their semiconductor market positions.
| Company | Target Low | Target High | Consensus |
|---|---|---|---|
| Texas Instruments Incorporated | 160 | 260 | 204.64 |
| Teradyne, Inc. | 175 | 335 | 276.08 |
The target consensus suggests upside potential for Texas Instruments, with the current price at 223, slightly above consensus. Teradyne’s consensus at 276 implies modest upside from its current 269.

Don’t Let Luck Decide Your Entry Point
Optimize your entry points with our advanced ProRealTime indicators. You’ll get efficient buy signals with precise price targets for maximum performance. Start outperforming now!
How do institutions grade them?
Here is a summary of recent institutional grades for Texas Instruments Incorporated and Teradyne, Inc.:
Texas Instruments Incorporated Grades
The following table shows the latest grades from major financial institutions for Texas Instruments Incorporated.
| Grading Company | Action | New Grade | Date |
|---|---|---|---|
| Jefferies | Maintain | Hold | 2026-01-28 |
| Cantor Fitzgerald | Maintain | Neutral | 2026-01-28 |
| Goldman Sachs | Maintain | Sell | 2026-01-28 |
| Truist Securities | Maintain | Hold | 2026-01-28 |
| Deutsche Bank | Maintain | Hold | 2026-01-28 |
| Stifel | Maintain | Hold | 2026-01-28 |
| UBS | Maintain | Buy | 2026-01-28 |
| B of A Securities | Upgrade | Neutral | 2026-01-28 |
| Wells Fargo | Maintain | Equal Weight | 2026-01-28 |
| JP Morgan | Maintain | Overweight | 2026-01-28 |
Teradyne, Inc. Grades
This table lists the most recent institutional grades for Teradyne, Inc.
| Grading Company | Action | New Grade | Date |
|---|---|---|---|
| Cantor Fitzgerald | Maintain | Overweight | 2026-02-04 |
| Goldman Sachs | Maintain | Buy | 2026-02-04 |
| Stifel | Maintain | Buy | 2026-02-04 |
| Evercore ISI Group | Maintain | Outperform | 2026-02-04 |
| Citigroup | Maintain | Buy | 2026-02-04 |
| Evercore ISI Group | Maintain | Outperform | 2026-02-03 |
| Cantor Fitzgerald | Maintain | Overweight | 2026-02-02 |
| Stifel | Maintain | Buy | 2026-01-30 |
| UBS | Maintain | Buy | 2026-01-26 |
| B of A Securities | Maintain | Buy | 2026-01-22 |
Which company has the best grades?
Teradyne, Inc. consistently receives Buy, Overweight, and Outperform ratings, indicating stronger institutional confidence. Texas Instruments shows more Hold and Neutral grades, which may imply a cautious outlook. Investors might interpret Teradyne’s grades as signaling higher growth expectations or momentum.
Risks specific to each company
The following categories identify the critical pressure points and systemic threats facing both firms in the 2026 market environment:
1. Market & Competition
Texas Instruments Incorporated
- Faces intense competition in analog and embedded processing markets; mature product lines pressure growth.
Teradyne, Inc.
- Operates in niche test equipment markets with higher growth potential but faces rapid tech shifts and new entrants.
2. Capital Structure & Debt
Texas Instruments Incorporated
- Moderate leverage with debt-to-assets at 40.62%; interest coverage strong at 11.52x but debt-to-equity score is very unfavorable.
Teradyne, Inc.
- Low leverage with debt-to-assets at 8.32% and interest coverage at 81.43x; debt profile is a clear strength.
3. Stock Volatility
Texas Instruments Incorporated
- Beta near 1 (0.995) indicates market-correlated volatility, relatively stable.
Teradyne, Inc.
- High beta at 1.821 signals elevated volatility, increasing risk for investors sensitive to market swings.
4. Regulatory & Legal
Texas Instruments Incorporated
- Subject to semiconductor export controls and environmental regulations impacting manufacturing.
Teradyne, Inc.
- Regulatory risks in defense and wireless test segments; export restrictions could disrupt sales.
5. Supply Chain & Operations
Texas Instruments Incorporated
- Relies on global semiconductor supply chains vulnerable to geopolitical tensions and raw material shortages.
Teradyne, Inc.
- Supply chain exposed to fabless and foundry partners; operational complexity in multiple test segments.
6. ESG & Climate Transition
Texas Instruments Incorporated
- Increasing pressure to reduce carbon footprint in manufacturing; ESG initiatives essential to maintain investor appeal.
Teradyne, Inc.
- ESG concerns in robotics and automation sectors; climate transition could require capital investments.
7. Geopolitical Exposure
Texas Instruments Incorporated
- Significant exposure to US-China trade tensions affecting semiconductor sales and supply chain.
Teradyne, Inc.
- Less direct exposure but sensitive to global defense spending trends and semiconductor industry geopolitics.
Which company shows a better risk-adjusted profile?
Texas Instruments’ key risk is its elevated leverage ratio despite strong profitability, which could pressure balance sheet resilience in downturns. Teradyne faces significant stock volatility and valuation concerns, reflecting market sensitivity and growth expectations. Overall, Teradyne exhibits a better risk-adjusted profile thanks to its low debt and strong operational niche, despite higher beta. The contrast in debt-to-assets ratios (40.62% vs. 8.32%) justifies my caution toward Texas Instruments’ capital structure risk.
Final Verdict: Which stock to choose?
Texas Instruments Incorporated (TXN) excels as a cash-generating powerhouse with a robust economic moat, delivering impressive returns on equity and invested capital. Its key point of vigilance lies in a stretched current ratio that could pressure short-term liquidity. TXN suits portfolios targeting Stable Income with a growth edge.
Teradyne, Inc. (TER) stands out for its strategic moat anchored in automation technology and strong capital efficiency. Its conservative debt profile offers greater financial safety compared to TXN. TER appeals to Growth at a Reasonable Price (GARP) investors who seek exposure to innovation with moderate risk.
If you prioritize steady cash flow and dividend income, TXN is the compelling choice due to its superior profitability and defensive balance sheet. However, if you seek higher growth potential with disciplined capital use, TER offers better stability and a more conservative leverage profile, commanding a premium in innovation-driven sectors.
Disclaimer: Investment carries a risk of loss of initial capital. The past performance is not a reliable indicator of future results. Be sure to understand risks before making an investment decision.
Go Further
I encourage you to read the complete analyses of Texas Instruments Incorporated and Teradyne, Inc. to enhance your investment decisions: